Rental Affordability Crisis: Where Is Cost Burden Worst?
In 2016, the share of cost-burdened renters, or those spending 30 percent or more of their income on rent, reached the lowest level since 2008. Despite the decrease, nearly half of renters remain cost burdened and one-quarter of renters are severely cost burdened, spending more than half their income on rent.
The decrease in cost burden is due to growth in renter incomes, which outpaced increases in rent prices, but this is largely the result of an influx of high-income earners in the rental market, rather than an increase in the wages of existing renters.
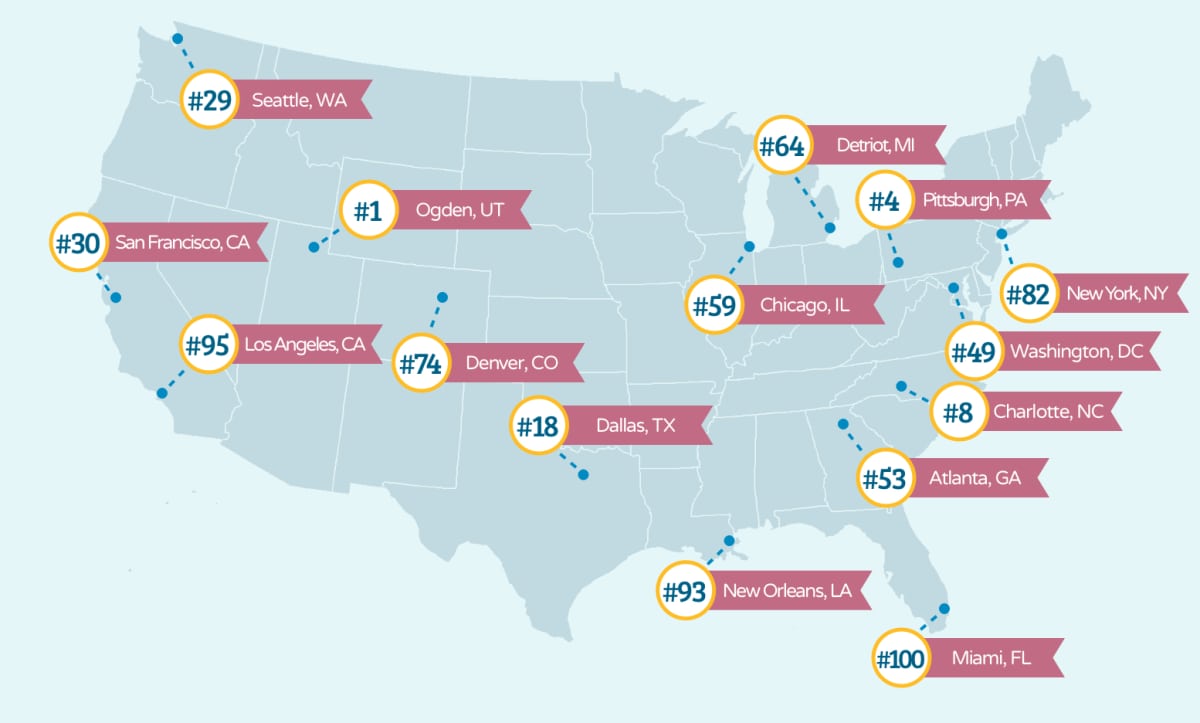
Florida and California have the largest shares of cost-burdened renters, while the South and Midwest remain more affordable.
Cost burden increased in metros where increases in rental prices outpaced income growth, including in Los Angeles, Washington, D.C., and New York.
Introduction
As the U.S. renter population nears 44 million households -- or 37 percent of U.S. households -- and rents increase nationwide, rental affordability remains an important concern. Nearly half of U.S. renters are “cost burdened,” spending 30 percent or more of their income on rent. As illustrated in previous Apartment List research, the vast majority of low-income renters do not receive rental assistance. Nearly one in five renters were unable to pay their rent in full in the past three months. Households that struggle to pay rent often cut back spending on other basic necessities and may ultimately face eviction, with lasting consequences. The inability to pay rent in full is more common with low-income renters because unexpected expenses, such as medical bills or car repairs, often leave these renters with little income left over to put towards rent.
To better understand the affordability challenges facing renters, Apartment List analyzed U.S. Census data from 2005 to 2016 on the share of income renters spend on housing. We divided renters into three groups: 1) Not cost burdened; 2) Moderately cost burdened; 3) Severely cost burdened.
Apartment List then looked at Census data on median rents and renter incomes to understand how they drive affordability.
Share of Cost Burdened Renters Fell Below 50% for the First Time Since 2008
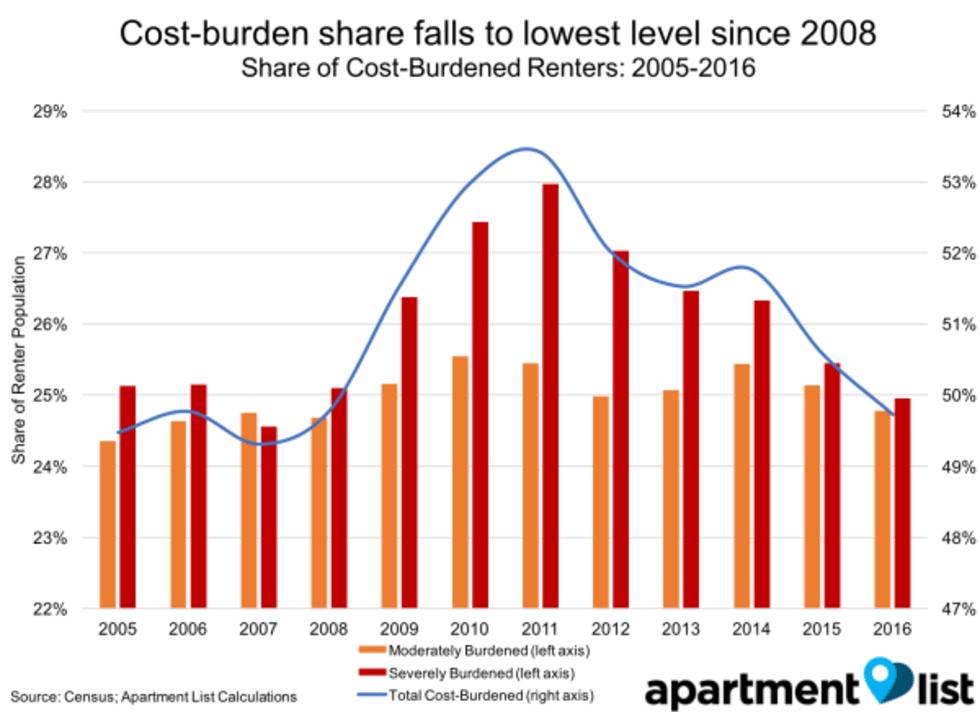
In 2016, the share of cost-burdened renters fell for the third consecutive year to 49.7 percent, the lowest share since the Great Recession. The share of cost-burdened renters is down 0.9 percentage points in 2016 from last year, and 3.7 percentage points below the 2011 peak of 53.4 percent. Not only has the share of cost-burdened renters fallen at the national level since the recession, 91 metros out of the 100 largest metros now have lower cost burden rates than in 2011.
The share of moderately burdened renters has remained relatively stable over the past sixteen years. The share of severely burdened renters, on the other hand, increased significantly during the recession, and has been falling since 2011. Results from the 2014 Consumer Expenditure Survey show that cost-burdened households must cut back in other areas, spending 41 percent less on food and 74 percent less on healthcare than their non-cost burdened counterparts.
The share of severely cost-burdened renters has fallen 3 percentage points between 2011 and 2016, while the share of moderately burdened renters has fallen 0.7 percentage points. During the recession, some moderately cost-burdened renters fell into the severely burdened category due to a job loss or pay cut. While the moderately cost-burdened population share remained more stable, the composition of this group changed, as moderately burdened renters became severely burdened, and renters who were not cost burdened before the recession became moderately cost burdened.
One in Four Renters is Severely Cost-Burdened, Spending 50% of more of their Income on Rent
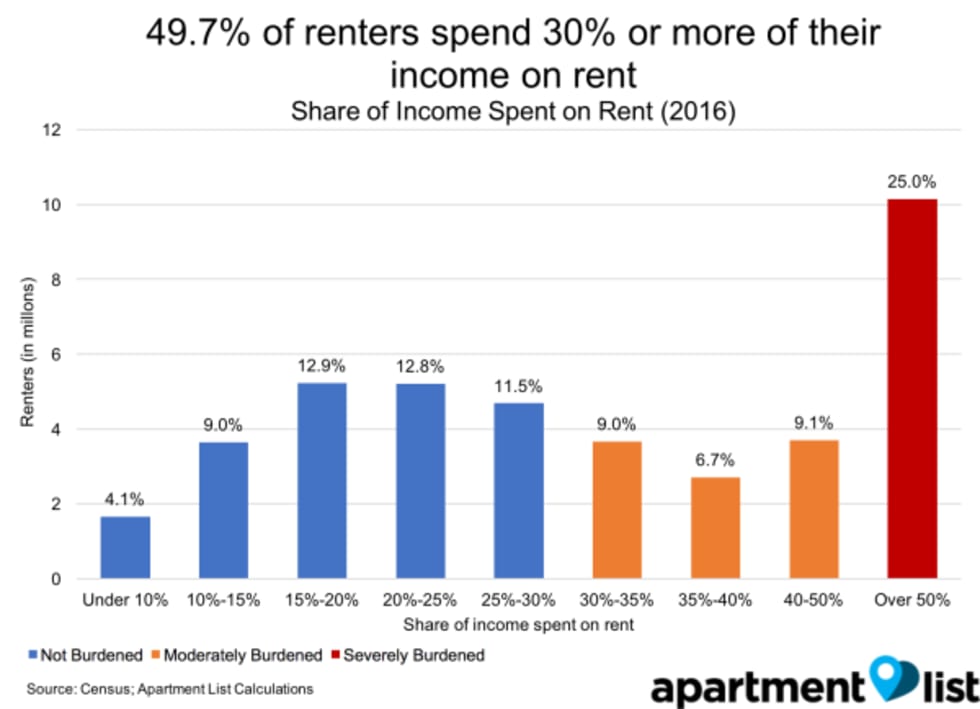
Despite the decrease in the cost burdened share of renter population, affordability remains a major concern. About half of renters spent 30 percent or more of their income on rent, and a staggering 25 percent of renters spend 50 percent or more of their income on rent. The share of cost-burdened renters has doubled since 1960 when just 24 percent of renters spent 30 percent or more of their income on rent.
Renters are significantly more cost-burdened than homeowners, with only 28.3 percent of homeowners spending 30 percent or more of their income on rent, compared to 49.7 percent of renters. Only 11.1 percent of homeowners are severely cost burdened, less than half the rate for renters. Homeowners tend to have higher median incomes, $73,127 compared to $37,264, and are more insulated to price changes once they have purchased a home and signed a mortgage. Lower income and cost-burdened households are less likely to become homeowners, as it’s difficult to save enough for a downpayment. Unfortunately, this creates a cycle where poor families are stuck in the rental market, struggling with increasing rents and unable to build wealth through homeownership.
Renter Incomes Continue to Outpace Rents, Improving Affordability Measures
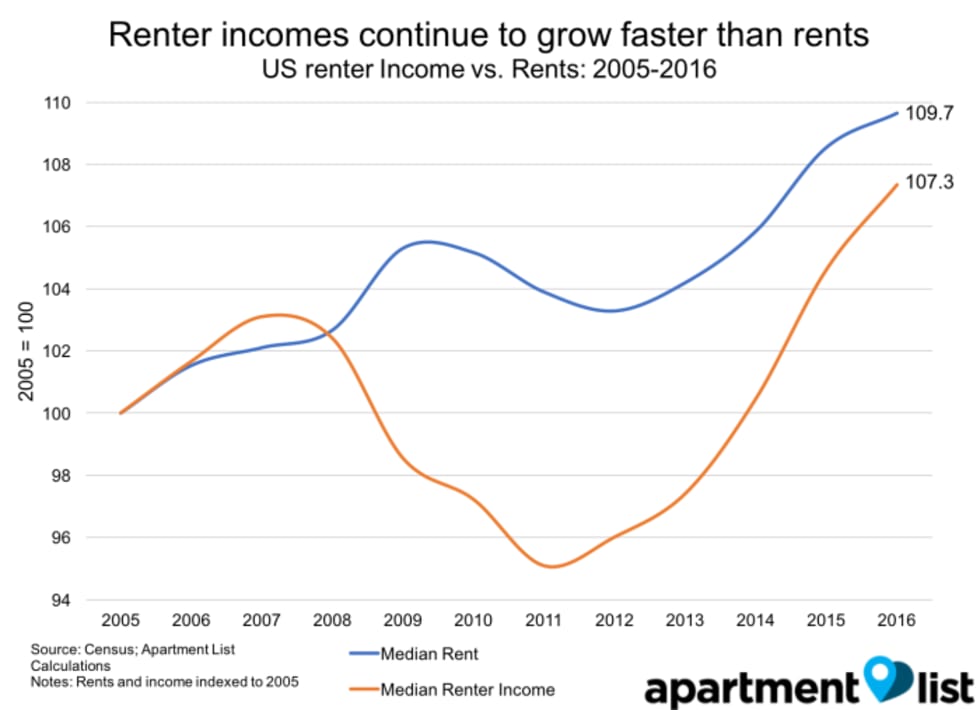
To understand the drivers of the decreasing share of cost-burdened renters, we compared median rents and median renter incomes in the U.S. from 2005 to 2016. Since 2005, rents increased by 9.7 percent, while renter incomes increased by 7.3 percent over the same period. From 2007 to 2011, incomes fell sharply while rents did not, causing an increase in the share of cost-burdened renters. More recently, renter incomes have been increasing faster than rents, helping to explain the decrease in the share of renters who are cost burdened. However, this decrease doesn’t necessarily mean that individual renters are any better off. The decrease in cost-burdened renters may be driven by an increase in high-income renters, rather than an increase in the wages of existing renters.
Increase in Share of High-Income Renters Helping Drive Decrease in Cost Burdens
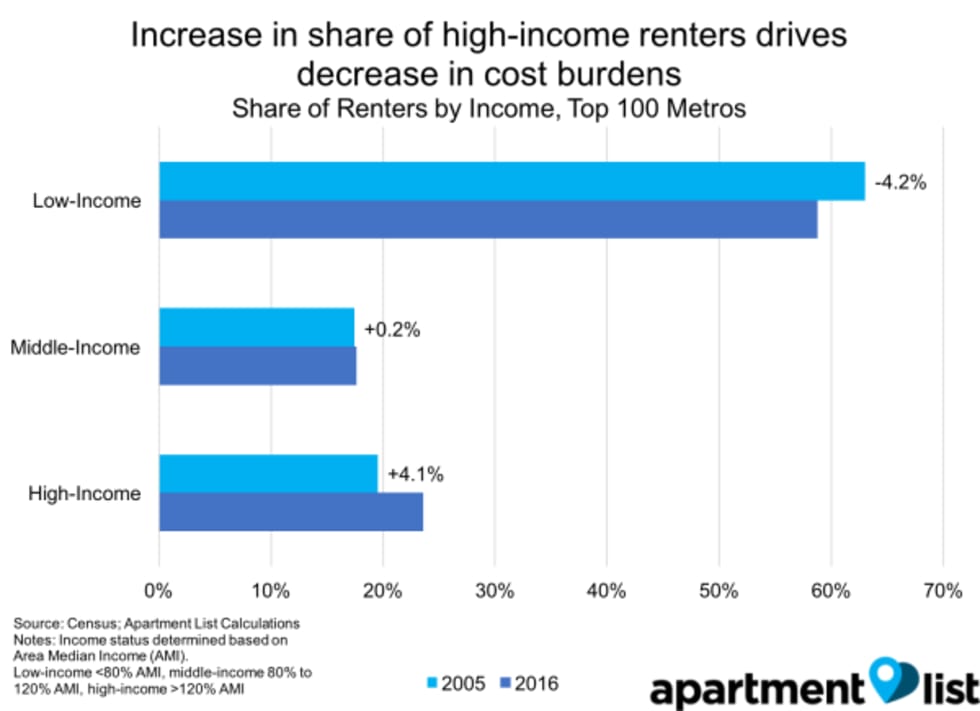
Although renters earn much less than homeowners, renter income has grown much faster than homeowner income. From 2005 to 2016 renter income increased 7.3 percent, compared to just 1.4 percent for homeowners. Although this rapid increase in renter income and a decrease in the share of cost-burdened renters appears to be good news for low-income renters, this overall trend appears to be driven by an increase in high-income renters, rather than an increase in income for low-income renters.
From 2005 to 2016, the share of renter households earning over 120 percent of the area median income (AMI) increased by 4.1 percentage points, while the share earning under 80 percent of the AMI fell by a similar amount. This trend is driven both by high-income renters delaying homeownership and by low-income renters being priced out of the rental market. Poor renters pushed out of the rental market may move to cheaper areas, double up with family members or other low-income renters or end up homeless.
Additionally, there is evidence that rents have been increasing faster than wages for low-wage and less-educated workers. A recent Apartment List analysis showed that from 2005 to 2015, “post-rent wages,” or wages left after deducting median rent costs, decreased for service workers (-7 percent) and blue-collar workers (-5 percent), while only knowledge workers saw an increase (6 percent). Stagnant wages for working-class Americans indicate that these gains in renter wages are primarily due to a change in the composition of renter households, with more high-income households renting.
Florida and California Home to Some of the Most Unaffordable Metros for Renters
The share of cost-burdened renters is 49.7 percent nationwide, but this figure varies significantly across metros. Of the largest 100 metros in the U.S., Miami has the highest share of cost-burdened renters at 62.8 percent, while Ogden, Utah, has the lowest share, at 37.9 percent.
Five of the top 10 most cost burdened large metros -- Fresno, Oxnard, Riverside, Los Angeles and San Diego -- are located in California. Despite high rents in the San Jose and San Francisco metros, these cities have lower shares of cost burdened renters, 48.3 percent and 46.8 percent respectively, due to the large share of high-income renters.
Many smaller Southern metros, located in Texas, Louisiana, Mississippi and Alabama, have high cost burden rates, as well. For example, between 57 percent and 65 percent percent of renters are cost burdened in Laurel, Miss., Laredo, Tex., Shreveport, La., and Montgomery, Ala.
Metros located in the Midwest, Rust Belt and South are more affordable for renters. For example, the Southern metros of Raleigh (No. 3), Louisville (No. 7), Charlotte (No. 8) and Knoxville (No. 9) all have cost burden rates of under 45 percent. Pennsylvania metros also fair well, with Harrisburg, Pittsburgh and Scranton in the top 10 most affordable large metros.
Largest Decrease in Cost Burden in Affordable Inland Metros with Strong Job Growth
Compared to 2005, cost burden is now lower in 47 metros out of the 100 largest metros, with the largest decrease in the share of cost-burdened renters in the Midwest and Mountain regions. Utah and Idaho metros, including Ogden, Utah (No. 1), Boise, Idaho (No. 4) and Provo, Utah (No. 6), have seen some of the biggest decreases in cost-burdened renters, driven by strong job and wage growth. Midwest and Rust Belt metros that have been able to build up new industries outside of manufacturing, such as Pittsburgh (No. 3), Cleveland (No. 5), Grand Rapids (No. 8) and Minneapolis (No. 11), have seen increased affordability.
Other metros have become significantly less affordable for renters since 2005, with the share of cost-burdened renters increasing by large margins. For example, 53 percent of Chattanooga, Tenn., renters were cost burdened in 2016, compared to just 45 percent in 2005. In 2005, Des Moines, Iowa, was the most affordable metro, with just 39 percent of renters spending 30 percent or more of their income on rent. Unfortunately, the share of cost burdened renters in Des Moines grew to 46 percent in 2016. Other metros that experienced large increases in the share of cost burdened renters include the Connecticut metros of Bridgeport and Hartford, as well as in New Orleans and Honolulu.
Only nine metros of the top 100 metros currently have higher cost burden rates than during the peak of the recession. These metros are a mix of metros with struggling economies and those with skyrocketing rents. For example, Springfield, Mass., Fresno, Calif., and Richmond have all experienced slow economic growth and increases in the share of cost-burdened renters. The picture is more mixed for tech hubs that have experienced both rapid job growth and steep rent increases. For example, the share of cost burdened renters has increased in San Jose and Denver since 2011, but decreased in Seattle, Austin and San Francisco.
Cost Burden Increased in Metros where Rent Growth Outpaced Income Growth
Nationwide, the growth in renter incomes has outpaced rent growth for the past few years, causing a decrease in the share of cost burdened renters. At the metro level, the picture is more varied, with rent growth outpacing income growth in many metros. In the metros that fall above the dotted line, income has grown faster than rents; below the dotted line, the opposite is true. Individual marks are sized by population and shaded based on the change in the cost burden rate: red indicates that the share of cost-burdened renters in a metro has increased, while green indicated that it has decreased.
As illustrated, cost burdens tend to decrease when income growth outpaces rent growth.
- Metros in the bottom left corner, including Bridgeport and Las Vegas, have seen income decreases and low-rent growth, leading to an increase in the share of cost-burdened renters.
- Metros in the top right corner tend to be tech hubs, for example San Francisco, Seattle and Austin. These metros have experienced rapid rent growth, but incomes have increased rapidly as well, causing the share of cost-burdened renters to fall. Part of the rise may come from more high-income renters moving to these metros, while lower-income renters are pushed out.
- Although rent growth has been slower in large, pricey metros such as Washington, D.C., Los Angeles and New York, than in tech hubs, renter incomes have not kept pace with rising rents, causing an increase in the share of cost-burdened renters.
- Renters fare best in growing Midwest and Rust Belt metros such as Minneapolis, Columbus, Cleveland and Pittsburgh, where incomes increased faster than rents decreasing the share of cost-burdened renters
- The picture is more varied in Southern metros. Income growth outpaced rent growth and cost burden fell in Houston, Nashville and Raleigh, while wages stagnated and cost burden increased in Chattanooga, Charleston and Richmond.
In some metros, cost burdens decreased despite rents increasing faster than incomes. This indicates a change in the composition of the renter population, either due to renters’ migration in and out of metros or shifts between renter and homeowner populations.
- Secondary markets on the outskirts of pricey coastal hubs have seen cost burdens decrease despite rent increases outpacing incomes, due to an influx of higher income renters priced out of nearby markets. For example, we see this impact in Sacramento (near San Francisco and San Jose), Riverside (near Los Angeles) and Baltimore (outskirts of D.C.).
- Tech hubs, such as Portland and Seattle, have seen a decrease in cost burdens, despite skyrocketing rents due to the influx of well-paid tech workers from other areas, such as the Bay Area. Additionally, the steep rent increases in these metros have likely pushed the poorest renters out of the market.
- Sunbelt metros with growing populations, such as Phoenix, San Antonio and Atlanta, have seen cost burdens decrease despite rent growth outpacing renter income growth. This suggests that new renters moving to these metros earn higher wages than the existing renter population.
Conclusion
Rental affordability is improving, as 2016 marks the fifth consecutive year in which renter incomes increased faster than rents, reducing the share of cost burdened renters. Unfortunately, the decrease in cost-burdened renters is due in part to an increase in high-income households in the rental market. Additionally, with nearly half of renters spending a third of their income on rent, and a quarter of renters spending half of their income on rent, rental affordability remains an important concern.
Cost-burden rates are driven by both changes in rent and changes in income, leading renters in some pricey cities, such as San Francisco and Austin, to fare better than renters in struggling metros, such as Chattanooga and Hartford. Renters fare best in metros with moderate rents and strong wage growth, including Raleigh and Pittsburgh. While the cost burden share may look reasonable in pricey tech hubs, such as Seattle and Portland, this is likely due to a sorting of renters, with high-income renters entering the rental market and poor renters getting displaced.
Despite the decrease in the share of cost-burdened renters, affordability continues to be a challenge for millions of renters. With cost-burdened rates of over 45 percent in most large metros, and over 10 million severely cost burdened renters nationwide, the lack of affordable housing remains a major challenge for renters.
Share this Article
