April 2017 Rent Report

Welcome to the April 2017 National Apartment List Rent Report! After the sharp 1.0% spike we experienced between January and February, our national rent index is continuing to rise, but at a slower rate, with month-over-month growth coming in at 0.4% for March.
Rents still show signs of leveling off in many of the country's most expensive cities, but are rising quickly in the areas surrounding some of those core cities. Read on for a more detailed analysis of the trends we're seeing this month
National index up 0.4% month-over-month
Following a sustained stretch of flat to declining rent growth for much of 2016, our national rent index has now increased in each of the past three months. Last month, we saw a steep 1.0% jump in the index; that pace has slowed a bit this month, with rents growing 0.4% between February and March. For comparison, month-over-month growth rates for the same period in 2016 and 2015 were 0.5% and 0.8%, respectively.
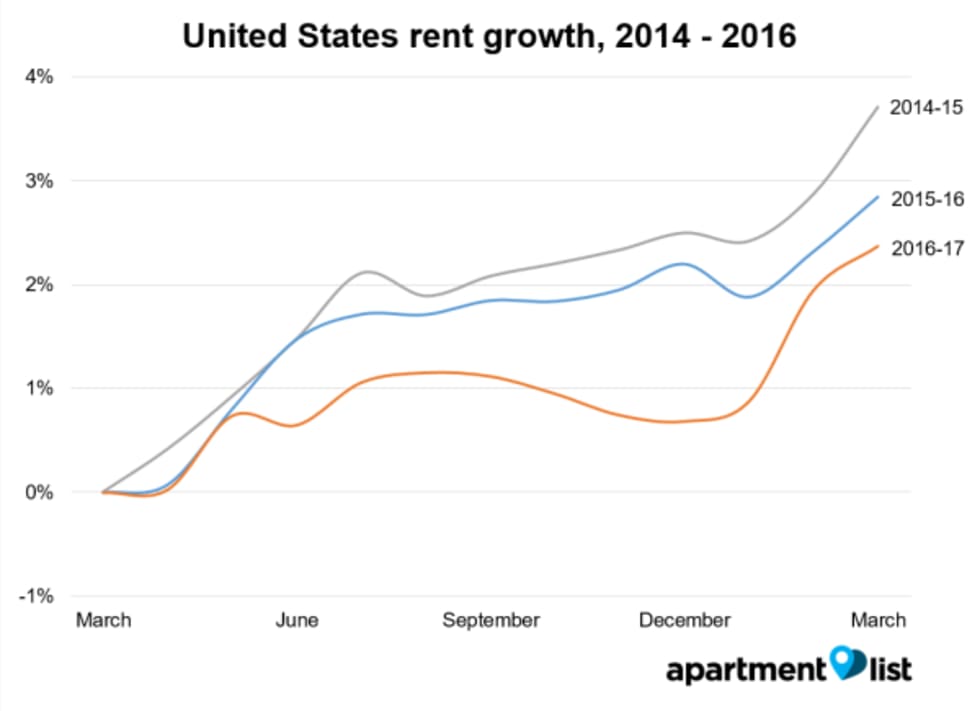
Year-over-year growth at the national level currently stands at 2.4%. This represents an increase over the second half of last year (in December, year-over-year growth came in at 1.3%). However, this rate is still lowered in comparison to recent years; at this time last year, year-over-year growth was 2.8% and in 2015 it was 3.7%.
We expect to continue seeing some seasonal price growth over the next few months, but despite last month's spike, it still seems that growth will continue to lag rates from recent years. With significant numbers of new units coming onto the market in many parts of the country, there are indications that renters will continue to experience at least a small amount of relief from the surging prices that they were faced with throughout the past few years.
Rents still down year-over-year in 19 of 100 largest cities
Despite the growth at the national level, rents decreased over the past month in 30 of the nation's 100 largest cities, and 19 cities have seen rents fall year-over-year. The map below show's year-over-year rent growth for the nation's 100 largest cities (markers are sized by population):
As we've noted previously, some of the cities with the fastest declining rents are also the nation's most expensive. For example, San Francisco has a median 2-bedroom rent of $4,560, and has seen rents decline 1.0% over the past year. A similar pattern holds in Stamford, Miami, and San Jose - each of these cities are among the nation's 10 most expensive, and they have seen year-over-year growth of -4.6%, -1.5%, and 0.0%, respectively.
Declines can also be seen in a number of Midwestern cities, including Des Moines (-2.1%), Kansas City (-1.4%), Cleveland (-0.5%) and Cincinnati (-0.4%). In Texas, while rents continue to rise in some parts of the state, the gulf coast cities of Houston and Corpus Christi both saw declines of more than 2%.
5 of top 10 cities for rent growth are in CA and WA
At the other end of the spectrum, there are many cities throughout the country that are experiencing rapid rent growth. 17 of the 100 largest cities in the country have seen year-over-year growth above 5%. The chart below shows the trends over the past year for the five cities with the biggest increases:
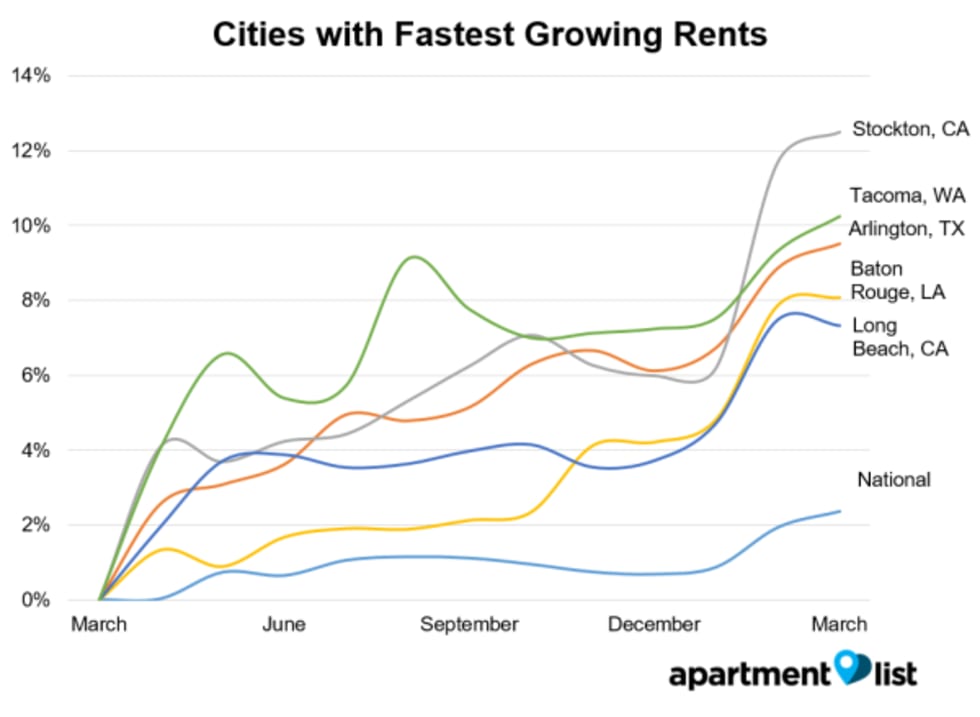
Notably, a number of the cities with the fastest growing rents are located on the outskirts of expensive metros, which seems to indicate that renters who have been priced out of the core cities in these areas are moving further outward. At the top of the list is Stockton, CA, which has seen rents climb by 12.5% over the past year; Stockton is roughly 80 miles outside San Francisco and the median 2-bedroom apartment there costs $1,000, which is less than 1/4 the cost in SF. A similar trend can be seen in the next two cities on the list - Tacoma, WA (+10.2%) is less than an hour away from Seattle, and has a median 2BR rent of $1,220, compared to $2,250 in the larger city; Arlington, TX (+9.5%) has a median 2-bedroom rent of $1,010, compared to $1,760 in nearby Dallas.
The other California cities in the top 10 for year-over-year growth are Long Beach and Anaheim, both of which are a part of the Los Angeles metro area. Vancouver, WA also makes the list with 6.2% year-over-year growth, as the Pacific Northwest continues to experience a boom.
Please see additional data below for the nation's 100 largest cities, or check out the full data for your city or county at our rental data page. And as always, feel free to contact us with any questions!
| City Name | Median 1 BR price | Median 2 BR price | M/M price change | Y/Y price change |
|---|---|---|---|---|
| San Francisco, CA | $3,470 | $4,560 | -0.8% | -1.0% |
| New York, NY | $3,200 | $4,100 | 0.0% | 0.8% |
| Boston, MA | $2,790 | $3,300 | 1.9% | 2.3% |
| Washington, DC | $2,180 | $3,050 | -0.1% | 0.7% |
| Jersey City, NJ | $2,450 | $2,860 | 1.2% | 2.8% |
| Los Angeles, CA | $1,950 | $2,800 | 0.7% | 3.8% |
| San Jose, CA | $2,350 | $2,750 | 0.9% | 0.0% |
| Miami, FL | $1,890 | $2,460 | 0.2% | -1.5% |
| Stamford, CT | $1,920 | $2,400 | -0.5% | -4.6% |
| Seattle, WA | $1,650 | $2,250 | 0.5% | 4.9% |
Check out our rent reports for the following cities:
- Atlanta, GA
- Austin, TX
- Baltimore, MD
- Boston, MA
- Boulder, CO
- Charlotte, NC
- Chicago, IL
- Cleveland, OH
- Colorado Springs, CO
- Dallas, TX
- Denver, CO
- Detroit, MI
- Fort Collins, CO
- Fort Lauderdale, FL
- Houston, TX
- Indianapolis, IN
- Jacksonville, FL
- Los Angeles, CA
- Miami, FL
- Minneapolis, MN
- New York, NY
- Orlando, FL
- Phoenix, AZ
- Raleigh, NC
- San Antonio, TX
- San Diego, CA
- San Francisco, CA
- San Jose, CA
- Seattle, WA
- Tallahassee, FL
- Tampa, FL
- Tucson, AZ
- Washington, DC
If you would like to get future updates from Apartment List Rentonomics, please subscribe to our email list.
Methodology:
Apartment List Rent Report data is drawn monthly from the millions of listings on our site. 1-bedroom and 2-bedroom rents are calculated as the median for units available in the specified size and time period. Price changes are calculated using a “same unit” methodology similar to the Case-Shiller “repeat sales” home prices methodology, taking the average price change for units available across both time periods. For top city rankings, we calculated median 1-bedroom and 2-bedroom rents in 100 top cities and then ranked them by 2-bedroom rents.
About Apartment List Rent Reports:
Apartment List’s Rent Reports cover rental pricing data in major cities, their suburbs, and their neighborhoods. We provide valuable leading indicators of rental price trends, highlight data on top cities, and identify the key facts renters should know. As always, our goal is to provide price transparency to America’s 105 million renters to help them make the best possible decisions in choosing a place to call home. Apartment List publishes Rent Reports during the first calendar week of each month.
Share this Article
