May 2017 Rent Report
Welcome to the May 2017 National Apartment List Rent Report! Our national rent index has increased in each month this year so far, with month-over-month growth coming in at 0.4% for April.
Rents are now rising in most the country's biggest markets, though growth is still flat or down in some of the priciest areas. Read on for a more detailed analysis of the trends we're seeing this month
National index up 0.4% month-over-month
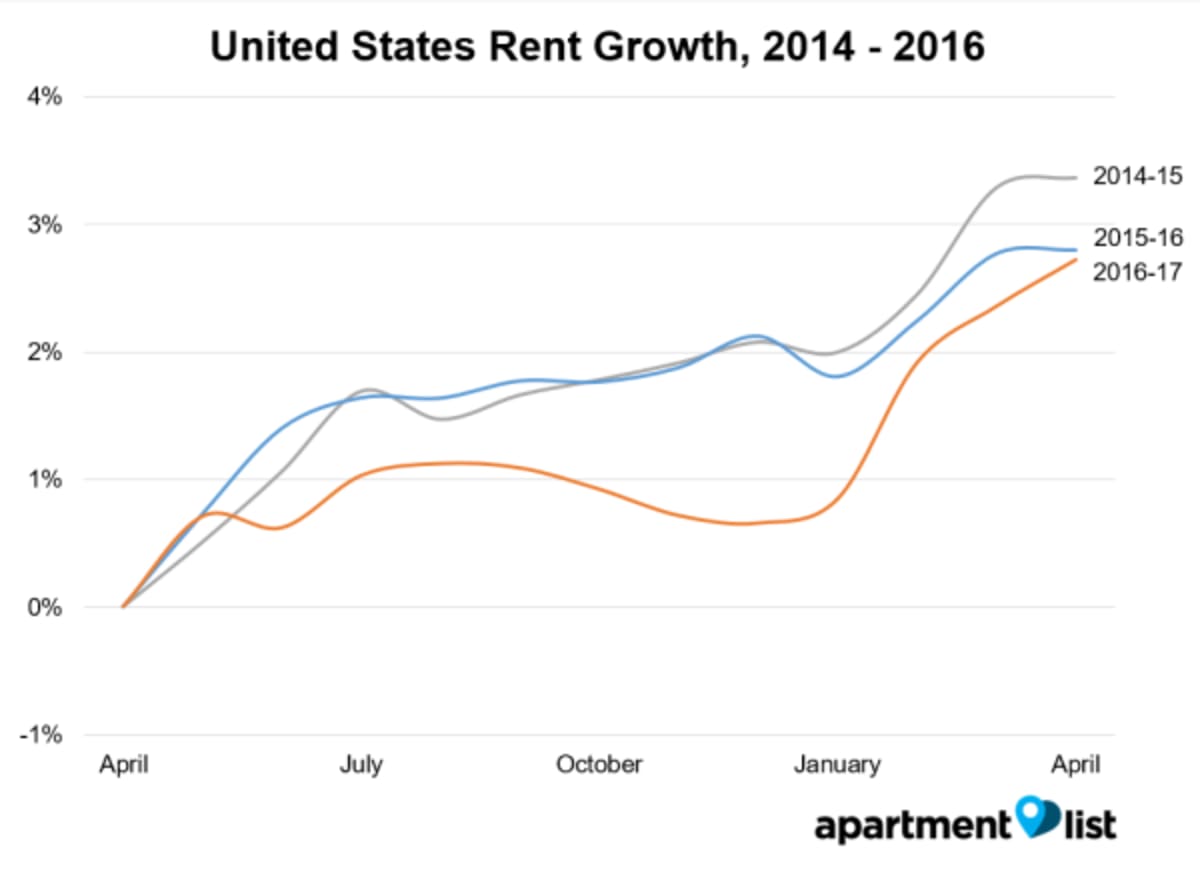
Following a sustained stretch of flat to declining rent growth for much of 2016, our national rent index has now increased in each of the past four months. Rents grew at a rate of 0.4% between March and April, which is the same rate of growth we saw between February and March. For comparison, rents were essentially flat at this time in each of the two prior years.
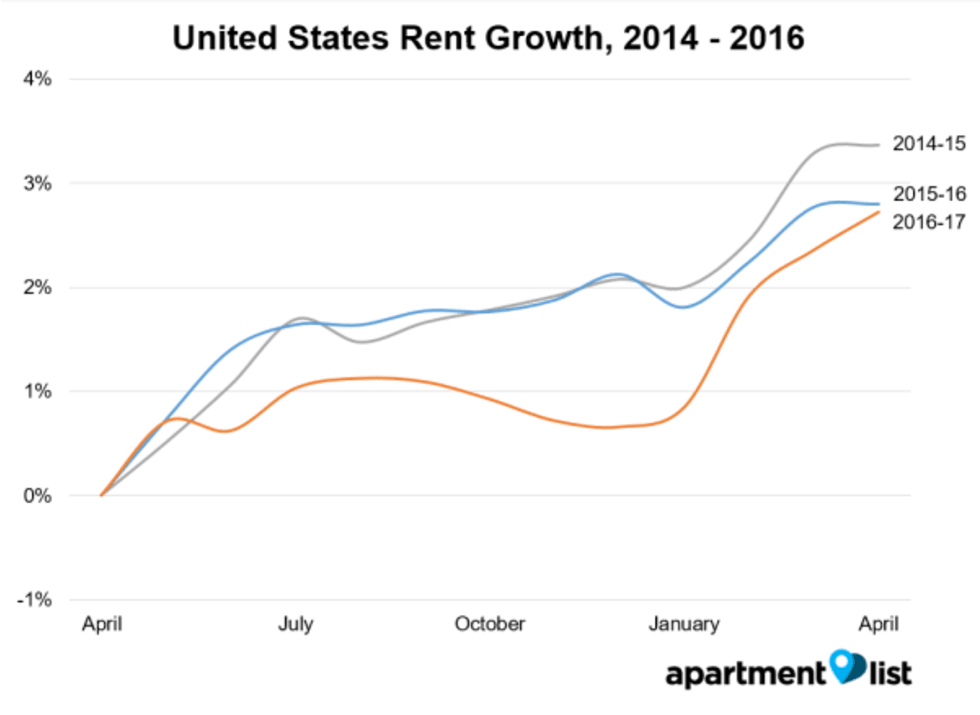
Year-over-year growth at the national level currently stands at 2.7%; note that this rate has more than doubled since last December, when it came in at 1.3%. Growth is now nearly matching the 2.8% rate from this time last year, but still lags behind the 3.4% pace from April 2015.
Given the flat rent growth over most of 2016 and steady construction of new units in many areas, we had expected 2017 to be a good year for renters, but our index is now showing fairly strong rent increases at the national level. This could be related to the fact that there is currently a severe lack of homes for sale, particularly in the more affordable price tiers. This shortage may be causing many potential first-time homebuyers to continue renting, leading to increased demand and rising prices in the rental market.
Rents up year-over-year in 91 of 100 largest cities
In addition to the growth the national level, rents are increasing in most of the nations biggest markets - the map below show's year-over-year rent growth for the nation's 100 largest cities (markers are sized by population):
Note that 91 of the nation's 100 largest cities have experienced positive year-over-year growth, and 74 saw increases over the past month. While, growth at the national level has been picking up, it is only slightly outpacing overall inflation, which is currently estimated at 2.0%. On the other hand, some individual markets are seeing more substantial increases, with 17 of the cities mapped above logging year-over-year growth above 5%. The chart below shows how rents have changed over the past year for the five cities with the largest increases:
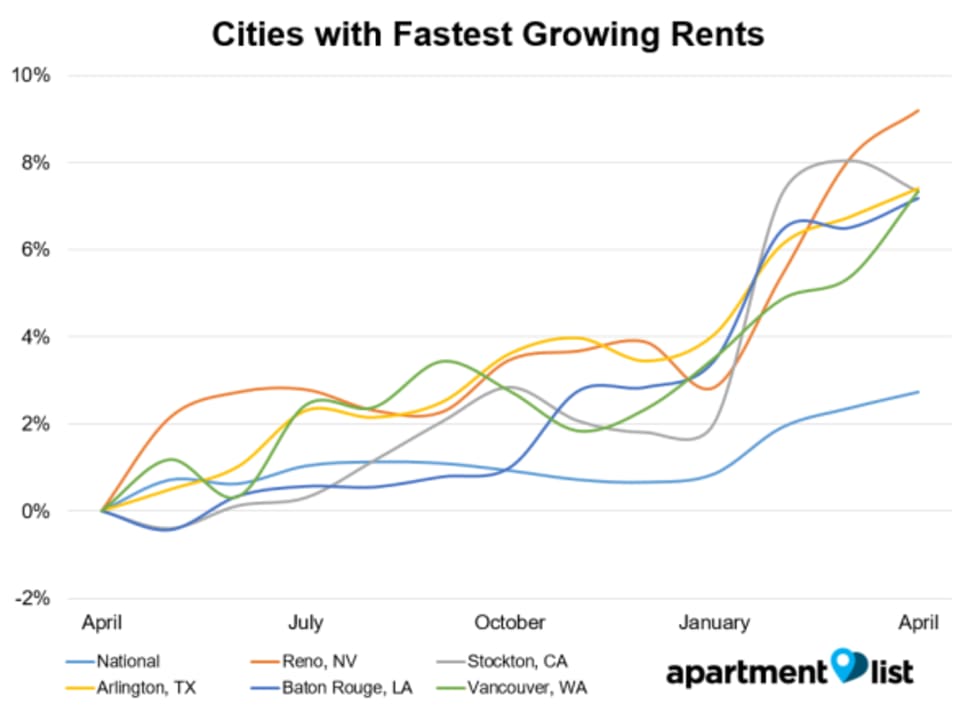
Reno, NV leads the way for rent growth, with increases of 1.1% over the past month and 9.2% over the past year; the median 2-bedroom apartment there costs $930. Arlington TX, comes in 3rd with 7.6% year-over-year growth, while nearby Fort Worth also experienced a steep increase of 4.5%; these cities are both more affordable options outside Dallas, where rents rose 2.9% over the past year to $1,750 for a 2-bedroom. At the state level, Washington saw the fastest year-over-year growth at 5.4%, with rents in each of the state's large cities growing at rates well above the national average (7.3% in Vancouver, 5.4% in Tacoma, 5.4% in Seattle, and 4.7% in Spokane).
Rents still flat or declining in 5 of 10 most expensive cities
Despite the overall trend of price increases, there are still some places where renters are getting some relief. Only 9 of the 100 largest cities have seen rents fall over the past year, but an additional 13 saw only modest growth of less than 1%. The chart below shows trends for the five cities where rents declined most:
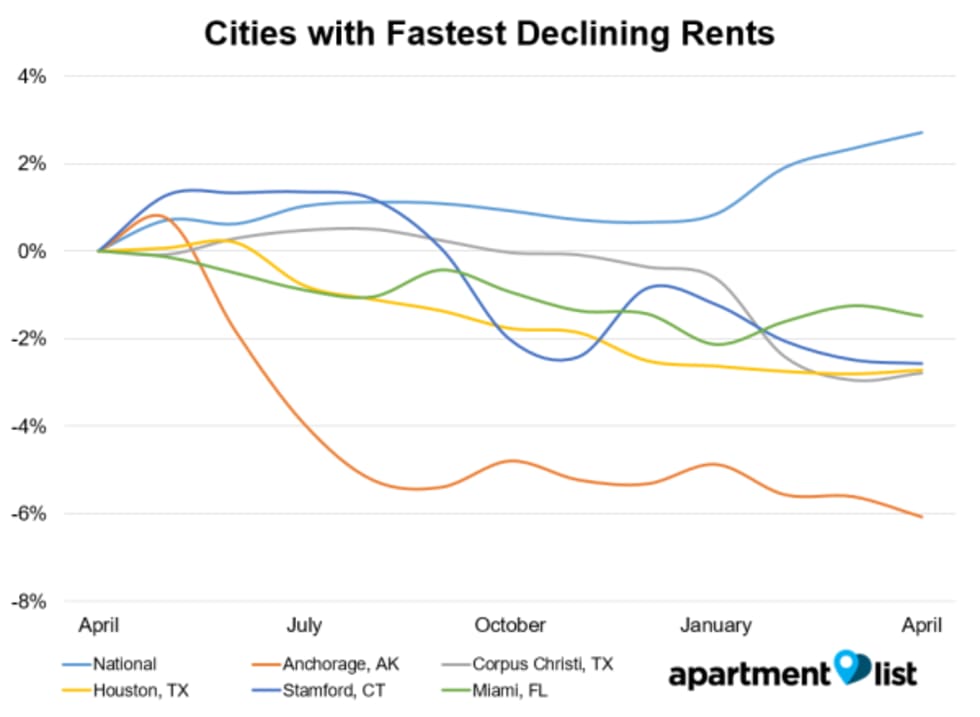
Anchorage, where a 2-bedroom goes for $1,130 saw the largest decrease, with rents falling 6.1% over the past year. In Texas, the gulf coast cities of Houston and Corpus Christi both saw rents fall by close to 3%.
Note that two of the cities in the chart above, Stamford (-2.5%) and Miami (-1.4%), are also among the top 10 most expensive cities in the country. Across the remainder of the most expensive cities, rents are also down year-over-year in San Francisco (-1.1%), while New York City and Washington DC both had growth below 1%. The leveling off of rents in the most expensive parts of the country is a trend we've been witnessing for a while now, but note that it's one that appears to be driven largely by an oversupply of luxury units, while renters searching for more affordable options may still be struggling.
Please see additional data below for the nation's 100 largest cities, or check out the full data for your city or county at our rental data page. And as always, feel free to contact us with any questions!
| City Name | Median 1 BR price | Median 2 BR price | M/M price change | Y/Y price change |
|---|---|---|---|---|
| San Francisco, CA | $3,400 | $4,600 | 0.1% | -1.1% |
| New York, NY | $3,200 | $4,260 | 0.3% | 0.9% |
| Boston, MA | $2,850 | $3,400 | 0.9% | 2.9% |
| Washington, DC | $2,200 | $3,050 | 0.3% | 0.1% |
| Jersey City, NJ | $2,610 | $3,180 | 0.1% | 2.3% |
| Los Angeles, CA | $1,930 | $2,750 | 0.2% | 4.9% |
| San Jose, CA | $2,340 | $2,750 | 1.1% | 2.2% |
| Stamford, CT | $1,960 | $2,330 | 0.0% | -2.5% |
| Miami, FL | $1,950 | $2,500 | -0.2% | -1.4% |
| Seattle, WA | $1,690 | $2,290 | 0.3% | 5.4% |
Check out our rent reports for the following cities:
- Atlanta, GA
- Austin, TX
- Baltimore, MD
- Boston, MA
- Boulder, CO
- Charlotte, NC
- Chicago, IL
- Cleveland, OH
- Colorado Springs, CO
- Dallas, TX
- Denver, CO
- Detroit, MI
- Fort Collins, CO
- Fort Lauderdale, FL
- Houston, TX
- Indianapolis, IN
- Jacksonville, FL
- Los Angeles, CA
- Miami, FL
- Minneapolis, MN
- New York, NY
- Orlando, FL
- Phoenix, AZ
- Raleigh, NC
- San Antonio, TX
- San Diego, CA
- San Francisco, CA
- San Jose, CA
- Seattle, WA
- Tallahassee, FL
- Tampa, FL
- Tucson, AZ
- Washington, DC
If you would like to get future updates from Apartment List Rentonomics, please subscribe to our email list.
Methodology:
Apartment List Rent Report data is drawn monthly from the millions of listings on our site. 1-bedroom and 2-bedroom rents are calculated as the median for units available in the specified size and time period. Price changes are calculated using a “same unit” methodology similar to the Case-Shiller “repeat sales” home prices methodology, taking the average price change for units available across both time periods. For top city rankings, we calculated median 1-bedroom and 2-bedroom rents in 100 top cities and then ranked them by 2-bedroom rents.
About Apartment List Rent Reports:
Apartment List’s Rent Reports cover rental pricing data in major cities, their suburbs, and their neighborhoods. We provide valuable leading indicators of rental price trends, highlight data on top cities, and identify the key facts renters should know. As always, our goal is to provide price transparency to America’s 105 million renters to help them make the best possible decisions in choosing a place to call home. Apartment List publishes Rent Reports during the first calendar week of each month.
Share this Article
