April 2020 Rent Report
Methodology Note:
Apartment List is committed to making our rent estimates the best and most accurate available. To do this, we start with fully representative median rent statistics for recent movers taken from the Census Bureau American Community Survey. We then extrapolate this data forward to the current month using a growth rate calculated from our listing data. Growth rates are calculated using a same-unit analysis similar to Case-Shiller’s approach, comparing only units that are available across both time periods in order to provide an accurate picture of rent growth in cities across the country.
Our approach corrects for the sample bias inherent in private sources, producing results that are representative of the entire market. Our methodology also allows us to construct a picture of rent growth over an extended period of time, with estimates that are updated each month.
Read more about our methodology here. For further methodology questions or custom data requests, contact us at rentonomics@apartmentlist.com.
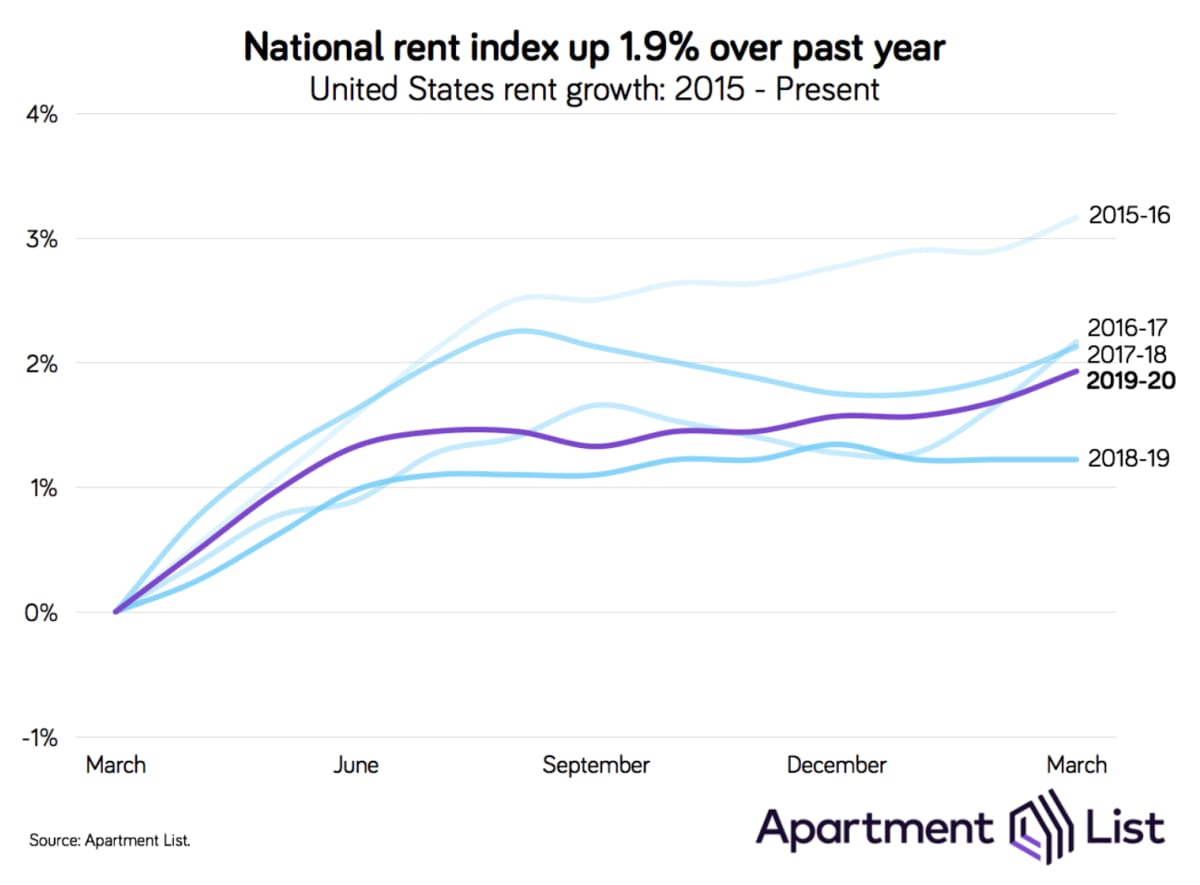
Welcome to the April 2020 National Apartment List Rent Report. As the COVID-19 pandemic grips the nation, shelter-in-place orders have ground large segments of the economy to an abrupt halt. We expect that the pandemic could have significant impacts to the housing market, with a sharp decline in mobility expected to be the most immediate near-term change. That said, the degree to which rent growth may be impacted is still unclear, and it appears to be too soon to discern any COVID-19 effects in our monthly rent estimates. Instead, our most recent estimates are consistent with what we were seeing prior to the current crisis, even in the most highly impacted markets. Our national rent index continued a gradual upward trend, increasing by 0.2 percent over the past month, while year-over-year growth currently stands at 1.9 percent.
COVID-19 has not yet impacted rent growth
Our national rent index grew by 0.2 percent from February to March. After remaining largely flat through the second half of 2019, the national index has now increased by 0.4 percent since December. This is generally consistent with seasonality in the market -- rent growth tends to slow in the fall and winter as demand cools, but then picks back up as we enter spring.
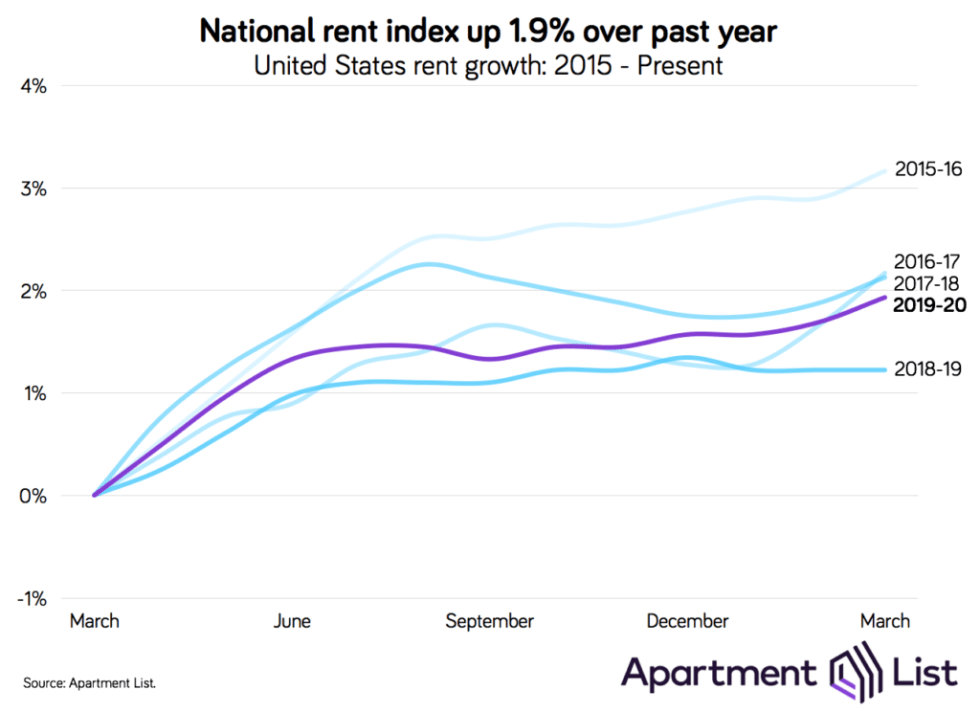
Our index's year-over-year growth rate of 1.9 percent is now pacing solidly ahead of the 1.2 percent rate we saw at this time last year. The current rate is closely in line with rates we observed in March 2017 and 2018, though still trailing well behind the elevated 2016 growth rate of 3.2 percent. Currently, rent growth is trailing just slightly behind the overall rate of inflation, which stands at 2.3 percent as of the latest data release. Rent growth lags even further behind the growth in average hourly earnings, which have increased by 3.0 percent over the past twelve months. The fact that rent growth has been consistently trailing income growth has been a bright spot of our recent rent reports, but this outlook has shifted rapidly as millions of Americans now face immediate employment uncertainty.
While the impact of COVID-19 is certain to be significant and long-lasting, these effects have yet to appear in many key economic indicators, including our rent index. In the near-term, it’s likely that the volume of moves will likely drop off significantly, due to a combination of shelter-in-place orders, eviction moratoriums, and general uncertainty surrounding the virus and the economy. While this decline in mobility has probably already begun in recent weeks, we have not yet seen properties adjust their rents in response. A dip in demand would normally cause property owners to start setting lower prices, but given the temporary and uncertain nature of the present situation, properties could be holding out on changing rents until things have settled down. It’s also possible that a greater than normal share of renters are renewing their leases, such that the lack of moving activity is not actually translating to an increased vacancy risk for landlords.
As far as longer-term impacts, the pandemic’s effect on rent prices will depend heavily on the broader macroeconomic landscape. While a recession of some magnitude seems largely inevitable at this point, it’s exact magnitude and duration are far from certain. What does seem clear is that the tourism and service sectors of the economy are currently bearing the brunt of the economic impact, and regions that lean heavily on these industries -- such as Las Vegas, Orlando, and Miami, are poised to be hit particularly hard. When shelter-in-place restrictions are lifted and normal levels of moving resume, it’s highly possible that an uptick in downgrade moves could result in tighter competition for rental units at the middle and lower ends of the market, while luxury vacancies get harder to fill. Under these conditions, we may see a bifurcation of the market in which rents fall for Class A properties, while Class B and C properties actually see accelerated rent growth.
Rents increase month-over-month even in the cities hit hardest by the pandemic
The national trend of rents ticking up over the past month was mirrored in nearly all of the nation’s large cities. Of the 70 cities with populations over 250,000 for which we have data, 58 saw rents increase over the past month; an additional nine experienced flat rent growth and rents dipped in just three cities.
Even among the cities that have been hardest hit by COVID-19, we have not yet seen meaningful changes in rental trends. In Seattle, which was the first American city to experience a major COVID-19 outbreak, rents were up 0.5 percent month-over-month. That is the third highest month-over-month growth rate among large cities, and marks the second straight month of accelerated rent growth in Seattle. Despite the softening demand due to the pandemic having more time to appear in the data, we have not yet seen a corresponding slowdown in rent growth in Seattle. In New York City, rents grew by 0.1 percent month-over-month, which similarly indicates a lack of disruption in the city’s rent prices.
Phoenix area experiencing fastest growth over the past year
Looking beyond the most recent month of data, Mesa, AZ tops our list for the nation's fastest rent growth over the past year. Rents in Mesa have grown by 4.8 percent over the last year, well over double the national rate. Mesa is located just outside of Phoenix, which ranks sixth on the list at 3.4 percent. Mesa is followed in the rent growth rankings by Nashville (4.2 percent) and Austin (3.5 percent), two fast-growing mid-sized cities that continue to attract renters from around the country.
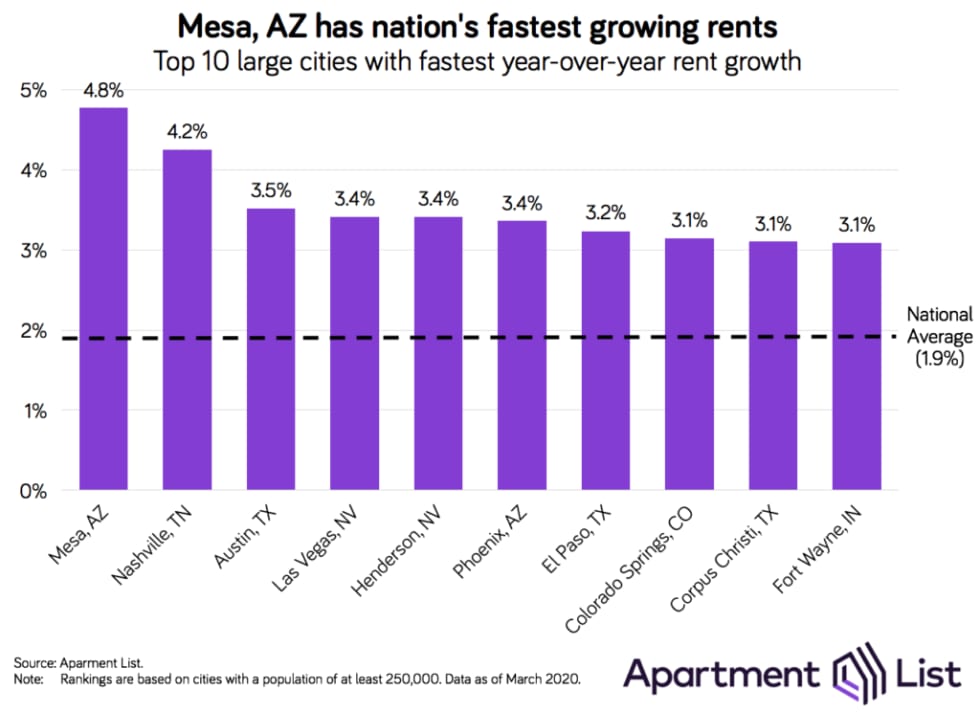
The Las Vegas area is also experiencing rent growth well above the national average. Las Vegas ranks fourth on the list with annual rent growth of 3.4 percent, followed by neighboring Henderson, NV. The Las Vegas metro has seen rapid job growth in recent years, but many of those jobs are in low-paying service and tourism industries, which are already experiencing broad layoffs as travel and recreation come to a near halt, at least temporarily. Due to its extreme dependence on the tourism and service sectors, the Las Vegas economy is highly cyclical, and the region will likely be dealing with the economic ramifications of COVID-19 for some time to come.
Persistent rent hikes in CO and CA cities since 2014
For many of the cities mentioned above, rapid rent growth is not a new phenomenon. Five of the cities in the top 10 for fastest year-over-year growth -- Mesa, AZ; Las Vegas, NV; Henderson, NV; Phoenix, AZ; and Colorado Springs, CO -- also make the list for fastest rent growth over the past five years.
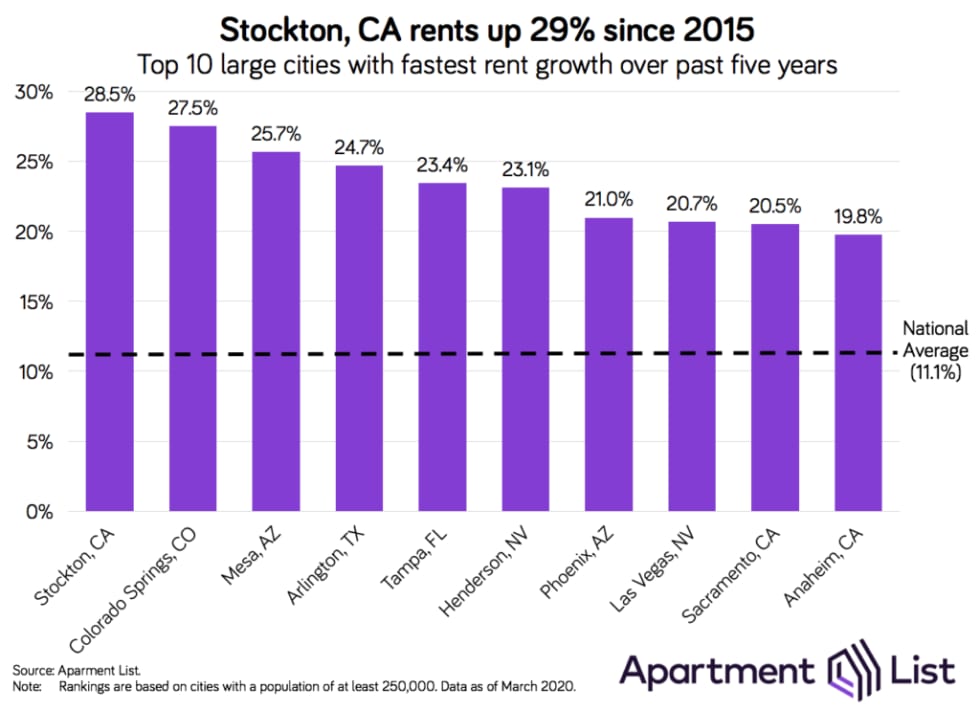
Stockton, CA, tops this list, with rent growth of 28.5 percent since March 2015. For comparison, our national rent index grew by just 11.1 percent over this period. Stockton sits on the outskirts of the San Francisco Bay area, and also ranked number one in our report on the metros with the highest shares of "super commuters" who travel more than 90 minutes each way to work. Sacramento also makes this top 10, as the Bay Area's affordability crisis spreads to the farther reaches of the region.
Colorado Springs comes in second, with rent growth of 27.3 percent over the past five years, while nearby Aurora, CO ranks tenth at 20.1 percent. Interestingly, Denver itself is absent from this list and the one above -- it seems that while the metro's core city is driving job growth in the region, the surrounding suburbs are seeing the biggest impacts to their rental markets. A similar trend can be seen in other booming metro areas represented in these lists, such as Dallas and San Francisco.
Please see the table below for the most recent rent estimates for your city, or head over to our rental data page to download complete data going back to 2014. And as always, feel free to contact us with any questions!
Check out our rent reports for the following cities:
- Atlanta, GA
- Austin, TX
- Baltimore, MD
- Boston, MA
- Boulder, CO
- Charlotte, NC
- Chicago, IL
- Cleveland, OH
- Colorado Springs, CO
- Dallas, TX
- Denver, CO
- Detroit, MI
- Fort Collins, CO
- Fort Lauderdale, FL
- Houston, TX
- Indianapolis, IN
- Jacksonville, FL
- Los Angeles, CA
- Miami, FL
- Minneapolis, MN
- New York, NY
- Orlando, FL
- Phoenix, AZ
- Raleigh, NC
- San Antonio, TX
- San Diego, CA
- San Francisco, CA
- San Jose, CA
- Seattle, WA
- Tallahassee, FL
- Tampa, FL
- Tucson, AZ
- Washington, DC
If you would like to get future updates from Apartment List Rentonomics, please subscribe to our email list.
Methodology:
Apartment List Rent Report data is drawn monthly from the millions of listings on our site. 1-bedroom and 2-bedroom rents are calculated as the median for units available in the specified size and time period. Price changes are calculated using a “same unit” methodology similar to the Case-Shiller “repeat sales” home prices methodology, taking the average price change for units available across both time periods. For top city rankings, we calculated median 1-bedroom and 2-bedroom rents in 100 top cities and then ranked them by 2-bedroom rents.
About Apartment List Rent Reports:
Apartment List’s Rent Reports cover rental pricing data in major cities, their suburbs, and their neighborhoods. We provide valuable leading indicators of rental price trends, highlight data on top cities, and identify the key facts renters should know. As always, our goal is to provide price transparency to America’s 105 million renters to help them make the best possible decisions in choosing a place to call home. Apartment List publishes Rent Reports during the first calendar week of each month.
Share this Article
