Luxury Bias in Private Listing Data
Apartment List is committed to making our rent estimates the best and most accurate available, and, as part of our efforts toward that goal, we’ve recently made some changes to our methodology. An overview of our new methodology can be found here, but today, we want to dig a bit deeper into one of the primary issues that we're aiming to correct: sample bias.
What’s the problem?
Sample bias is a statistical concept that refers to a situation in which some segments of the population are less likely to be included in sample data collection. In the case of rent estimates, the underrepresented segments typically consist of less expensive units and neighborhoods.
When calculating rent estimates, researchers draw a sample from the complete set of rental units in a given area. For private listing sites, such as Apartment List and our competitors, this sample consists of listings that appear on our platforms. As a result of our business models, private listing data tend to include a greater share of high-end luxury units, and therefore, overrepresents the upscale neighborhoods in a city.
When researchers base statistical estimates on a biased sample, those estimates are also biased. For example, if researchers calculate median rents based on a sample that includes too large a share of expensive units, the resulting estimates will overstate the true median rent, resulting in a phenomenon we call “luxury bias.”
Sample bias in action
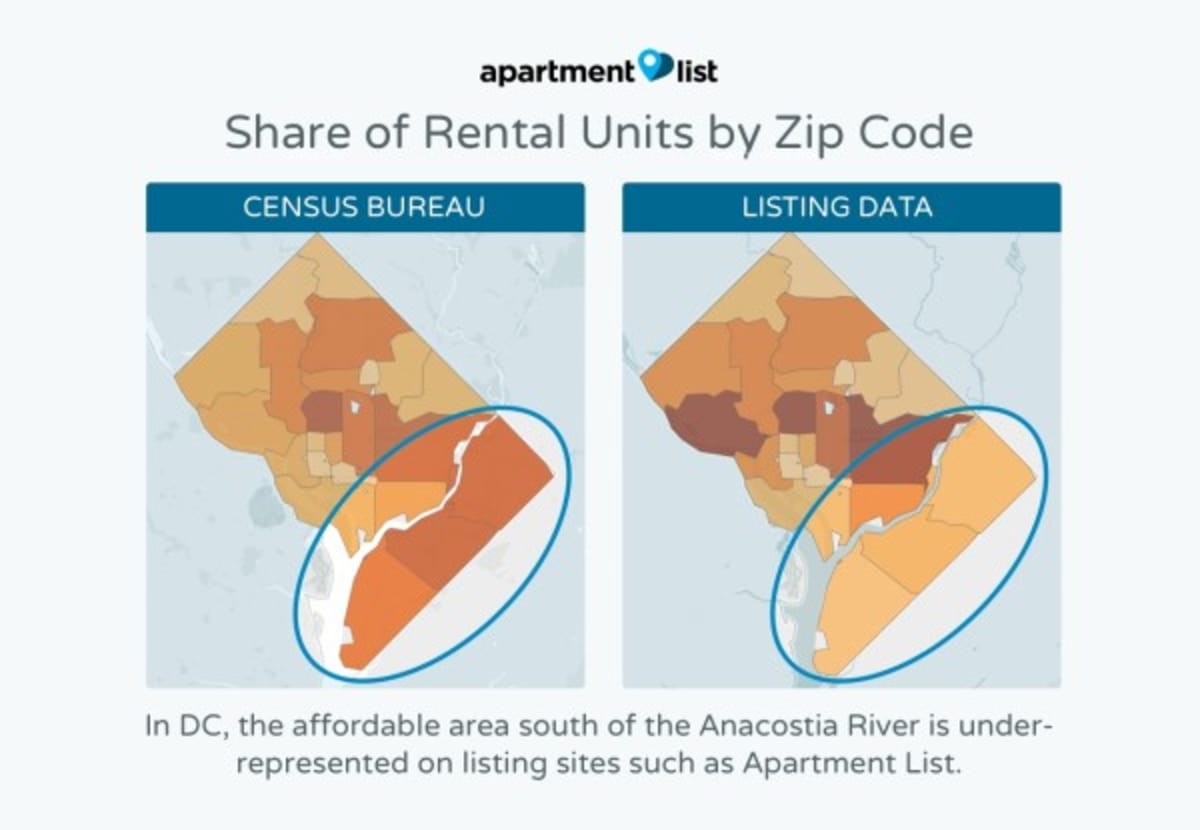
In order to demonstrate the phenomenon of luxury bias in private listing data, we looked at data for a number of example cities and put together a series of maps that show the true distribution of rental units in each city, compared to the distribution of units available on private listing sites. As an estimate of the true distribution, we use Census American Community Survey (ACS) estimates for total renter-occupied units in each city. For private listing sites, we look at our own internal data on units available on Apartment List and combine this with data scraped from the websites of two other listing sites, Zillow and Zumper. The maps below show the percentage of the city’s total units that are located in each zip code within the city.
Washington, DC - Affordable area south of Anacostia River underrepresented by listing sites
In Washington, DC, it is clear that the lower-income area south of the Anacostia river is underrepresented by private listing data. The three zip codes that comprise this area (20019, 20020 and 20032) contain 25.7 percent of all rental units in the city, but only 7.4 percent of listings on Apartment List and our competitors are located in these zip codes. Importantly, the median rent in these three zip codes is $940, well below the citywide median of $1,380. Meanwhile, the 20007 zip code, which contains the upscale Georgetown neighborhood, contains just 3.5 percent of the city’s rental units, but makes up 12.6 percent of units available on private listing sites. The median rent in that zip code is $1,800. Overall, the median rent for DC zip codes that are overrepresented by private listing data is $1,648, which is 40 percent above the $1,180 median for the underrepresented zip codes.
New York City - Harlem is underrepresented on listing sites, while gentrified lower Manhattan is overrepresented
In New York City, we see that upper Manhattan, and specifically Harlem, is underrepresented by private listing data, while more gentrified areas in lower Manhattan, including Midtown and Greenwich Village, make up a greater share of listings on private sites. Across all zip codes that are overrepresented by private listing data, the median rent is $2,120, compared to $1,310 for the underrepresented zip codes. The 62 percent gap between these two numbers is the largest of the cities we examined.
Chicago - Listing site units clustered in North Side zip codes
As seen in the left side map above, rental units in Chicago are fairly evenly distributed among the city’s zip codes, where there are more upscale apartments. However, the map on the right shows that private listing data in Chicago is clustered in a handful of zip codes on the North Side of the city. Specifically, the zip codes 60613, 60617, 60640 and 60657 contain 14.4 percent of Chicago’s rental units, but they make up more than double that share of private listings, or 31.3 percent. The median rent in those four zip codes is $1,180, or 15 more than the citywide median of $1,030.
San Francisco - Zip codes that are overrepresented on listing sites are 19 percent more expensive than underrepresented areas
The private listing data in San Francisco is not as obviously skewed as some of the other cities we analyzed, but the maps above still show a bias toward zip codes in and around the more costly downtown area of the city. Overrepresented zip codes in San Francisco have a median rent that is 19 percent above the underrepresented zip codes.
Los Angeles - West Hollywood is the most popular zip code on listing sites
In Los Angeles, the expensive West Hollywood zip code of 90046 is the most popular for private listing sites. An estimated 9.0 percent of listings on these sites are located in that part of the city, compared to just 3.8 percent of all rental units. The median rent in 90046 is $1,420, compared to $1,180 for the city overall.
Dallas - Units on listing sites grouped in expensive downtown zip codes
Private listings data in Dallas are closely clustered around the pricier downtown part of the city. Zip codes that are overrepresented by private listing sites have a median rent of $1,120, while the median in zip codes that are underrepresented by these sites is just $800.
Denver - Zip codes overrepresented on listing sites are 2 percent less expensive than underrepresented areas
Denver is the one city we looked at that doesn’t follow the same trend we see elsewhere. While private listing data for Denver favor certain zip codes, these are not necessarily the priciest parts of the city. In this example, the zip codes that are overrepresented in private listing actually have a median that is 2 percent below that of the underrepresented areas.
Detroit - Rents in the three most overrepresented zip codes are $100 above the citywide median
In Detroit, the zip codes that are overrepresented on private listing sites are actually outside the downtown area, but, in this case, these are still the more expensive parts of the city. The three most overrepresented zip codes in Detroit (48228, 48224 and 48221) have a median rent $850, compared to $750 for the city as a whole.
How is our approach different?
In order to correct for sample bias in our listing data, we revamped the methodology we use to calculate our estimates. Instead of calculating median rents directly from our own listings, our estimates now start with Census data collected through the ACS. The survey methodology used by Census is broadly considered to be the gold standard - the ACS surveys a broad representative sample of the population and is free of bias. Census ACS data, however, is released with a significant lag, for example, the most recent year currently available is 2015. To calculate up-to-date estimates, we analyze data from our own listings to calculate a price change factor which we then use to extrapolate the Census estimates forward to the current month.
Read more about our new methodology here.
Conclusion
As our research shows, the rental units available on private listing sites do not paint an accurate picture of a city’s rental inventory. When median rents are calculated from these biased samples, the resulting estimates will tend to overstate the true price of apartments in a city - across the eight cities that we analyzed, the median rent in zip codes that are overrepresented by listing sites is 40 percent higher than the median in underrepresented zip codes. At Apartment List, we want to provide renters with accurate data, and we have made significant changes to our methodology to correct for luxury bias. We believe that our new rent estimates accurately reflect all segments of the rental market, and we’re confident that our rent data is the best available.
Share this Article
