July 2017 Rent Report
Methodology Updates
Apartment List is committed to making our rent estimates the best and most accurate available, and as part of our efforts toward that goal, we've recently made some changes to our methodology. Data from private listing sites, including our own, tends to skew towards luxury apartments, introducing sample bias. In order to address these limitations, our estimates now start with reliable median rent statistics from the Census Bureau, which we then extrapolate forward to the current month using a growth rate calculated from our listing data. In calculating that growth rate, we use a same-unit analysis similar to Case-Shiller’s approach, comparing only units that are available across both time periods to provide an accurate picture of rent growth in cities across the country.
We are continuously working to improve our methodology and data, with the goal of providing renters with the information that they need to make the best decisions. You can read more about our new methodology here.
Welcome to the July 2017 National Apartment List Rent Report! Our national rent index is continuing to climb, with month-over-month growth of 0.5% for June.
Read on for an analysis of the trends we're seeing this month:
National index up 0.5% month-over-month
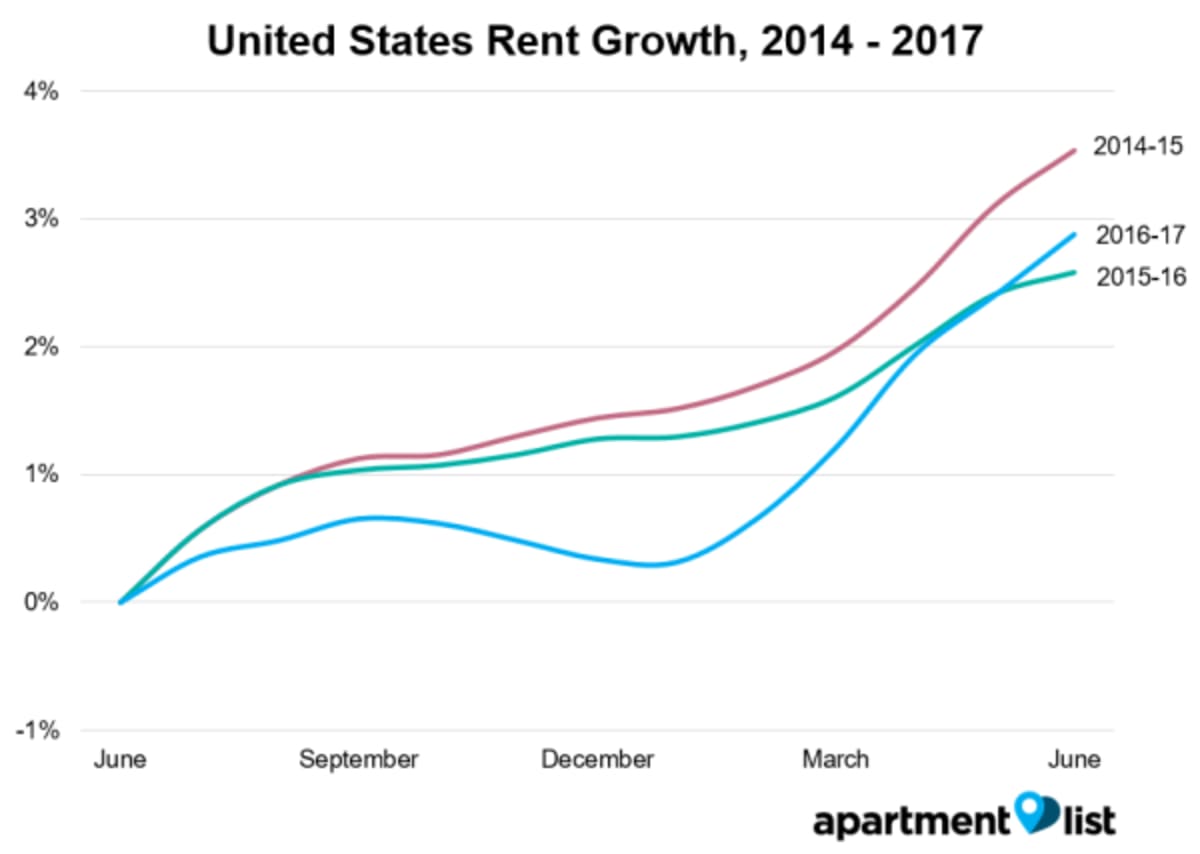
Our national rent index was essentially flat from June to December of last year, but have been steadily climbing since then. Rents grew at a rate of 0.5% between May and June, which is generally in line with the monthly growth that we've seen over the course of this year thus far.
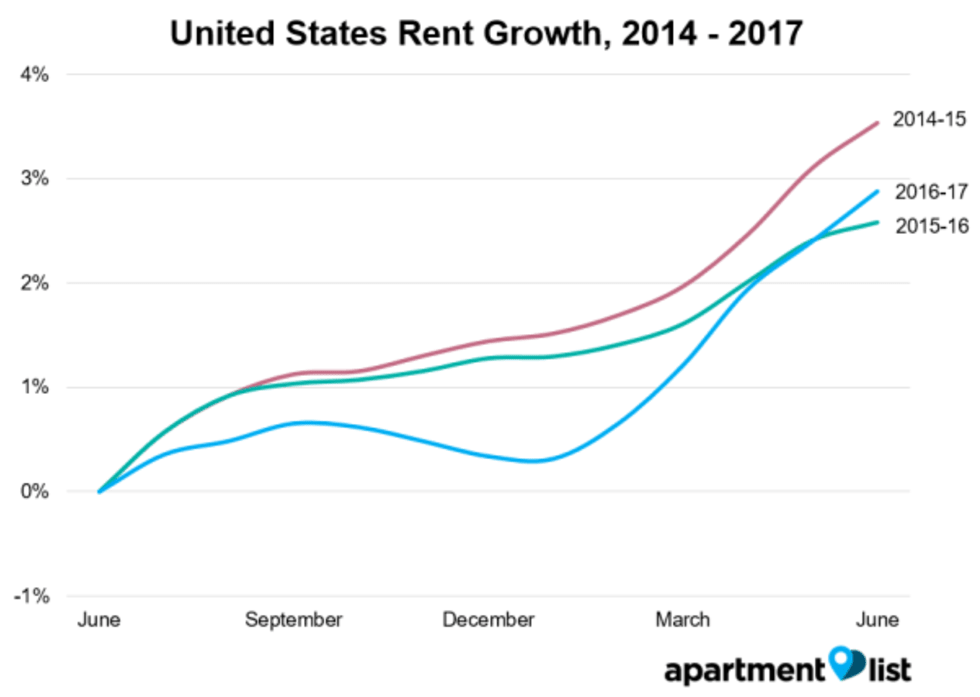
Year-over-year growth at the national level currently stands at 2.9%, surpassing the 2.6% rate from this time last year. The last month in which year-over-year growth outpaced the level from the year prior was December 2015. Despite the uptick, year-over-year growth is still lagging a bit behind the 3.5% pace from June 2015.
Given the stagnant rents growth that we saw last year, we weren't sure if the rent increases we saw early in the year would persist, but over the past six months, our national index has experienced an average monthly increase of 0.4%. We haven't seen sustained rent growth at that level since September 2015. We've also now entered the busy summer renting season, which means that rents will likely continue their upward trajectory for at least the next few months.
Rents up year-over-year in 92 of 100 largest cities
In addition to the growth the national level, rents are now increasing in nearly all of the nations biggest markets - the map below show's year-over-year rent growth for the nation's 100 largest cities (markers are sized by population):
Note that 92 of the nation's 100 largest cities have experienced positive year-over-year growth, and 89 saw increases over the past month. Some individual markets are seeing substantial increases, with 44 of the cities mapped above logging year-over-year growth above 3%, and 14 experiencing sharp increases of 5% or more. The chart below shows how rents have changed over the past year for the five cities with the largest increases:
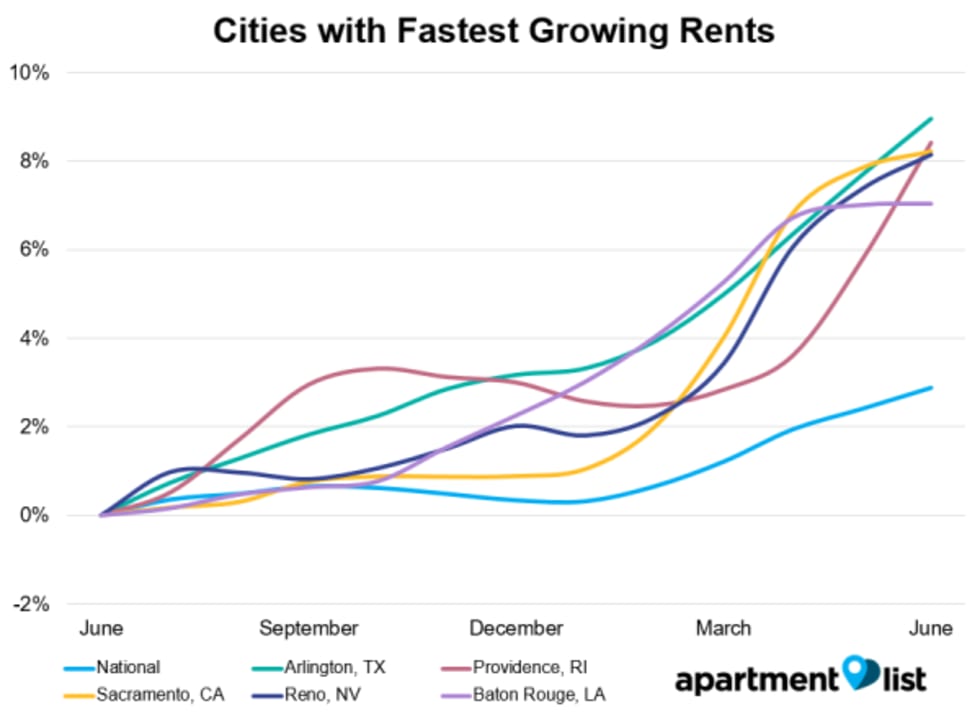
Arlington, TX continues to experience the fastest growth in the nation, with rents increasing 9.0% over the past year and 1.2% over just the past month. Arlington is roughly a 30 minute drive from Dallas, and that entire metro area has been experiencing rapid growth. Most of the Dallas area cities that we have data for experienced rent growth above the national average, for example, rents are up 5.1% year-over-year in Irving, 4.8% in Fort Worth and 3.0% in Dallas proper. Other cities on our list of fastest growing rents include Sacramento, CA and Reno, NV, both of which have seen growth in their respective tech sectors in recent years.
Rents falling on the Gulf Coast of Texas
Despite the overwhelming trend of increasing prices, there are still a few places where rents are falling. Only 8 of the 100 largest cities have seen rents fall over the past year, but an additional 24 saw modest growth of less than 1.5%. The chart below shows trends for the five cities where rents declined most:
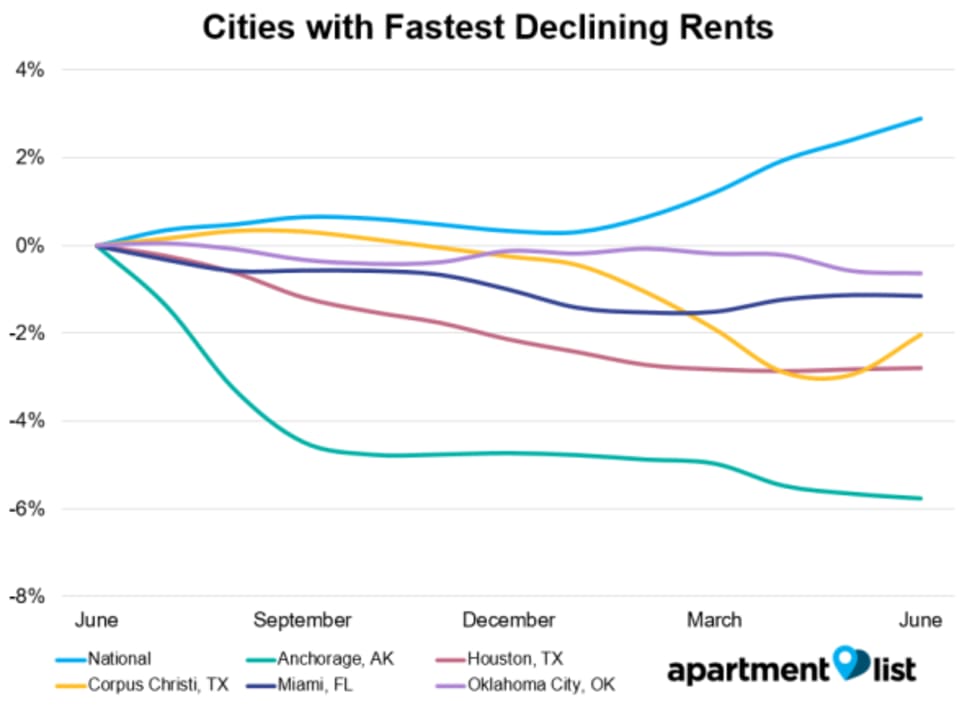
Anchorage continues to top this list, with rents declining by 5.8% over the past year; the median 2-bedroom there now goes for $1,090. We're also continuing to see rent declines in the Texas gulf coast cities of Houston and Corpus Christi, both of which have experienced declines of more than 2% over the past year. This trend extends into the suburbs surrounding these cities. In Houston, for example, rents have dropped year-over-year in 7 of the 10 largest cities that we have data for in the metro.
Please see additional data below for the nation's 100 largest cities, or check out the full data for your city or county at our rental data page. And as always, feel free to contact us with any questions!
| City Name | Median 1 BR price | Median 2 BR price | M/M price change | Y/Y price change |
|---|---|---|---|---|
| San Francisco, CA | $2,418 | $3,037 | 0.5% | -0.6% |
| San Jose, CA | $2,048 | $2,567 | 1.0% | 2.2% |
| New York, NY | $2,079 | $2,477 | 0.4% | 1.2% |
| Oakland, CA | $1,714 | $2,154 | 1.2% | 2.8% |
| Boston, MA | $1,685 | $2,089 | 0.6% | 3.3% |
| Anaheim, CA | $1,596 | $2,050 | 0.3% | 5.0% |
| San Diego, CA | $1,539 | $1,996 | 0.9% | 3.8% |
| Jersey City, NJ | $1,601 | $1,907 | -0.5% | 2.0% |
| Santa Ana, CA | $1,426 | $1,833 | 0.1% | 6.4% |
| Long Beach, CA | $1,338 | $1,720 | 0.0% | 3.8% |
Check out our rent reports for the following cities:
- Atlanta, GA
- Austin, TX
- Baltimore, MD
- Boston, MA
- Boulder, CO
- Charlotte, NC
- Chicago, IL
- Cleveland, OH
- Colorado Springs, CO
- Dallas, TX
- Denver, CO
- Detroit, MI
- Fort Collins, CO
- Fort Lauderdale, FL
- Houston, TX
- Indianapolis, IN
- Jacksonville, FL
- Los Angeles, CA
- Miami, FL
- Minneapolis, MN
- New York, NY
- Orlando, FL
- Phoenix, AZ
- Raleigh, NC
- San Antonio, TX
- San Diego, CA
- San Francisco, CA
- San Jose, CA
- Seattle, WA
- Tallahassee, FL
- Tampa, FL
- Tucson, AZ
- Washington, DC
If you would like to get future updates from Apartment List Rentonomics, please subscribe to our email list.
Methodology:
Apartment List Rent Report data is drawn monthly from the millions of listings on our site. 1-bedroom and 2-bedroom rents are calculated as the median for units available in the specified size and time period. Price changes are calculated using a “same unit” methodology similar to the Case-Shiller “repeat sales” home prices methodology, taking the average price change for units available across both time periods. For top city rankings, we calculated median 1-bedroom and 2-bedroom rents in 100 top cities and then ranked them by 2-bedroom rents.
About Apartment List Rent Reports:
Apartment List’s Rent Reports cover rental pricing data in major cities, their suburbs, and their neighborhoods. We provide valuable leading indicators of rental price trends, highlight data on top cities, and identify the key facts renters should know. As always, our goal is to provide price transparency to America’s 105 million renters to help them make the best possible decisions in choosing a place to call home. Apartment List publishes Rent Reports during the first calendar week of each month.
Share this Article
