January 2020 Rent Report
Methodology Note:
Apartment List is committed to making our rent estimates the best and most accurate available. To do this, we start with fully representative median rent statistics for recent movers taken from the Census Bureau American Community Survey. We then extrapolate this data forward to the current month using a growth rate calculated from our listing data. Growth rates are calculated using a same-unit analysis similar to Case-Shiller’s approach, comparing only units that are available across both time periods in order to provide an accurate picture of rent growth in cities across the country.
Our approach corrects for the sample bias inherent in private sources, producing results that are representative of the entire market. Our methodology also allows us to construct a picture of rent growth over an extended period of time, with estimates that are updated each month.
Read more about our methodology here. For further methodology questions or custom data requests, contact us at rentonomics@apartmentlist.com.
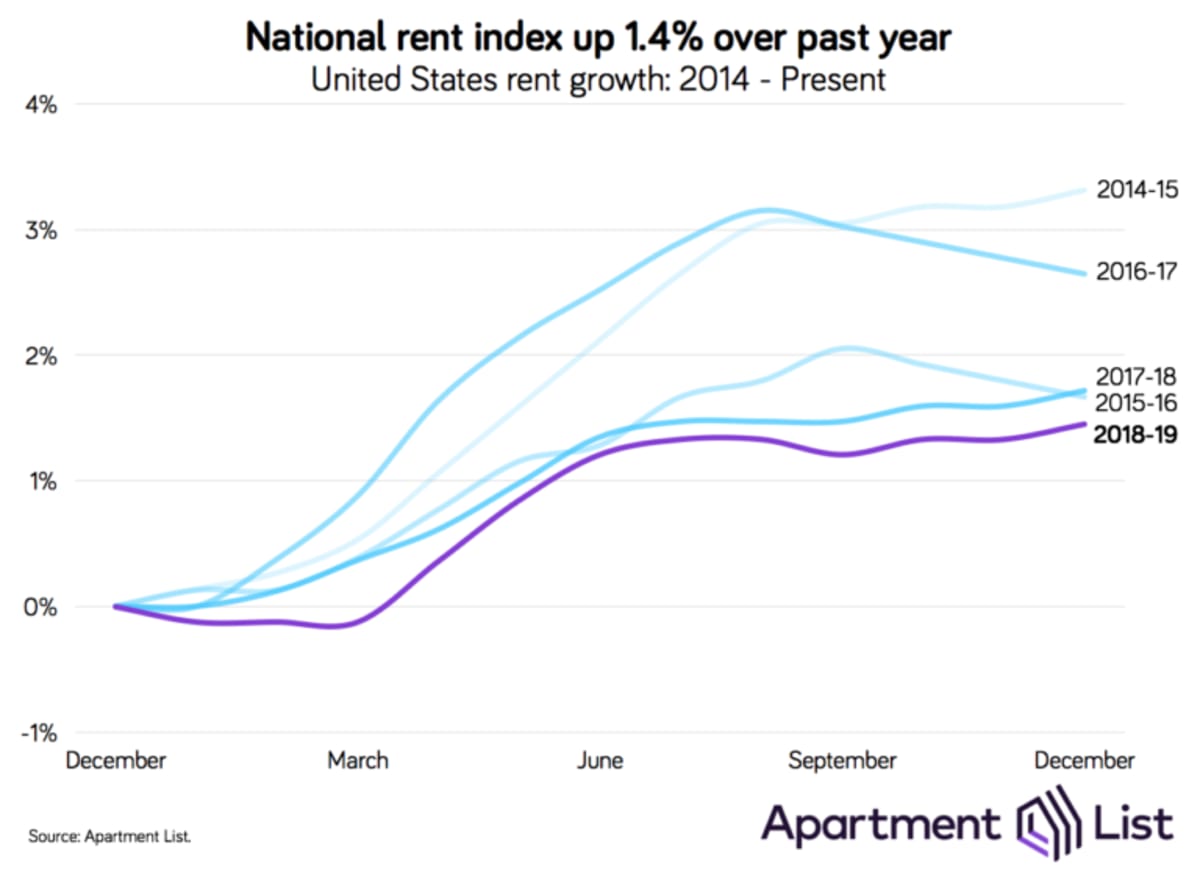
Welcome to the January 2020 National Apartment List Rent Report! Our national rent index ticked up by 0.1 percent over the past month, continuing a period of relative stability in rent growth. Rents have now remained essentially flat since last June. Year-over-year growth currently stands at 1.4 percent, a rate of growth that trails both overall inflation and growth in average wages.
Read on for an analysis of the trends we're seeing this month.
National average Y/Y rent growth is a modest 1.4%
Our national rent index increased by 0.1 percent from November to December, and has now remained essentially flat since last June. In fact, nearly all of the rent growth over the past year occurred during the three month stretch from last March to June, during which rents increased by 1.3 percent. Although this was the fastest growth over any three month period since the summer of 2017, this spike was short-lived, and rents have otherwise remained stable over the past twelve months.
Rent growth tends to be slower in the fall and winter months due to seasonality in the market. This year though, rent growth began to slow before the summer was through. That early end to the summer rent spike marked the beginning of a prolonged period of stagnant rent growth. That said, rents have not fallen in a meaningful way, as they sometimes do during the offseason.
Our index's year-over-year growth rate of 1.4 percent is the lowest that we have seen in any December over the past five years. This time last year, rent growth came in at 1.7 percent, while in December 2015, year-over-year growth stood at 3.3 percent, well over double the current rate.
Currently, rent growth is trailing the overall rate of inflation, which stands at 2.1 percent as of the latest data release. Rent growth lags even further behind the growth in average hourly earnings, which have increased by 3.1 percent over the past twelve months. The fact that rent growth is still trailing income growth is a welcome bit of relief as millions of our nation's renters continue to struggle with housing affordability.
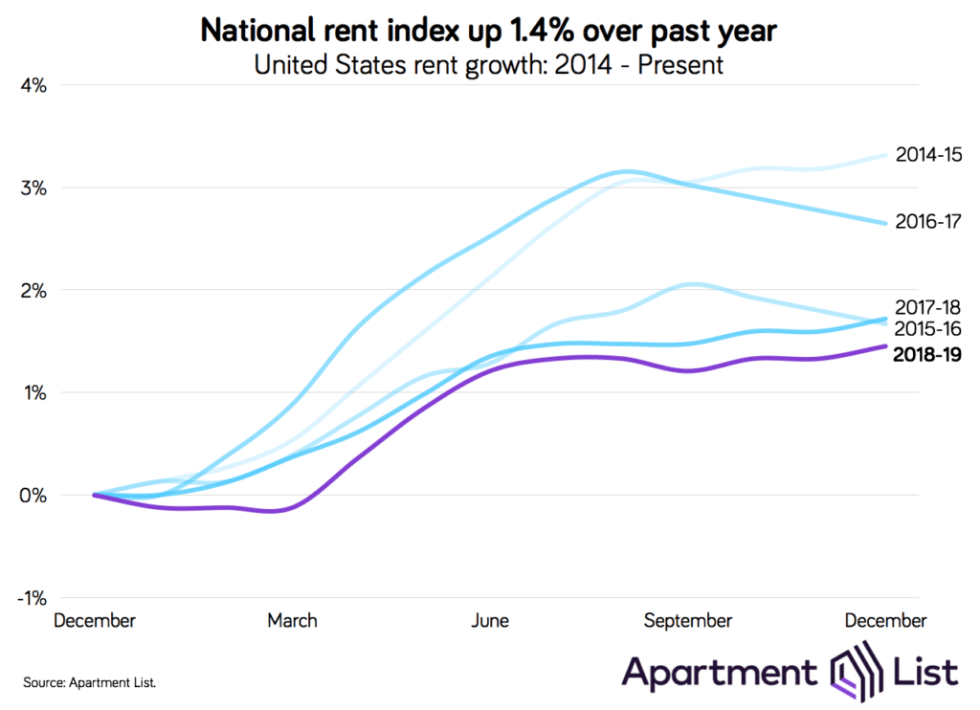
Las Vegas and Phoenix metros experiencing fastest growth over the past year
Tracking rent growth at the national level is informative and provides valuable context, but housing markets are inherently local, and in contrast to the modest growth of our national rent index, some parts of the country are experiencing much more rapid price increases.
Mesa, AZ tops our list for the nation's fastest rent growth, with an increase of 5.1 percent over the last year, more than three times the national rate. Mesa is located just outside of Phoenix, which ranks third on the list at 3.8%.
The Las Vegas area is also experiencing rent growth well above the national average. Henderson, NV has seen the nation's second-fastest rate of rent growth at 4.3 percent, while neighboring Las Vegas ranks fifth at 3.2 percent growth. The Las Vegas metro has seen rapid job growth in recent years, but many of those jobs are in low-paying service and tourism industries, and continued rent hikes could lead to affordability concerns.
Spots six through eight are occupied by three mid-sized Southern cities -- Austin, Nashville, and Charlotte -- which are also among the nation's fastest-growing in terms of jobs and overall population. The top 10 is rounded out by two cities in California, a state where new housing construction has continued to significantly lag demand.
The cities on the list are all located in regions with strong local economies that offer good employment opportunities. Many of these cities also represent more affordable options for those looking beyond the pricey coastal hubs, though continued rent growth at such a heightened pace could erode this affordability advantage.
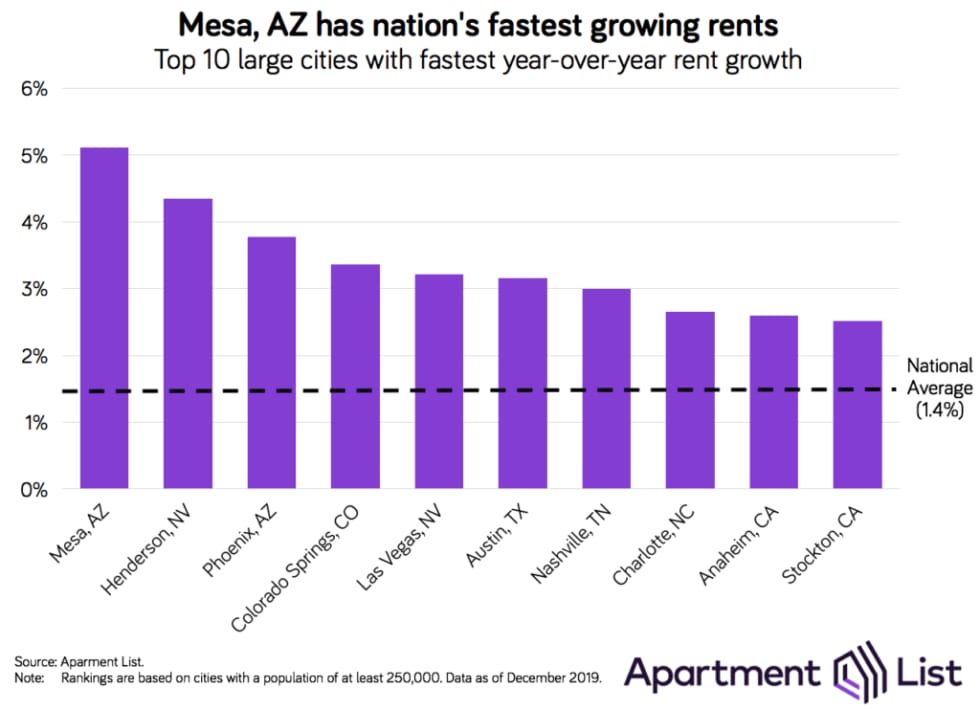
Persistent rent hikes in CO and CA cities since 2014
For many of the cities mentioned above, rapid rent growth is not a new phenomenon. Six of the cities in the top 10 for fastest year-over-year growth -- Mesa, AZ; Henderson, NV; Phoenix, AZ; Colorado Springs, CO; Anaheim, CA; and Stockton, CA -- also make the list for fastest rent growth over the past five years.
Stockton, CA, tops this list, with rent growth of 28.5 percent since December 2014. For comparison, our national rent index grew by just 11.3 percent over this period. Stockton sits on the outskirts of the San Francisco Bay area, and also ranked number one in our report on the metros with the highest shares of "super commuters" who travel more than 90 minutes each way to work. Three California cities made the top 10 for rent growth over the past five years, speaking to the ongoing affordability crisis that continues to plague the state.
Colorado Springs comes in second, with rent growth of 27.3 percent over the past five years, while nearby Aurora, CO ranks seventh at 22.0 percent. Interestingly, Denver itself is absent from this list and the one above -- it seems that while the metro's core city is driving job growth in the region, the surrounding suburbs are seeing the biggest impacts to their rental markets. A similar trend can be seen in other booming metro areas represented in these lists, such as Dallas and San Francisco.
Please see the table below for the most recent rent estimates for your city, or head over to our rental data page to download complete data going back to 2014. And as always, feel free to contact us with any questions!
| Location | Type | Median 1BR rent | Median 2BR rent | M/M rent change | Y/Y rent change |
|---|---|---|---|---|---|
| National | National | $961 | $1,192 | 0.1% | 1.4% |
| Alabama | State | $681 | $827 | 0.4% | 2.0% |
| Alaska | State | $929 | $1,189 | 0.2% | -0.3% |
| Arizona | State | $869 | $1,098 | 0.2% | 3.5% |
| Arkansas | State | $576 | $728 | 0.0% | 0.9% |
| California | State | $1,452 | $1,852 | 0.2% | 1.1% |
| Colorado | State | $1,043 | $1,323 | 0.0% | 1.6% |
| Connecticut | State | $1,080 | $1,352 | -0.1% | 1.1% |
| Delaware | State | $1,024 | $1,249 | 0.5% | 2.8% |
| District of Columbia | State | $1,501 | $1,733 | 0.1% | 1.7% |
Check out our rent reports for the following cities:
- Atlanta, GA
- Austin, TX
- Baltimore, MD
- Boston, MA
- Boulder, CO
- Charlotte, NC
- Chicago, IL
- Cleveland, OH
- Colorado Springs, CO
- Dallas, TX
- Denver, CO
- Detroit, MI
- Fort Collins, CO
- Fort Lauderdale, FL
- Houston, TX
- Indianapolis, IN
- Jacksonville, FL
- Los Angeles, CA
- Miami, FL
- Minneapolis, MN
- New York, NY
- Orlando, FL
- Phoenix, AZ
- Raleigh, NC
- San Antonio, TX
- San Diego, CA
- San Francisco, CA
- San Jose, CA
- Seattle, WA
- Tallahassee, FL
- Tampa, FL
- Tucson, AZ
- Washington, DC
If you would like to get future updates from Apartment List Rentonomics, please subscribe to our email list.
Methodology:
Apartment List Rent Report data is drawn monthly from the millions of listings on our site. 1-bedroom and 2-bedroom rents are calculated as the median for units available in the specified size and time period. Price changes are calculated using a “same unit” methodology similar to the Case-Shiller “repeat sales” home prices methodology, taking the average price change for units available across both time periods. For top city rankings, we calculated median 1-bedroom and 2-bedroom rents in 100 top cities and then ranked them by 2-bedroom rents.
About Apartment List Rent Reports:
Apartment List’s Rent Reports cover rental pricing data in major cities, their suburbs, and their neighborhoods. We provide valuable leading indicators of rental price trends, highlight data on top cities, and identify the key facts renters should know. As always, our goal is to provide price transparency to America’s 105 million renters to help them make the best possible decisions in choosing a place to call home. Apartment List publishes Rent Reports during the first calendar week of each month.
Share this Article
