May 2020 Rent Report
Methodology Note:
Apartment List is committed to making our rent estimates the best and most accurate available. To do this, we start with fully representative median rent statistics for recent movers taken from the Census Bureau American Community Survey. We then extrapolate this data forward to the current month using a growth rate calculated from our listing data. Growth rates are calculated using a same-unit analysis similar to Case-Shiller’s approach, comparing only units that are available across both time periods in order to provide an accurate picture of rent growth in cities across the country.
Our approach corrects for the sample bias inherent in private sources, producing results that are representative of the entire market. Our methodology also allows us to construct a picture of rent growth over an extended period of time, with estimates that are updated each month.
Read more about our methodology here. For further methodology questions or custom data requests, contact us at rentonomics@apartmentlist.com.
Welcome to the May 2020 National Apartment List Rent Report. As the COVID-19 pandemic continues to grip the nation, shelter-in-place orders have ground large segments of the economy to an abrupt halt. While we expect that the pandemic could have a variety of long-term impacts to the housing market, the most salient near-term effect has been a temporary pause on moving activity. This short-term softening of demand has begun to have a slight impact on our monthly rent estimates. National rent growth has flattened this month compared to the trend we were seeing prior to the pandemic, and a number of major markets have seen prices dip over the past month. Our national rent index held steady over the past month and year-over-year growth now stands at 1.4 percent.
Rent growth begins to flatten amid COVID-19
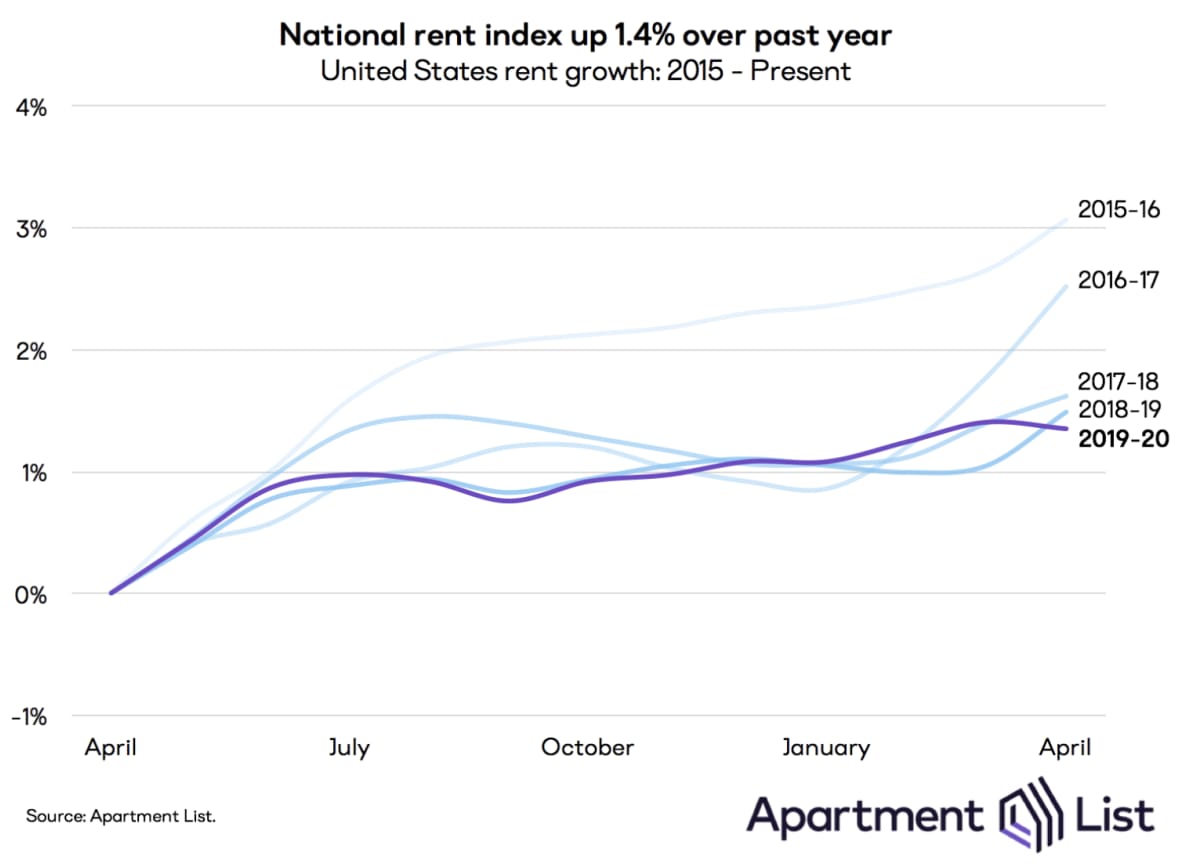
Our national rent index remained essentially flat from March to April, following two months of gradual increases. This flattening is occurring at a time when rent growth is normally picking up steam due to seasonality in the market. From 2016 to 2019, month-over-month rent growth from March to April ranged from 0.2 percent to 0.7 percent. The fact that we’re seeing rents level off at a time when growth normally speeds up is likely reflective of the continued uncertainty surrounding the COVID-19 pandemic.
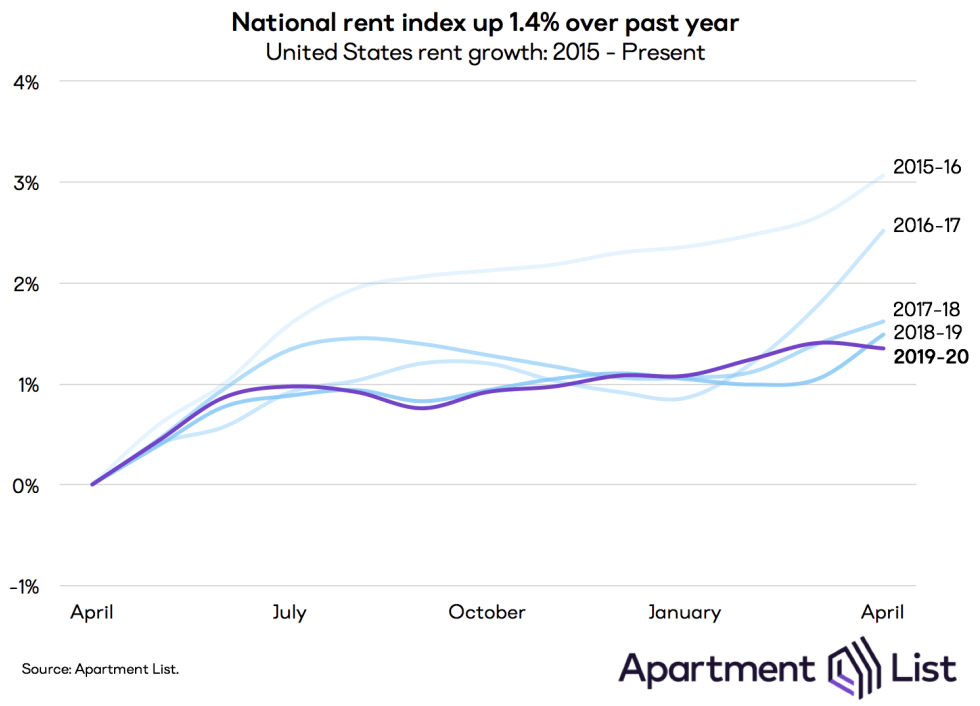
Our index's year-over-year growth rate of 1.4 percent is now the lowest rate that we’ve observed in April over the past five years. Prior year-over-year growth rates in April ranged from 1.5 percent in 2019 to 3.1 percent in 2015. Currently, rent growth is trailing just behind the overall rate of inflation, which stands at 1.5 percent as of the latest data release. Rent growth lags even further behind the growth in average hourly earnings, which have increased by 3.1 percent over the past twelve months. The fact that rent growth has been consistently trailing income growth has been a bright spot of our recent rent reports, but this outlook has shifted rapidly as 26 million Americans have now filed unemployment claims over the past five weeks.
In contrast to last month’s rent reports, which were not yet showing any signs of a pandemic-related impact to prices, the newest data is beginning to reflect softness in the market. This softness is attributable to a temporary freeze on moving activity due to a combination of shelter-in-place orders, eviction moratoriums, and general uncertainty surrounding the virus and the economy. The sharp and immediate decline in mobility has been the most salient impact of COVID-19 on the rental market thus far, and property owners appear to be responding to loose demand by putting a pause on rent increases. That said, growth in our national index has simply levelled off, and has not yet begun to decline. Although we observe slight month-over-month rent decreases in a number of markets, we are not yet seeing a widespread reduction in listed rent prices. While some properties may be offering modest deals to fill outstanding vacancies, it seems that on the whole, most landlords are holding out on significant pricing changes until things begin returning to normal.
As far as longer-term impacts, the pandemic’s effect on rent prices will depend heavily on the broader macroeconomic landscape. We’re likely already in the midst of a coronavirus recession. Although the magnitude and duration of that recession are far from certain, it’s highly possible that when shelter-in-place restrictions are lifted and normal levels of moving resume, we could see an uptick in downgrade moves as many households facing economic instability begin looking for more affordable housing. This could lead to tighter competition for rental units at the middle and lower ends of the market, while luxury vacancies get harder to fill. Under these conditions, we may see a bifurcation of the market in which rents fall for Class A properties, while Class B and C properties actually see accelerated rent growth.
Tourism dependent cities exhibit the biggest month-over-month price dips
The national slowdown in rent growth over the past month was mirrored in market-level data across the nation. Of the 100 largest cities for which we have data, just 38 saw rents increase over the past month; the same number of cities saw prices decline month-over-month, while rents held flat in the remaining 24 cities.
In the immediate fallout of the quarantine economy, the tourism and service sectors are bearing the brunt of the impact, and regions that lean heavily on these industries -- such as Las Vegas, Orlando, and Miami -- are poised to be hit with the most severe labor market disruptions. Those employment effects are now starting to filter through to the rental market. Henderson, NV saw rents decline 1.0 percent month-over-month, the largest monthly decline among the 100 largest cities, while neighboring Las Vegas experienced a 0.3 percent dip. Orlando had the second largest decline, with rents down 0.7 percent month-over-month, while Miami saw rents fall by 0.5 percent. In New York City, which has become a global epicenter of the pandemic, April rents were down 0.3 percent compared to March.
While these rent decreases are notable, it’s important to bear in mind that the scale of the price changes is still fairly modest. Even in Henderson, which saw the biggest decline, the month-over-month change translates to roughly a $14 discount on the median two-bedroom rent. That said, if this turns out to be the beginning of an ongoing trend, it’s possible that some cities may end up experiencing more sizable price reductions in the ensuing months.
Phoenix area experiencing fastest growth over the past year
Looking beyond the most recent month of data, Mesa, AZ tops our list for the nation's fastest rent growth over the past year. Rents in Mesa have grown by 4.1 percent over the last year, nearly triple the national rate. Mesa is located just outside of Phoenix, which ranks third on the list at 2.9 percent. Mesa is followed in the rent growth rankings by Nashville (3.3 percent), while Colorado Springs ranks fourth at 2.9 percent.
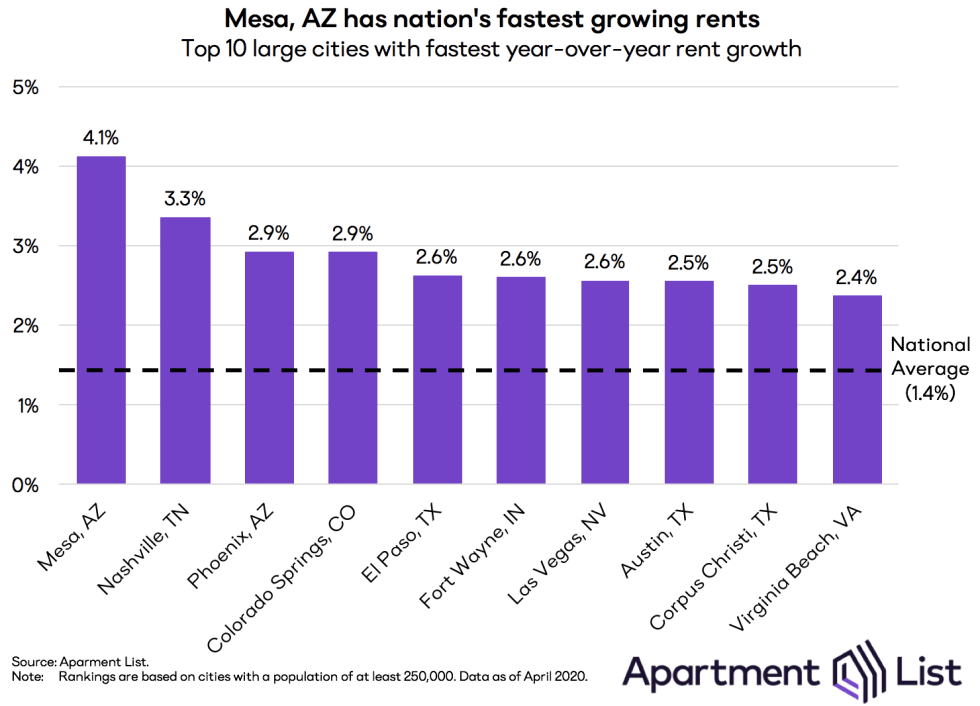
Despite its month-over-month decline, Las Vegas has still experienced the seventh fastest rate of rent growth over the past year at 2.6 percent. That said, Henderson, which ranked fifth for year-over-year growth in last month’s report, has now fallen out of the top 10. The Las Vegas metro has seen rapid job growth in recent years, but much of that growth has been concentrated in low-paying occupations in the service and tourism industries, which are already experiencing broad layoffs as travel and recreation come to a near halt, at least temporarily. Due to its extreme dependence on the tourism and service sectors, the Las Vegas economy is highly cyclical, and the region will likely be dealing with the economic ramifications of COVID-19 for some time to come.
.
Outskirts of the Bay Area have seen the most rapid growth since 2015
For many of the cities mentioned above, rapid rent growth is not a new phenomenon. Four of the cities in the top 10 for fastest year-over-year growth -- Mesa, AZ; Phoenix, AZ; Colorado Springs, CO; and Las Vegas, NV -- also make the list for fastest rent growth over the past five years.
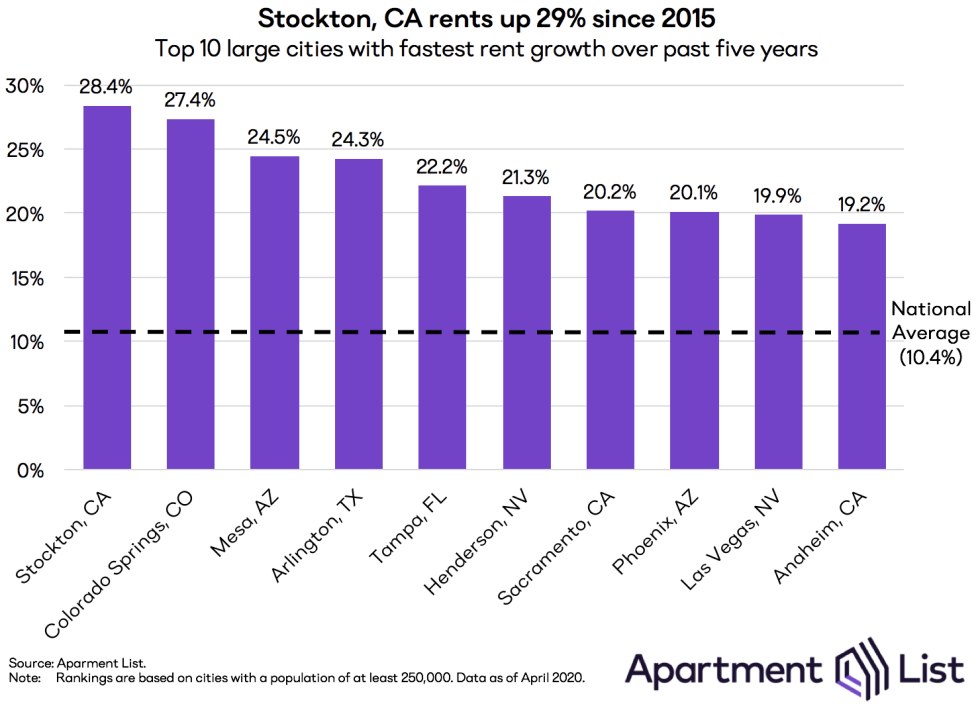
Stockton, CA continues to top this list, with rent growth of 28.4 percent since April 2015. For comparison, our national rent index grew by just 10.4 percent over this period. Stockton sits on the outskirts of the San Francisco Bay area, and also ranked number one in our report on the metros with the highest shares of "super commuters" who travel more than 90 minutes each way to work. Sacramento also makes this top 10 list, as the Bay Area's affordability crisis spreads to the farther reaches of the region.
Interestingly, San Francisco itself is absent from this list and the one above -- it seems that while the metro's core city is driving job growth in the region, the surrounding areas are seeing the biggest impacts to their rental markets. A similar trend can be seen in other booming metro areas represented in these lists, such as Denver, Dallas, and Los Angeles.
Please see the table below for the most recent rent estimates for your city, or head over to our rental data page to download complete data going back to 2014. And as always, feel free to contact us with any questions!
Check out our rent reports for the following cities:
- Atlanta, GA
- Austin, TX
- Baltimore, MD
- Boston, MA
- Boulder, CO
- Charlotte, NC
- Chicago, IL
- Cleveland, OH
- Colorado Springs, CO
- Dallas, TX
- Denver, CO
- Detroit, MI
- Fort Collins, CO
- Fort Lauderdale, FL
- Houston, TX
- Indianapolis, IN
- Jacksonville, FL
- Los Angeles, CA
- Miami, FL
- Minneapolis, MN
- New York, NY
- Orlando, FL
- Phoenix, AZ
- Raleigh, NC
- San Antonio, TX
- San Diego, CA
- San Francisco, CA
- San Jose, CA
- Seattle, WA
- Tallahassee, FL
- Tampa, FL
- Tucson, AZ
- Washington, DC
If you would like to get future updates from Apartment List Rentonomics, please subscribe to our email list.
Methodology:
Apartment List Rent Report data is drawn monthly from the millions of listings on our site. 1-bedroom and 2-bedroom rents are calculated as the median for units available in the specified size and time period. Price changes are calculated using a “same unit” methodology similar to the Case-Shiller “repeat sales” home prices methodology, taking the average price change for units available across both time periods. For top city rankings, we calculated median 1-bedroom and 2-bedroom rents in 100 top cities and then ranked them by 2-bedroom rents.
About Apartment List Rent Reports:
Apartment List’s Rent Reports cover rental pricing data in major cities, their suburbs, and their neighborhoods. We provide valuable leading indicators of rental price trends, highlight data on top cities, and identify the key facts renters should know. As always, our goal is to provide price transparency to America’s 105 million renters to help them make the best possible decisions in choosing a place to call home. Apartment List publishes Rent Reports during the first calendar week of each month.
Share this Article
