June 2018 Rent Report
Methodology Note:
Apartment List is committed to making our rent estimates the best and most accurate available. To do this, we start with fully representative median rent statistics for recent movers taken from the Census Bureau American Community Survey. We then extrapolate this data forward to the current month using a growth rate calculated from our listing data. Growth rates are calculated using a same-unit analysis similar to Case-Shiller’s approach, comparing only units that are available across both time periods in order to provide an accurate picture of rent growth in cities across the country.
Our approach corrects for the sample bias inherent in private sources, producing results that are representative of the entire market. Our methodology also allows us to construct a picture of rent growth over an extended period of time, with estimates that are updated each month.
Read more about our methodology here. For further methodology questions or custom data requests, contact us at rentonomics@apartmentlist.com.
.
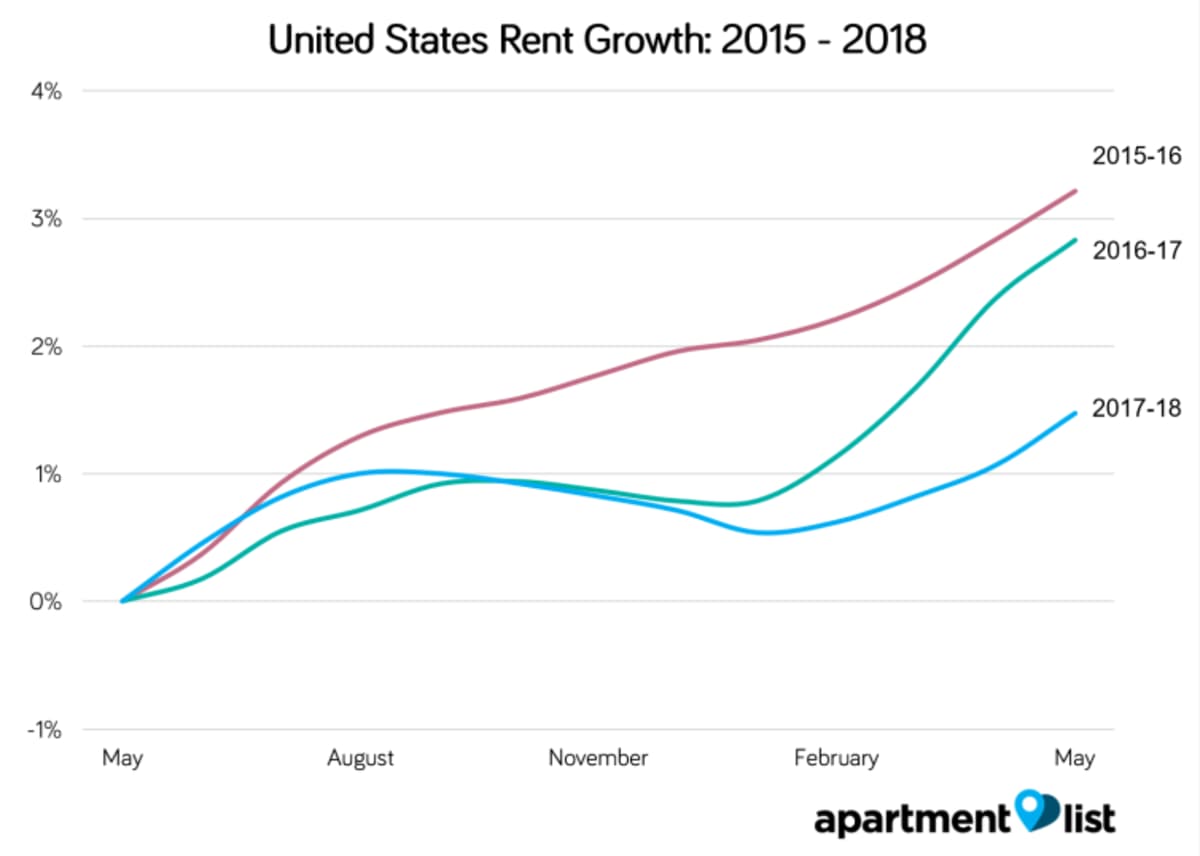
Welcome to the June 2018 National Apartment List Rent Report! Our national rent index is up 0.4 percent month-over-month, marking the fourth straight month of increasing rents. Year-over-year growth now stands at 1.5 percent, lagging the rates from the two prior years.
Read on for an analysis of the trends we're seeing this month.
.
National index up 0.4 percent M/M
Our national rent index increased by 0.4 percent over the past month as we begin to enter the peak rental season. Year-over-year growth currently stands at 1.5 percent, falling below the levels from the two prior years.
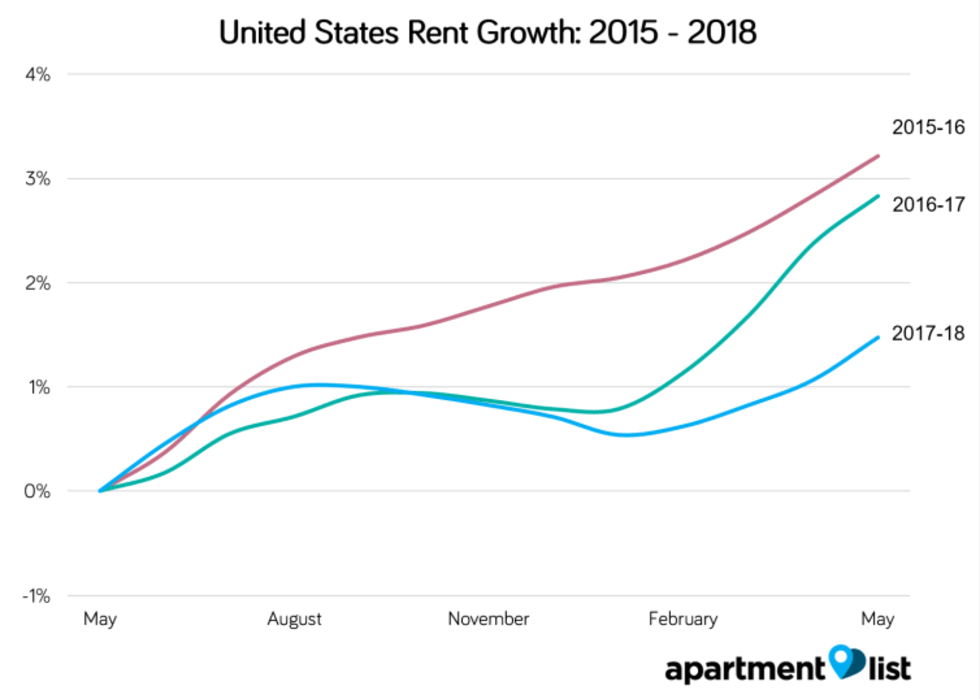
Our national rent index has now increased for each of the past four months, with a total increase of 0.9 percent over that period. The recent upswing is consistent with seasonality in apartment rentals, and we're now beginning to enter the summer months, when rental activity is at its busiest. This months increase is the largest we've seen since last July, and we expect this heightened rent growth to continue throughout the summer. That said, the gains of the past four months have been somewhat muted compared to the previous two years, signaling a bit of softness in the market.
In fact, year-over-year growth currently stands at 1.5 percent at the national level, which is well below both the 2.8 percent rate we saw this time last year and the 3.2 percent rate from May 2016. Rent growth is pacing a full percentage point behind the overall rate of inflation, which stands at 2.5 percent as of the latest data release, and is similarly lagging growth in average hourly earnings which have increased by 2.6 percent over the past twelve months. With the homeownership rate continuing to trend upward and more new supply slated to come online throughout the year in many markets, it's possible that rent growth may continue to be sluggish.
.
Rents up M/M in 85 of 100 largest cities
The uptick in rents at the national level is being mirrored in many of the nation's biggest markets -- the map below show's month-over-month rent growth for the nation's 100 largest cities (markers are sized by population):
Rents increased month-over-month in 85 of the nation's 100 largest cities. Note that this is up slightly from the 78 cities that saw rents rise last month. Rents are also up year-over-year in nearly all of the nations largest markets -- 82 of the 100 largest cities have seen rents increase over the past twelve months. The chart below shows how rents have changed over the past year for the five cities that experienced the fastest growth:
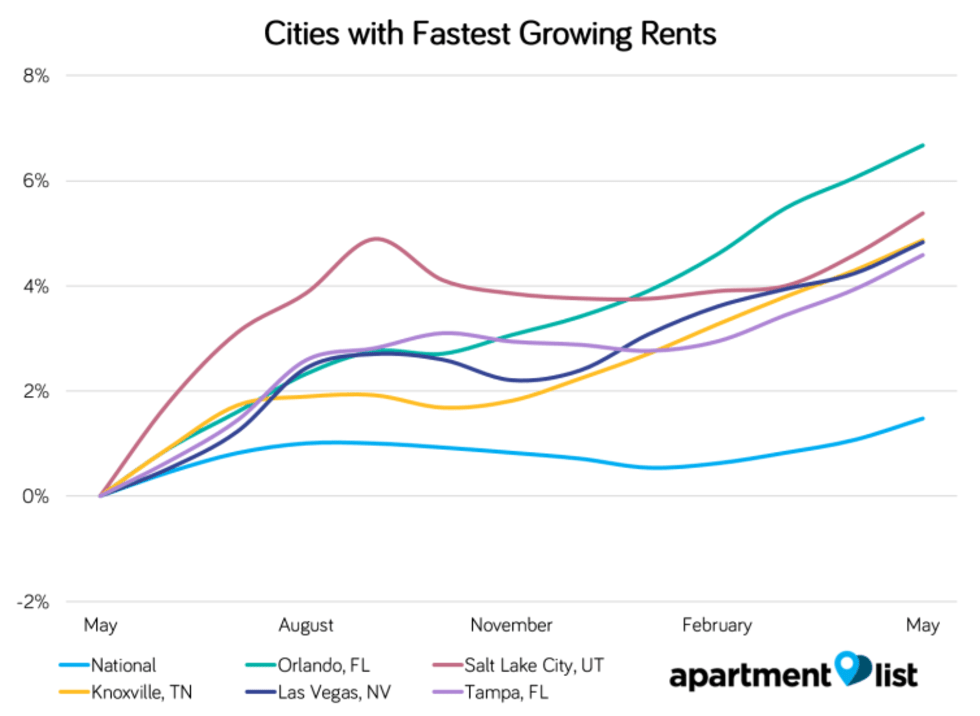
Orlando continues to experience the nation's fastest rent growth with an increase of 6.7 percent over the last year, although this pace has been slowing over the past couple months. Salt Lake City comes in second with 5.4 percent year-over-year growth, followed by Knoxville, TN, which saw rents grow by 4.9 percent.
At the state level, Nevada experienced the fastest year-over-year growth at 3.9 percent, followed by Utah at 3.4 percent.
.
Few cities experiencing Y/Y rent declines
Only 18 of the 100 largest cities have seen rents fall over the past year, though an additional 20 saw modest gains of less than 1.0 percent. The chart below shows trends for the five cities where rents declined most:
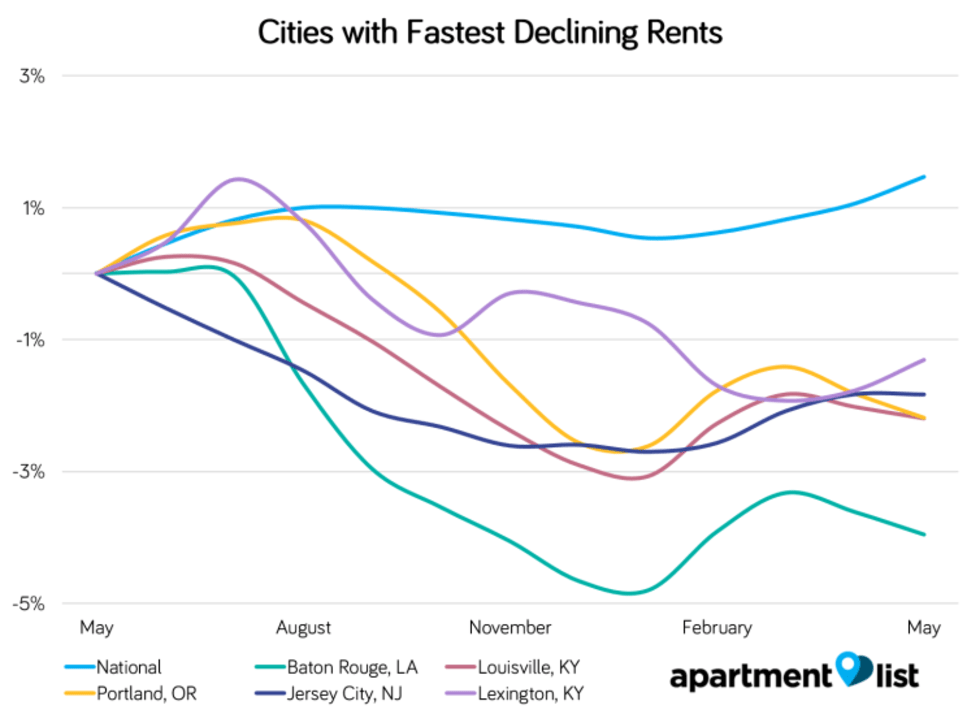
Baton Rouge, LA has experienced the largest dip in rents over the past year with -4.0 percent growth, followed by Louisville, which saw rents fall by 2.0 percent over the past year.
At the state level, Hawaii saw the biggest year-over-year decline at 2.4 percent. No other state saw rents fall by more than 1.0 percent -- Alaska comes in second, with a 0.8 percent decrease.
Please see additional data below for the nation's 100 largest cities, or check out the full data for your city at our rental data page. And as always, feel free to contact us with any questions!
| City Name | Median 1 BR rent | Median 2 BR rent | M/M rent change | Y/Y rent change |
|---|---|---|---|---|
| New York, NY | $2,090 | $2,490 | 0.9% | 1.0% |
| Los Angeles, CA | $1,360 | $1,740 | 0.2% | 1.8% |
| Chicago, IL | $1,080 | $1,270 | 0.3% | -0.9% |
| Houston, TX | $840 | $1,030 | 0.3% | 3.4% |
| Philadelphia, PA | $970 | $1,170 | 0.5% | 1.2% |
| Phoenix, AZ | $830 | $1,040 | 0.4% | 2.2% |
| San Antonio, TX | $840 | $1,050 | 0.3% | 0.8% |
| San Diego, CA | $1,550 | $2,010 | 0.1% | 1.8% |
| Dallas, TX | $890 | $1,110 | 0.4% | 1.0% |
| San Jose, CA | $2,070 | $2,600 | 0.6% | 2.1% |
Check out our rent reports for the following cities:
- Atlanta, GA
- Austin, TX
- Baltimore, MD
- Boston, MA
- Boulder, CO
- Charlotte, NC
- Chicago, IL
- Cleveland, OH
- Colorado Springs, CO
- Dallas, TX
- Denver, CO
- Detroit, MI
- Fort Collins, CO
- Fort Lauderdale, FL
- Houston, TX
- Indianapolis, IN
- Jacksonville, FL
- Los Angeles, CA
- Miami, FL
- Minneapolis, MN
- New York, NY
- Orlando, FL
- Phoenix, AZ
- Raleigh, NC
- San Antonio, TX
- San Diego, CA
- San Francisco, CA
- San Jose, CA
- Seattle, WA
- Tallahassee, FL
- Tampa, FL
- Tucson, AZ
- Washington, DC
If you would like to get future updates from Apartment List Rentonomics, please subscribe to our email list.
Methodology:
Apartment List Rent Report data is drawn monthly from the millions of listings on our site. 1-bedroom and 2-bedroom rents are calculated as the median for units available in the specified size and time period. Price changes are calculated using a “same unit” methodology similar to the Case-Shiller “repeat sales” home prices methodology, taking the average price change for units available across both time periods. For top city rankings, we calculated median 1-bedroom and 2-bedroom rents in 100 top cities and then ranked them by 2-bedroom rents.
About Apartment List Rent Reports:
Apartment List’s Rent Reports cover rental pricing data in major cities, their suburbs, and their neighborhoods. We provide valuable leading indicators of rental price trends, highlight data on top cities, and identify the key facts renters should know. As always, our goal is to provide price transparency to America’s 105 million renters to help them make the best possible decisions in choosing a place to call home. Apartment List publishes Rent Reports during the first calendar week of each month.
Share this Article
