January 2018 Rent Report
Methodology Note:
Apartment List is committed to making our rent estimates the best and most accurate available, and as part of our efforts toward that goal, we've recently made some changes to our methodology. Data from private listing sites, including our own, tend to skew towards luxury apartments, introducing sample bias.
In order to address these limitations, our estimates now start with reliable median rent statistics from the Census Bureau, which we then extrapolate forward to the current month using a growth rate calculated from our listing data. In calculating that growth rate, we use a same-unit analysis similar to Case-Shiller’s approach, comparing only units that are available across both time periods to provide an accurate picture of rent growth in cities across the country.
We are continuously working to improve our methodology and data, with the goal of providing renters with the information that they need to make the best decisions. You can read more about our new methodology here.
Welcome to the January 2018 National Apartment List Rent Report! Our national rent index is down 0.1 percent month-over-month, marking the fourth straight month that we've seen rents fall.
Read on for an analysis of the trends we're seeing this month:
National index down 0.1 percent month-over-month
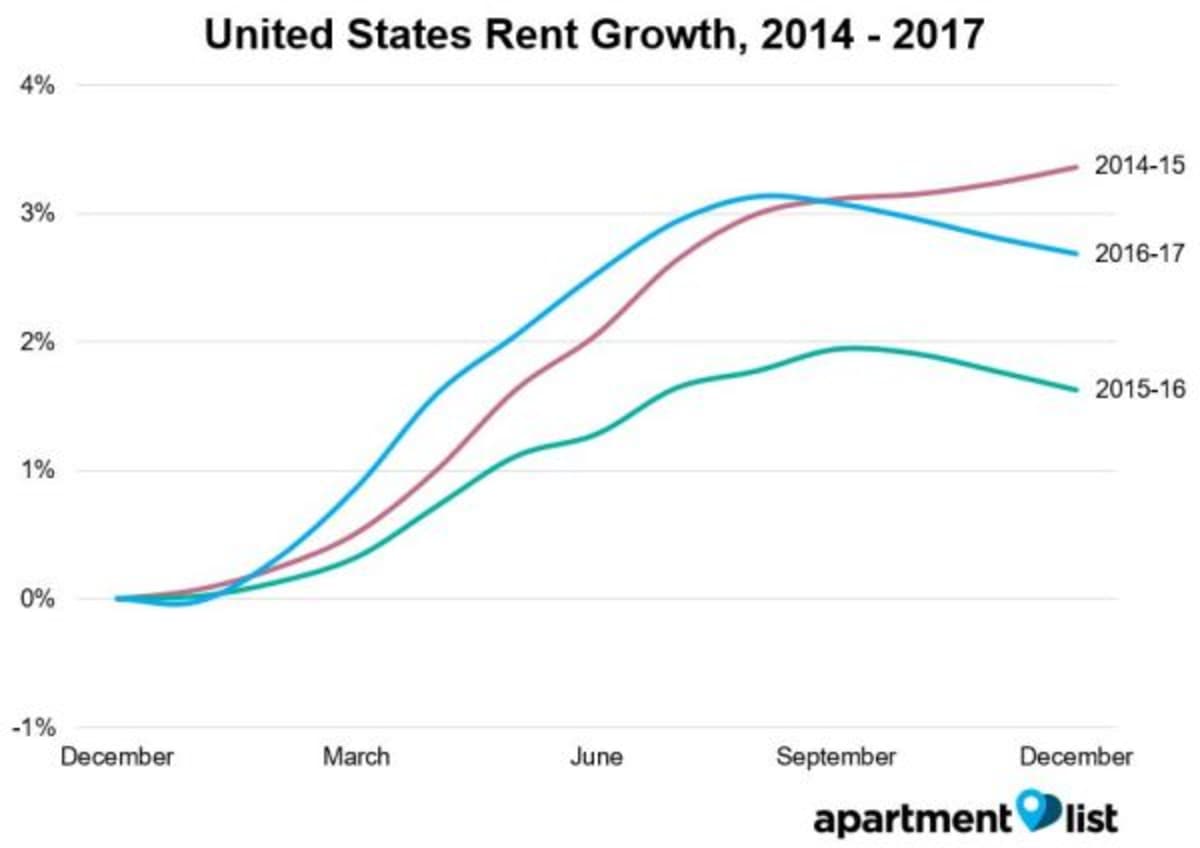
After increasing by 3.1 percent from January through August, our national rent index fell by by 0.4 percent over the final four months of the year. Year-over-year growth is closing out the year at 2.7 percent, falling in between the levels from the two prior years.
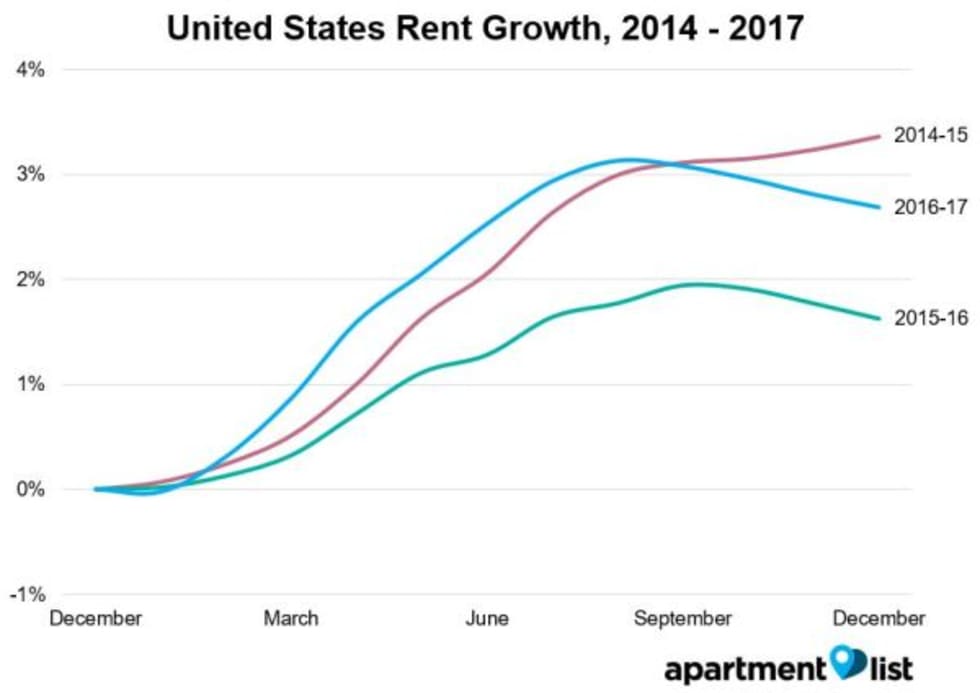 After beginning to flatten in August, our national index has now declined for four straight months. Rental activity is generally slower in the fall and winter months, and it's typical to see rent growth taper off at this time of year due to that seasonality. That said, the decline started a bit earlier than usual this year, after relatively strong rent growth through most of the year.
Despite the decrease over the past month, rents are still up 2.7 percent year-over-year at the national level. Year-over-year growth continues to fall between the 1.6 percent rate from this time last year and the 3.4 percent growth rate from December 2015. Rent growth is pacing a bit ahead of the overall rate of inflation, which stands at 2.2 percent as of the latest data release, and just slightly ahead of average hourly earnings which have increased by 2.5 percent over the past twelve months.
Rents down month-over-month in 62 of 100 largest cities
The drop in rents at the national level is being mirrored in many of the nations biggest markets -- the map below show's month-over-month rent growth for the nation's 100 largest cities (markers are sized by population):
Note that rents declined month-over-month in 62 of the nation's 100 largest cities, which is down from 66 cities that saw rents fall last month and 73 cities with month-over-month decreases in October. Despite the seasonal slowdown, rents are still up year-over-year in nearly all of the nations largest markets -- 91 of the 100 largest cities have seen rents increase over the past twelve months. The chart below shows how rents have changed over the past year for the five cities that experienced the fastest growth:
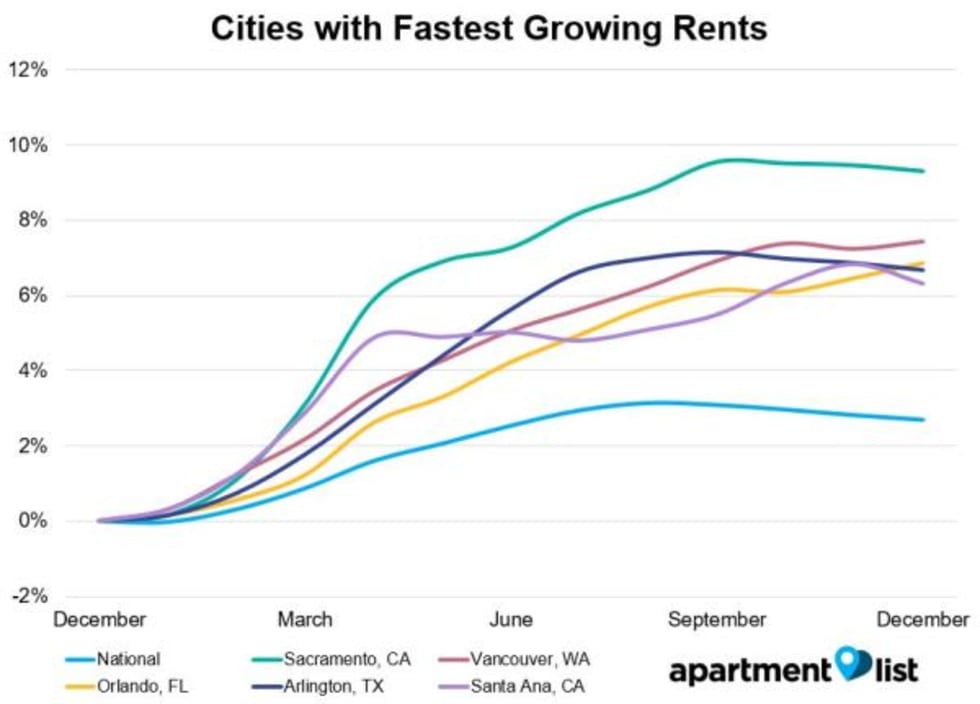
Sacramento continues to experience the nation's fastest rent growth, with an increase of 9.3 percent over the past year. Vancouver, WA came in second with 7.4 percent year-over-year growth, followed by Orlando, which saw rents grow by 6.9 percent.
At the state level, Idaho experienced the fastest year-over-year growth in the nation at 4.9 percent, followed by Utah, Nevada, California and Arizona, all of which saw rent growth of more than four percent.
Few cities experiencing Y/Y rent declines
Only 9 of the 100 largest cities have seen rents fall over the past year, but an additional 31 saw modest gains of less than 2 percent. The chart below shows trends for the five cities where rents declined most:
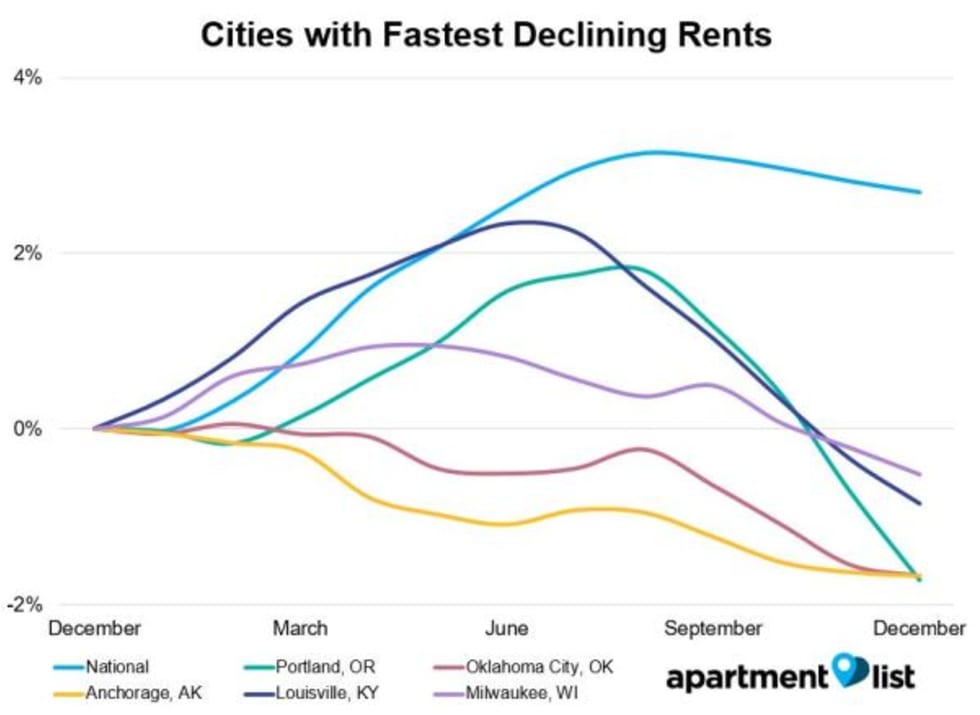
Portland, OR tops this list, with rents declining by 1.7 percent over the past year; rents in Portland actually increased by 1.8 percent from December 2016 through August of this year, but have dropped sharply by 3.5 percent in the past four months. Portland is a hot market with a strong economy and high demand, but the city has seen a large amount of new construction this year, which may explain the recent dip in prices.
At the state level, Hawaii saw the biggest drop in rents over the past year with a decrease of 1.2 percent. North Dakota and Wyoming are the only other states to experience decreases of more than 1 percent.
Hurricane Harvey and CA wildfires continue to impact rents
Hurricane Harvey and the Northern California wildfires both destroyed huge amounts of rental inventory, and the impact of these tragic disasters is continuing to show up in our rent data for the affected markets.
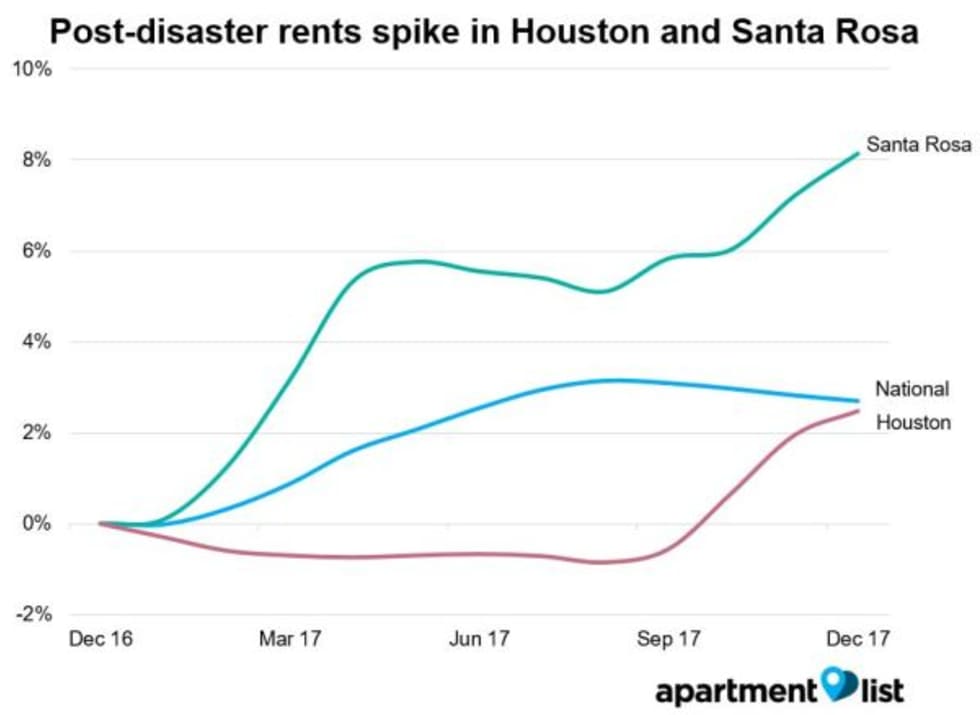
Houston was previously one of the softest markets in the country, with rents falling throughout this year, but the city has now seen rents spike by three percent over the past three months. Year-over-year growth now stands at 2.5 percent, just below the national average. That said, this month's increase of 0.5 percent, while substantial, is less than half as large as the month-over-month increases from the two prior months, indicating that the area's rental market may be starting to stabilize.
Santa Rosa, on the other hand, was already a hot market with a short supply of rental inventory, and with the recent wildfires destroying an estimated 5 percent of the city's housing stock, that shortage has now been exacerbated. Rents in Santa Rosa have increased by 2.1 percent over the past two months, putting year-over-year growth at a staggering 8.1 percent.
Recovering from these disasters will be a lengthy process, and it's likely that rents will continue to increase in these cities in the coming months.
Please see additional data below for the nation's 100 largest cities, or check out the full data for your city or county at our rental data page. And as always, feel free to contact us with any questions!
| City Name | Median 1 BR rent | Median 2 BR rent | M/M rent change | Y/Y rent change |
|---|---|---|---|---|
| New York, NY | $2,070 | $2,470 | -0.2% | 0.1% |
| Los Angeles, CA | $1,360 | $1,750 | -0.4% | 3.4% |
| Chicago, IL | $1,060 | $1,250 | -0.2% | 0.8% |
| Houston, TX | $840 | $1,030 | 0.6% | 2.5% |
| Philadelphia, PA | $960 | $1,160 | 0.2% | 1.1% |
| Phoenix, AZ | $820 | $1,020 | 0.1% | 3.8% |
| San Antonio, TX | $830 | $1,040 | 0.0% | 1.6% |
| San Diego, CA | $1,540 | $1,990 | -0.6% | 3.3% |
| Dallas, TX | $880 | $1,100 | -0.3% | 2.2% |
| San Jose, CA | $2,020 | $2,530 | -0.7% | 2.7% |
Check out our rent reports for the following cities:
- Atlanta, GA
- Austin, TX
- Baltimore, MD
- Boston, MA
- Boulder, CO
- Charlotte, NC
- Chicago, IL
- Cleveland, OH
- Colorado Springs, CO
- Dallas, TX
- Denver, CO
- Detroit, MI
- Fort Collins, CO
- Fort Lauderdale, FL
- Houston, TX
- Indianapolis, IN
- Jacksonville, FL
- Los Angeles, CA
- Miami, FL
- Minneapolis, MN
- New York, NY
- Orlando, FL
- Phoenix, AZ
- Raleigh, NC
- San Antonio, TX
- San Diego, CA
- San Francisco, CA
- San Jose, CA
- Seattle, WA
- Tallahassee, FL
- Tampa, FL
- Tucson, AZ
- Washington, DC
If you would like to get future updates from Apartment List Rentonomics, please subscribe to our email list.
Methodology:
Apartment List Rent Report data is drawn monthly from the millions of listings on our site. 1-bedroom and 2-bedroom rents are calculated as the median for units available in the specified size and time period. Price changes are calculated using a “same unit” methodology similar to the Case-Shiller “repeat sales” home prices methodology, taking the average price change for units available across both time periods. For top city rankings, we calculated median 1-bedroom and 2-bedroom rents in 100 top cities and then ranked them by 2-bedroom rents.
About Apartment List Rent Reports:
Apartment List’s Rent Reports cover rental pricing data in major cities, their suburbs, and their neighborhoods. We provide valuable leading indicators of rental price trends, highlight data on top cities, and identify the key facts renters should know. As always, our goal is to provide price transparency to America’s 105 million renters to help them make the best possible decisions in choosing a place to call home. Apartment List publishes Rent Reports during the first calendar week of each month.
Share this Article
