February Rent Report
Welcome to the February 2017 National Apartment List Rent Report! Nationwide, rents increased slightly this month, after four straight months of decreases which capped off a year of lowered rent growth.
Read on for a review of last year's trends, a look at where the market stands right now, and a summary of what we'll be watching for in the year ahead.
Year in Review - Rents leveled off in 2016

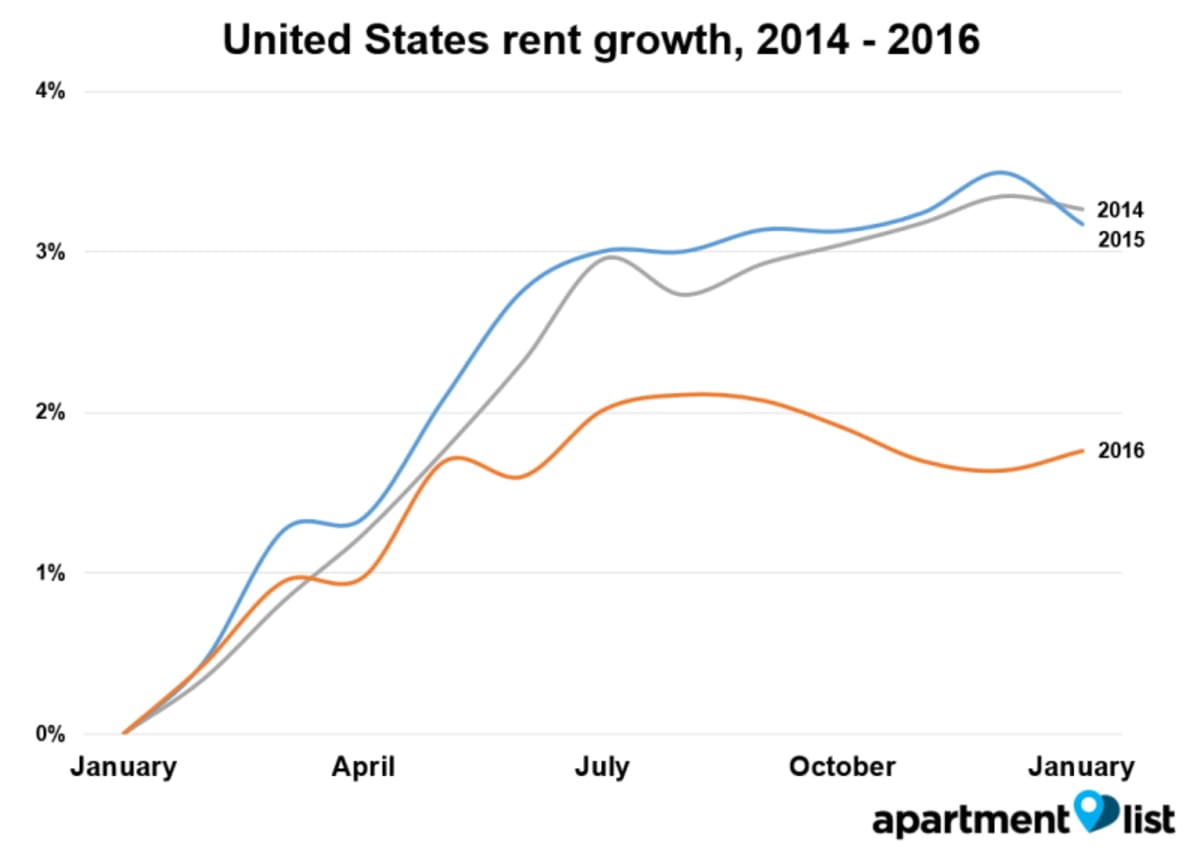
Our national index shows that rents this month were 1.8% higher than at the same point last year; note, however, that rents have been essentially flat over the past eight months and are currently at roughly the same level as they were in May of last year. As the chart above shows, rent growth in 2016 was significantly lower than in the two years prior.
In the aftermath of the housing crisis, as the number of renters increased, a dearth of new construction resulted in low vacancy rates and sharp increases in rents. With housing starts in 2016 rising to their highest level since 2007, the recent trend would seem to indicate that rents may be beginning to stabilize, although there remains significant variation in markets across the country. Some of the nation's most expensive markets have cooled, but there are still many areas where rents are growing rapidly.
Rents have fallen in some of the nation's most expensive metros
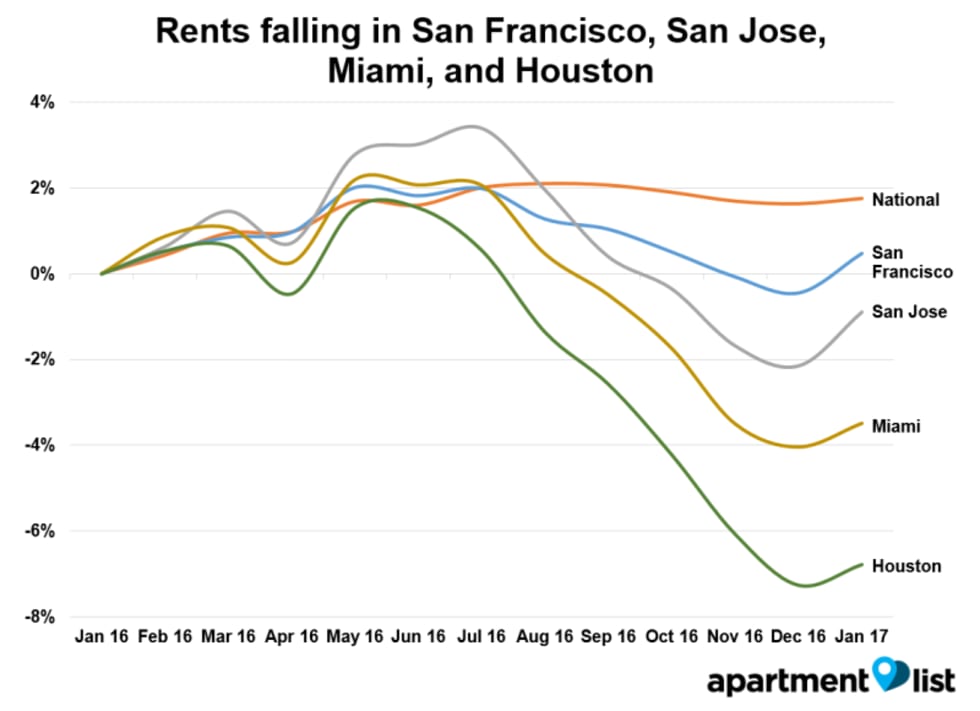
The pattern of slowed rent growth has tended to be most stark in the costliest metros. Rents have actually fallen year-over-year in San Francisco, San Jose, Miami, and Houston, and eight of the ten most expensive markets saw rent growth of 1% or less in 2016.
Many of these cities have seen a significant number of new units come onto the market in the past year, although much of that new construction has targeted the luxury market. In part, the flattening rent growth in these cities can be attributed to these high end units, where excess supply has led to landlords offering generous concessions. Despite apparent softening in these markets, there are still significant shortages of low and middle income housing in the nation's most expensive cities.
Market still booming in Washington; areas surrounding costliest cities also see big growth

Despite the relatively flat growth at the national level, there are still plenty of cities where rental markets have yet to show signs of slowing. The Northwest part of the country continues to boom, with Tacoma, WA topping our list of cities with the fastest growing rents. Seattle, Vancouver, Spokane, and Boise all also experienced year-over-year growth above 4.5%.
One trend worth noting is that some of the fastest rent growth is happening in smaller cities surrounding the nation's priciest hubs - apparent evidence of renters in these markets moving out of core cities to find more affordable options. For example, the median 2-bedroom rent in Arlington, TX rose 7.0% year-over-year to $990, compared to $1,650 in nearby Dallas. The table below shows additional examples of this same pattern emerging in metros across the country:
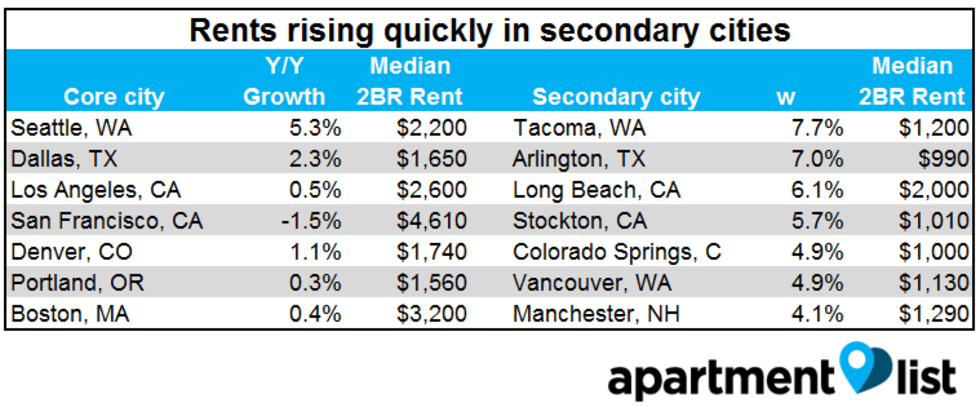
With the exception of Seattle and Dallas, all the core cities in this table have year-over-year growth below the national average. As noted above, despite flat rent growth, these cities remain unaffordable for many, which seems to be creating additional demand in nearby markets.
What we're watching for in 2017
Perhaps the biggest story of 2017 will be how potential mortgage rate increases will affect the market. Over the past couple months, mortgage rates have begun to move upward in the wake of President Trump's election and the Federal Reserve's increase in its target rate. Rates are still at historically low levels, and the increases we've seen so far aren't likely to have a huge impact, but there's still uncertainty over how much additional increase we'll see over the course of this year. If mortgage rates continue to increase, some potential first-time homebuyers could decide to continue renting, possibly adding tightness to the rental market.
Some of the uncertainty in what's to come for the housing market will be decided by the actions of the new Trump administration. The Fed's most recent forecast calls for three additional rate hikes over the course of 2017, but if President Trump follows through on his promises of increased fiscal stimulus, it's possible that the Fed may react even more quickly than expected, which would likely have an upward impact on mortgage rates. On the other hand, President Trump's plans to decrease various forms of regulation could lead to loosening credit standards and a pickup in new construction.
Another point of uncertainty is the likely confirmation of Ben Carson as Secretary of the Department of Housing and Urban Development (HUD). Carson lacks experience in government and housing, and his plans for HUD remain unclear. HUD programs are instrumental in ensuring the availability of fair and affordable housing, which is currently lacking in many of the nation's biggest cities. In one of his first decisions after taking office, President Trump suspended the recently announced FHA mortgage insurance premium cut (the FHA is a part of HUD), which would have made mortgages slightly more affordable for some first-time homebuyers. This particular action is not expected to have a significant effect on the market, but we'll be watching closely to see how the new administration shapes housing policy.
Please see additional data below for the nation's 100 largest cities, or check out the full data for your city or county at our rental data page. And as always, feel free to contact us with any questions!
| City Name | Median 1 BR price | Median 2 BR price | M/M price change | Y/Y price change |
|---|---|---|---|---|
| San Francisco, CA | $3,420 | $4,610 | 0.6% | -1.5% |
| New York, NY | $3,220 | $4,110 | -0.1% | 1.0% |
| Boston, MA | $2,790 | $3,200 | 0.7% | 0.4% |
| Washington, DC | $2,140 | $3,040 | -0.3% | 0.1% |
| Jersey City, NJ | $2,540 | $2,900 | 1.2% | 2.1% |
| Los Angeles, CA | $1,870 | $2,600 | -0.1% | 0.5% |
| San Jose, CA | $2,110 | $2,600 | 0.3% | -1.4% |
| Stamford, CT | $1,920 | $2,400 | 0.3% | -0.6% |
| Miami, FL | $1,850 | $2,330 | -0.9% | -2.8% |
| Seattle, WA | $1,650 | $2,200 | 1.1% | 5.3% |
Check out our rent reports for the following cities:
- Atlanta, GA
- Austin, TX
- Baltimore, MD
- Boston, MA
- Boulder, CO
- Charlotte, NC
- Chicago, IL
- Cleveland, OH
- Colorado Springs, CO
- Dallas, TX
- Denver, CO
- Detroit, MI
- Fort Collins, CO
- Fort Lauderdale, FL
- Houston, TX
- Indianapolis, IN
- Jacksonville, FL
- Los Angeles, CA
- Miami, FL
- Minneapolis, MN
- New York, NY
- Orlando, FL
- Phoenix, AZ
- Raleigh, NC
- San Antonio, TX
- San Diego, CA
- San Francisco, CA
- San Jose, CA
- Seattle, WA
- Tallahassee, FL
- Tampa, FL
- Tucson, AZ
- Washington, DC
If you would like to get future updates from Apartment List Rentonomics, please subscribe to our email list.
Methodology:
Apartment List Rent Report data is drawn monthly from the millions of listings on our site. 1-bedroom and 2-bedroom rents are calculated as the median for units available in the specified size and time period. Price changes are calculated using a “same unit” methodology similar to the Case-Shiller “repeat sales” home prices methodology, taking the average price change for units available across both time periods. For top city rankings, we calculated median 1-bedroom and 2-bedroom rents in 100 top cities and then ranked them by 2-bedroom rents.
About Apartment List Rent Reports:
Apartment List’s Rent Reports cover rental pricing data in major cities, their suburbs, and their neighborhoods. We provide valuable leading indicators of rental price trends, highlight data on top cities, and identify the key facts renters should know. As always, our goal is to provide price transparency to America’s 105 million renters to help them make the best possible decisions in choosing a place to call home. Apartment List publishes Rent Reports during the first calendar week of each month.
Share this Article
