August 2017 Rent Report

Methodology Updates
Apartment List is committed to making our rent estimates the best and most accurate available, and as part of our efforts toward that goal, we've recently made some changes to our methodology. Data from private listing sites, including our own, tends to skew towards luxury apartments, introducing sample bias.
In order to address these limitations, our estimates now start with reliable median rent statistics from the Census Bureau, which we then extrapolate forward to the current month using a growth rate calculated from our listing data. In calculating that growth rate, we use a same-unit analysis similar to Case-Shiller’s approach, comparing only units that are available across both time periods to provide an accurate picture of rent growth in cities across the country.
We are continuously working to improve our methodology and data, with the goal of providing renters with the information that they need to make the best decisions. You can read more about our new methodology here.
Welcome to the August 2017 National Apartment List Rent Report! This month we're seeing a continuation of summer rent increases, with our national index up 0.4% month-over-month.
Read on for an analysis of the trends we're seeing this month:
National index up 0.4% month-over-month
Our national rent index has increased every month this year, with year-over-year growth currently falling in between the levels from the two prior years. Rents grew at a rate of 0.4% between June and July, representing a slight slowdown from last month's 0.5% growth, but still in line with the average monthly growth we've seen the course of the year.
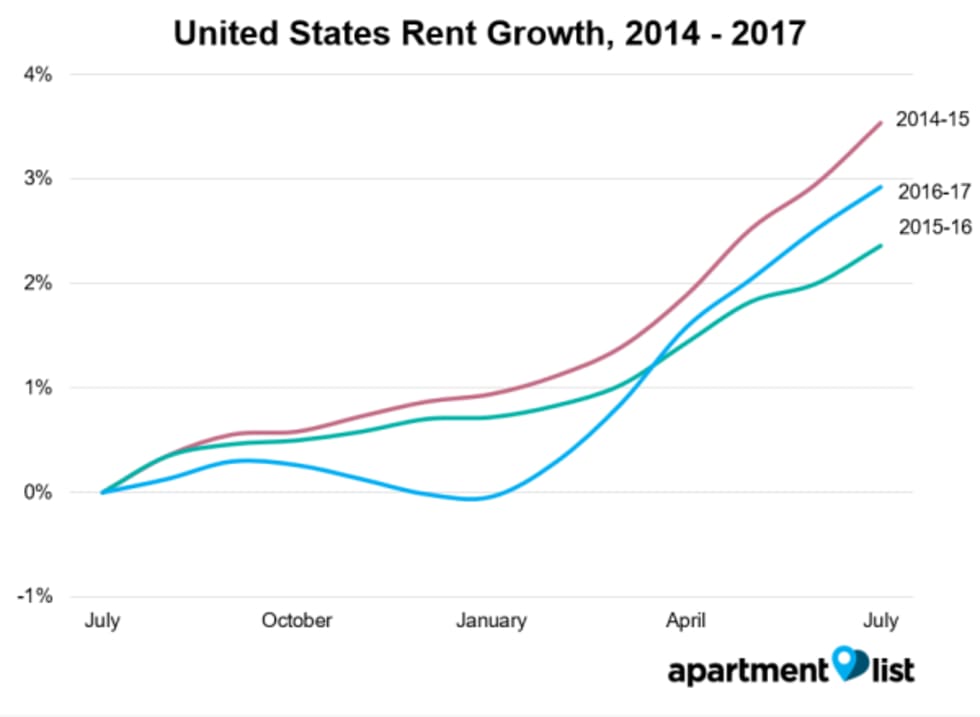
Year-over-year growth at the national level currently stands at 2.9%, surpassing the 2.4% rate from this time last year, but still lagging a bit behind the 3.5% growth experienced in 2015. Stagnating rents for most of last year indicated that the market might be softening after years of substantial increases, but rents began steadily climbing in January, and year-over-year growth is now exceeding the overall rate of inflation, which currently stands at 1.6%. Given the seasonal nature of the rental market, we expect prices to continue their recent trend of sustained growth through the end of the summer, before leveling off in the fall and winter.
In a recent Apartment List analysis, we dug into one of the reasons for continued rent growth - in the years since the recession, the economy has been steadily adding jobs across the country, however, construction of new housing has continued to lag. We looked at U.S. Census data on building permits and Bureau of Labor Statistics (BLS) data on employment to see how the supply of new housing has responded to the demand spurred by job growth.
We found that only 10 of the 50 largest metros in the country have supplied enough new housing to keep pace with job growth in recent years. There is a strong correlation between the supply of new housing and rent growth, indicating that the lack of new construction is contributing to the affordability crisis in many parts of the country. The full report is available here.
Rents up year-over-year in 92 of 100 largest cities
In addition to the growth the national level, rents are now increasing in nearly all of the nations biggest markets - the map below show's year-over-year rent growth for the nation's 100 largest cities (markers are sized by population):
Note that 92 of the nation's 100 largest cities have experienced positive year-over-year growth, and 84 saw increases over the past month. Some individual markets are seeing substantial increases - 19 of the cities mapped above have logged year-over-year growth over 5%, up from 14 last month. The chart below shows how rents have changed over the past year for the five cities that experienced the fastest growth:
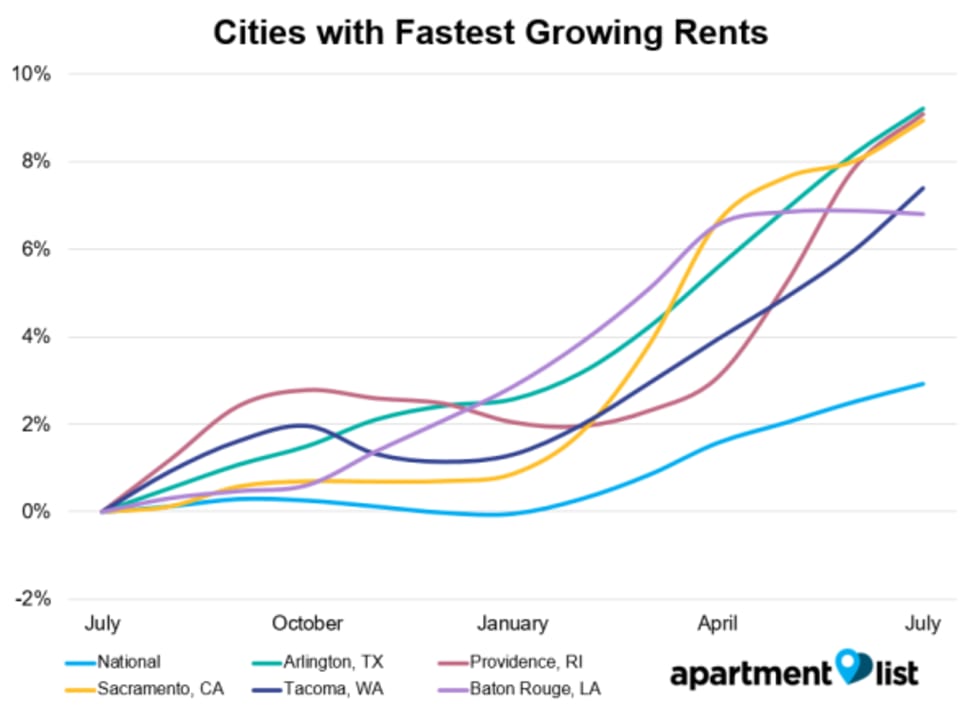
Arlington, TX continues to experience the fastest growth in the nation, with rents increasing 9.2% over the past year and 1.0% over just the past month. Providence, RI and Sacramento, CA have both also experienced year-over-year growth around 9%.
Tacoma, WA re-entered the list of fastest growing rents, with a 1.3% spike in rents over the past month, and 7.4% growth over the past year. Nearby Seattle saw rents increase 5.6% over the past year, while Vancouver, WA experienced a 6.6% increase. Washington state as whole logged an average increase of 5.5% since July 2016, second only to Rhode Island (+6.5%) at the state level.
Rents continue to fall in Houston and Miami
Despite the overwhelming trend of increasing prices, there are still a few places where rents are falling. Only 8 of the 100 largest cities have seen rents fall over the past year, but an additional 24 saw modest gains of less than 1.5%. The chart below shows trends for the five cities where rents declined most:
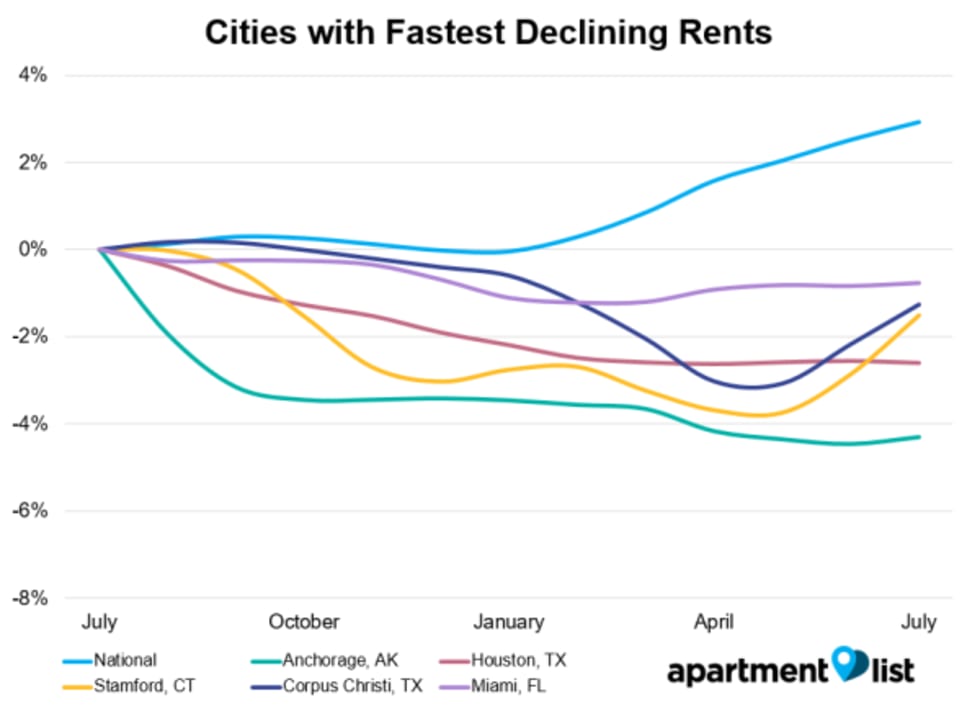
Anchorage continues to top this list, with rents declining by 4.3% over the past year; the median 2-bedroom there now goes for $1,090. Houston is the largest city in the country to see rents decline, with prices there down 2.6% year-over-year.
Miami is also continuing to see rents stagnate, however, this trend does not hold outside of the city-proper. Eight of the ten largest cities in the Miami metro have seen prices increase, and Florida as whole has seen average year-over-year rent growth of 3.1%, exceeding the national average.
Please see additional data below for the nation's 100 largest cities, or check out the full data for your city or county at our rental data page. And as always, feel free to contact us with any questions!
| City Name | Median 1 BR price | Median 2 BR price | M/M price change | Y/Y price change |
|---|---|---|---|---|
| San Francisco, CA | $2,430 | $3,060 | 0.6% | 0.0% |
| San Jose, CA | $2,060 | $2,580 | 0.5% | 2.0% |
| New York, NY | $2,090 | $2,490 | 0.3% | 1.2% |
| Boston, MA | $1,680 | $2,090 | 0.0% | 2.7% |
| Anaheim, CA | $1,590 | $2,050 | -0.1% | 4.9% |
| San Diego, CA | $1,550 | $2,010 | 0.7% | 4.1% |
| Stamford, CT | $1,510 | $1,910 | 1.4% | -1.5% |
| Jersey City, NJ | $1,590 | $1,900 | -0.5% | 1.8% |
| Santa Ana, CA | $1,420 | $1,830 | -0.2% | 6.2% |
| Los Angeles, CA | $1,340 | $1,730 | 0.5% | 4.8% |
Check out our rent reports for the following cities:
- Atlanta, GA
- Austin, TX
- Baltimore, MD
- Boston, MA
- Boulder, CO
- Charlotte, NC
- Chicago, IL
- Cleveland, OH
- Colorado Springs, CO
- Dallas, TX
- Denver, CO
- Detroit, MI
- Fort Collins, CO
- Fort Lauderdale, FL
- Houston, TX
- Indianapolis, IN
- Jacksonville, FL
- Los Angeles, CA
- Miami, FL
- Minneapolis, MN
- New York, NY
- Orlando, FL
- Phoenix, AZ
- Raleigh, NC
- San Antonio, TX
- San Diego, CA
- San Francisco, CA
- San Jose, CA
- Seattle, WA
- Tallahassee, FL
- Tampa, FL
- Tucson, AZ
- Washington, DC
If you would like to get future updates from Apartment List Rentonomics, please subscribe to our email list.
Methodology:
Apartment List Rent Report data is drawn monthly from the millions of listings on our site. 1-bedroom and 2-bedroom rents are calculated as the median for units available in the specified size and time period. Price changes are calculated using a “same unit” methodology similar to the Case-Shiller “repeat sales” home prices methodology, taking the average price change for units available across both time periods. For top city rankings, we calculated median 1-bedroom and 2-bedroom rents in 100 top cities and then ranked them by 2-bedroom rents.
About Apartment List Rent Reports:
Apartment List’s Rent Reports cover rental pricing data in major cities, their suburbs, and their neighborhoods. We provide valuable leading indicators of rental price trends, highlight data on top cities, and identify the key facts renters should know. As always, our goal is to provide price transparency to America’s 105 million renters to help them make the best possible decisions in choosing a place to call home. Apartment List publishes Rent Reports during the first calendar week of each month.
Share this Article
