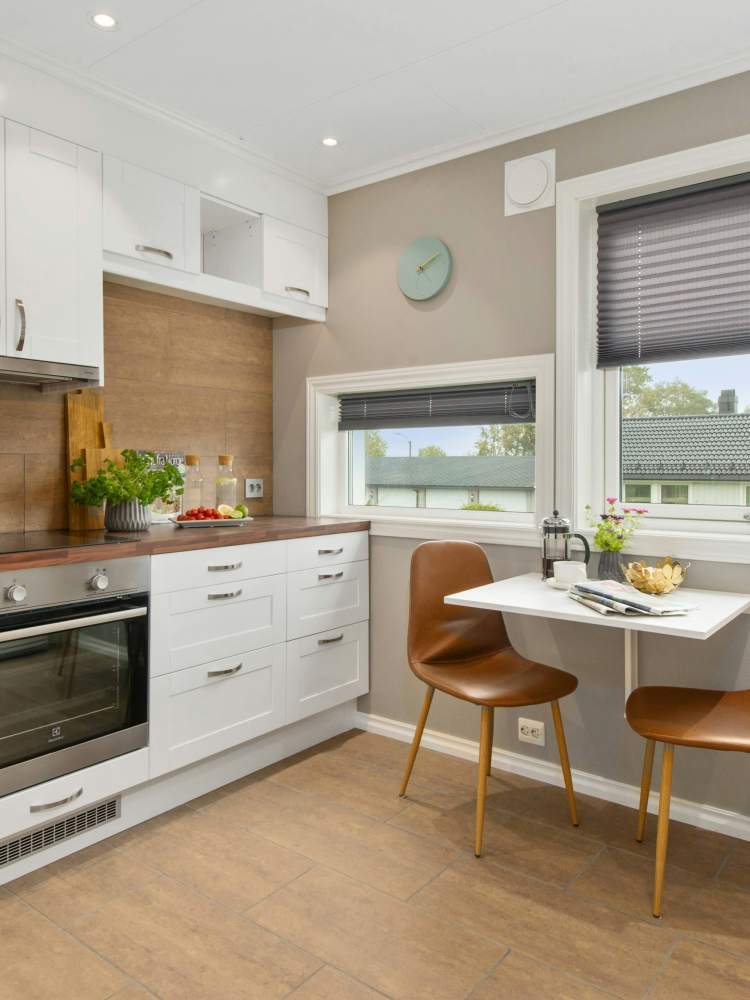
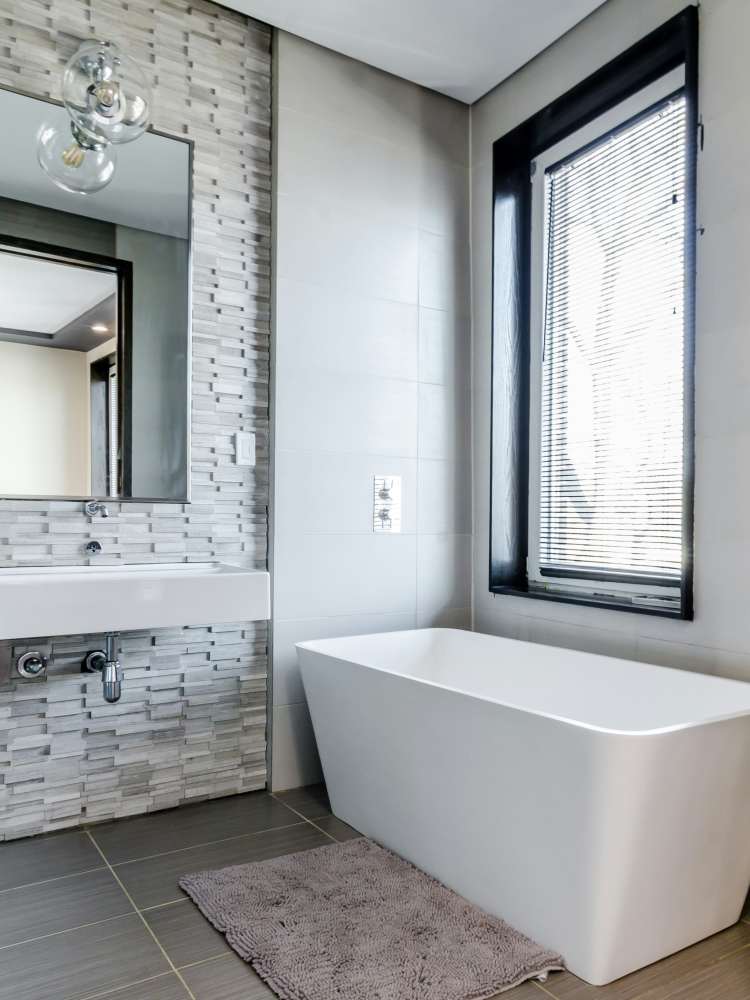
Solamonte Apartments
- 21 units available
- 1 bed • 2 bed • 3 bed
- Amenities
In unit laundry, Patio / balcony, Dishwasher, Pet friendly, 24hr maintenance, Parking + more
In unit laundry, Patio / balcony, Dishwasher, Pet friendly, Garage, 24hr gym + more
In unit laundry, Patio / balcony, Granite counters, Dishwasher, Pet friendly, 24hr maintenance + more
In unit laundry, Patio / balcony, Dishwasher, Pet friendly, 24hr maintenance, Garage + more
In unit laundry, Patio / balcony, Granite counters, Dishwasher, Pet friendly, 24hr maintenance + more
In unit laundry, Patio / balcony, Dishwasher, Pet friendly, 24hr maintenance, Garage + more
In unit laundry, Patio / balcony, Dishwasher, Pet friendly, 24hr maintenance, Carport + more
On-site laundry, Patio / balcony, Dishwasher, Pet friendly, 24hr maintenance, Garage + more
Patio / balcony, Dishwasher, Pet friendly, 24hr maintenance, Parking, Recently renovated + more
In unit laundry, Patio / balcony, Dishwasher, Pet friendly, 24hr maintenance, Garage + more
In unit laundry, Patio / balcony, Granite counters, Hardwood floors, Dishwasher, Pet friendly + more
In unit laundry, Patio / balcony, Hardwood floors, Dishwasher, Pet friendly, 24hr maintenance + more
In unit laundry, Putting green, Patio / balcony, Granite counters, Hardwood floors, Dishwasher + more
Patio / balcony, Dishwasher, Pet friendly, 24hr gym, Pool, Air conditioning + more
Searching for an apartment for rent in Rancho Cucamonga, CA? Look no further! Apartment List will help you find a perfect apartment near you. There are 100 available rental units listed on Apartment List in Rancho Cucamonga. Click on listings to see photos, floorplans, amenities, prices and availability, and much more!
The average rent in Rancho Cucamonga is $2,018 for a studio, $2,256 for a one-bedroom apartment, and $2,778 for a two-bedroom apartment. If you are looking for a deal, keep an eye out for a red pulsing icon that indicates rent specials.
Tired of browsing? Take our personalized quiz. You’ll answer a couple of simple questions and we’ll put together a list of Rancho Cucamonga apartments that are best for you. We’ll also factor in your commute, budget, and preferred amenities. Looking for a pet-friendly rental, or an apartment with in-unit washer and dryer? No problem, we’ll provide you with apartments that match that criteria.
You can trust Apartment List to help you find your next Rancho Cucamonga, CA apartment rental! After all, everyone deserves a home they love.
Welcome to the Apartment List October 2025 Rent Report for Rancho Cucamonga, CA. Currently, the overall median rent in the city stands at $2,098, roughly the same as last month. Prices are now down 1.6% year-over-year. Read on to learn more about what’s been happening in the Rancho Cucamonga rental market and how it compares to trends throughout the broader Riverside metro area and the nation as a whole.
The median rent in Rancho Cucamonga fell by 0.5% over the course of September, and has now decreased by a total of 1.6% over the past 12 months. Rancho Cucamonga’s rent growth over the past year has has fallen behind the state average (1.3%) and is similar to the national average (-0.8%).
Nine months into the year, rents in Rancho Cucamonga have risen 0.9%. This is a slower rate of growth compared to what the city was experiencing at this point last year: from January to September 2024 rents had increased 2.0%.
If we expand our view to the wider Riverside metro area, the median rent is $1,844 meaning that the median price in Rancho Cucamonga ($2,098) is 13.8% greater than the price across the metro as a whole. Metro-wide annual rent growth stands at -1.2%, above the rate of rent growth within just the city.
The table below shows the latest rent stats for 13 cities in the Riverside metro area that are included in our database. Among them, Chino Hills is currently the most expensive, with a median rent of $2,879. Victorville is the metro’s most affordable city, with a median rent of $1,568. The metro's fastest annual rent growth is occurring in Riverside (0.4%) while the slowest is in Temecula (-3.6%).
You can also use the map below to explore the latest rent trends in the Riverside metropolitan area.
Apartment List is committed to the accuracy and transparency of our rent estimates. We begin with reliable median rent statistics from the Census Bureau, then extrapolate them forward to the current month using a growth rate calculated from our listing data. In doing so, we use a same-unit analysis similar to Case-Shiller’s approach, capturing apartment transactions over time to provide an accurate picture of rent growth in cities across the country. Our approach corrects for the sample bias inherent in other private sources, producing results that are much closer to statistics published by the Census Bureau and HUD. For more details, please see the Apartment List Rent Estimate Methodology.
Apartment List publishes monthly rent reports and underlying data for hundreds of cities across the nation, as well as data aggregated for counties, metros, and states. These data are intended to be a source of reliable information that help renters and policymakers make sound decisions. Insights from our data are covered regularly by journalists across the country. To access the data yourself, please visit our Data Downloads Page.
Welcome to the Apartment List October 2025 Rent Report for Rancho Cucamonga, CA. Currently, the overall median rent in the city stands at $2,098, roughly the same as last month. Prices are now down 1.6% year-over-year. Read on to learn more about what’s been happening in the Rancho Cucamonga rental market and how it compares to trends throughout the broader Riverside metro area and the nation as a whole.
First thing’s first: Rancho Cucamonga, despite what those unfamiliar with California’s Inland Empire may assume, is not the name of a dish at your favorite Mexican restaurant (so don’t show up at Vista Grande and order one with a side of queso!). Rather, Rancho Cucamonga is the name of an ultra-picturesque San Bernardino suburb nestled at the foot of the majestic San Gabriel Mountains. An increasingly popular living locale, the city also boasts a variety of rental options for apartment hunters like you. Interested in joining the legion of leasers who called “the Ranch” home? Well, why else would you be here? Read on, and we’ll help you find the domicile of your dreams in a heartbeat …
Night owls will find a smattering of hotspots throughout the area, including chic martini bars, nightclubs, hops-heavy sports bars, and a dueling piano venue
View Rancho Cucamonga City GuideFirst thing’s first: Rancho Cucamonga, despite what those unfamiliar with California’s Inland Empire may assume, is not the name of a dish at your favorite Mexican restaurant (so don’t show up at Vista Grande and order one with a side of queso!). Rather, Rancho Cucamonga is the name of an ultra-picturesque San Bernardino suburb nestled at the foot of the majestic San Gabriel Mountains. An increasingly popular living locale, the city also boasts a variety of rental options for apartment hunters like you. Interested in joining the legion of leasers who called “the Ranch” home? Well, why else would you be here? Read on, and we’ll help you find the domicile of your dreams in a heartbeat …
Night owls will find a smattering of hotspots throughout the area, including chic martini bars, nightclubs, hops-heavy sports bars, and a dueling piano venue
The representation of ethnic minorities in Rancho Cucamonga is higher than the national average. The eight main ethnic groups that make up the population of Rancho Cucamonga are Hispanic Or Latino (36.6%), White (33.2%), Asian (14.8%), Black Or African American (10.3%), Two Or More (3.8%), Other (0.9%), American Indian Or Alaska Native (0.3%), and Native Hawaiian Or Other Pacific Islander (0.2%).
Apartment List has released the results for Rancho Cucamonga from the third annual Apartment List Renter Satisfaction Survey. This survey, which drew on responses from over 45,000 renters nationwide, provides insight on what states and cities must do to meet the needs of the country’s 111 million renters.