


1 of 55
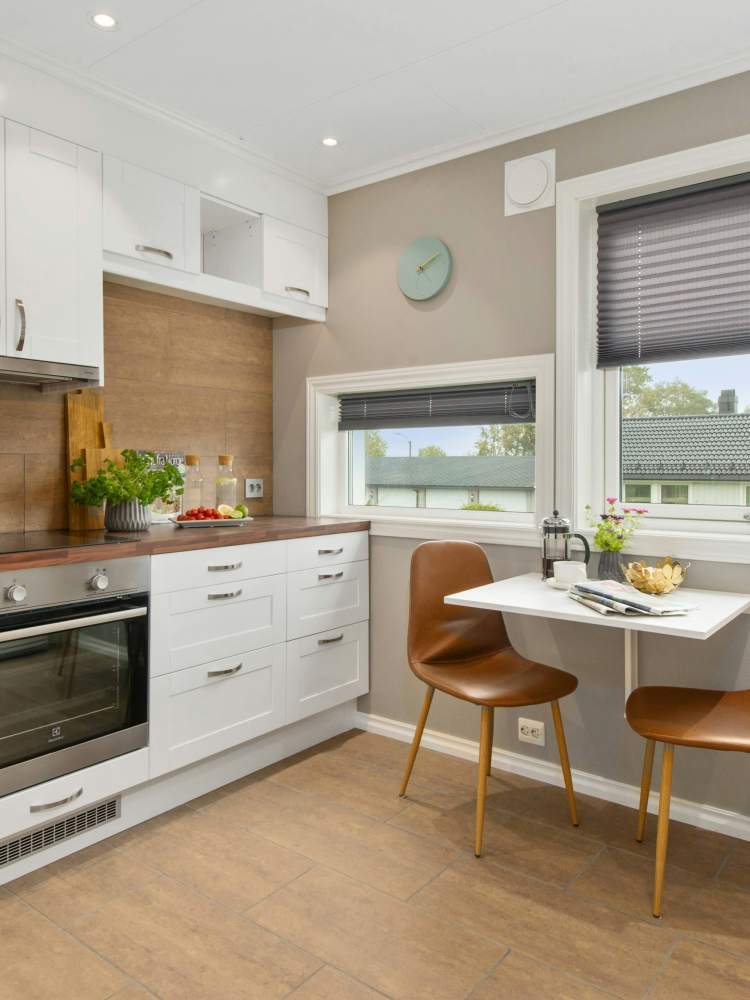
$3,140
32400 Crown Valley Parkway, Dana Point, CA 92629(949) 304-5509- 21 units available
- 1 bed • 2 bed
- Amenities
In unit laundry, Patio / balcony, Hardwood floors, Dishwasher, Pet friendly, 24hr maintenance + more
Verified listing
Verified

1 of 55
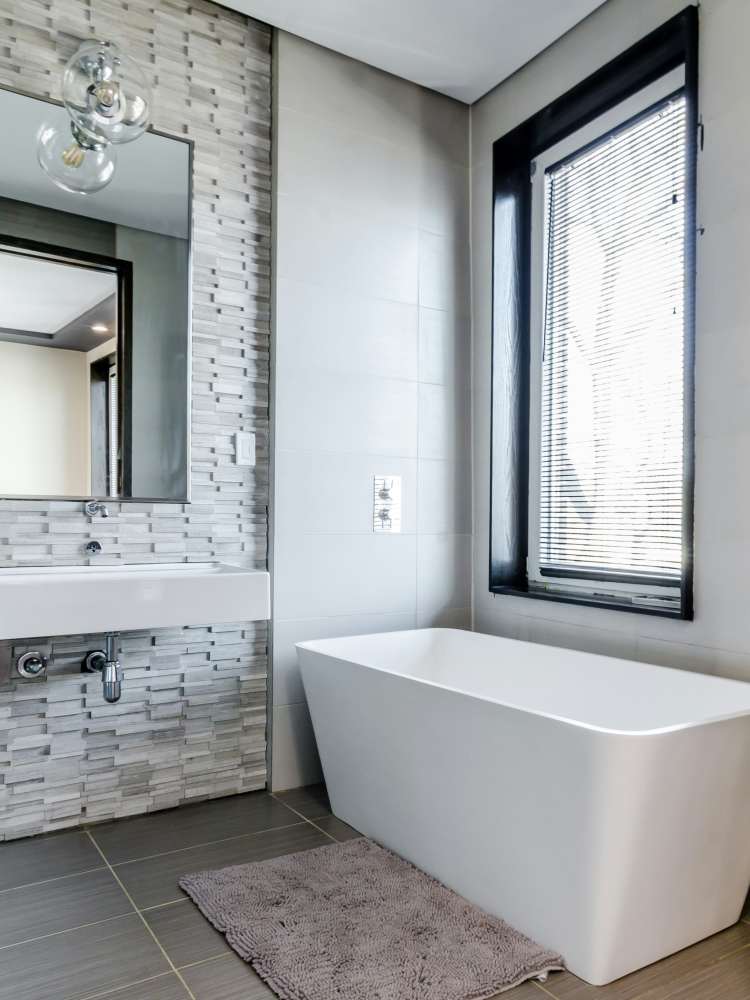
In unit laundry, Patio / balcony, Hardwood floors, Dishwasher, Pet friendly, 24hr maintenance + more

1 of 45
In unit laundry, Patio / balcony, Hardwood floors, Dishwasher, Pet friendly, 24hr maintenance + more
In unit laundry, Patio / balcony, Dishwasher, Garage, Recently renovated, Stainless steel + more
In unit laundry, Patio / balcony, Pet friendly, Parking, Recently renovated, and Walk in closets
In unit laundry and Refrigerator
In unit laundry, Garage, Pool, Guest parking, Courtyard, and Carpet
In unit laundry, Patio / balcony, Pet friendly, Parking, Pool, Basketball court + more
In unit laundry, Patio / balcony, Garage, Recently renovated, Stainless steel, Walk in closets + more
In unit laundry, Patio / balcony, Dishwasher, Dogs allowed, Garage, Walk in closets + more
In unit laundry, Patio / balcony, Granite counters, Dishwasher, Carport, Recently renovated + more
In unit laundry, Patio / balcony, Garage, Walk in closets, Pool, Air conditioning + more
In unit laundry, Dishwasher, Dogs allowed, Garage, Business center, and Some paid utils
In 1990, a 16-foot megamouth shark, one of only a large handful ever captured, was caught and tagged in Dana Point. But relax and go for a swim. They eat plankton, not people.
Known for some of the best waves in the nation, Dana Point serves as the home base for many of the first surfing companies, publications, and films


