Pandemic Rent Growth Has Been Faster in Lower-Cost Cities
Since 2020, rent growth in the United States can be broken into two phases. The first started with the COVID-19 pandemic in March 2020 and lasted roughly one year. During this time, expensive cities - particularly denser metropolitan ones - experienced a surge in vacant apartments and a sustained drop in rent prices. Meanwhile, in cheaper and more-suburban cities, rent drops were short-lived and price growth accelerated within months. We witnessed a steady price convergence, as expensive cities got cheaper and cheaper cities got more expensive. For example, from March 2020 to March 2021, rents decreased 18 percent in New York City but increased 6 percent in Tampa.
During the second phase, spanning early-2021 and continuing to this day, rent prices have soared in virtually every corner of the country. 2021 saw the sharpest increases, and year-over-year rent growth peaked at nearly 18 percent. Rent inflation has tempered a bit in 2022, but in most places rents continue to rise faster than they did before the pandemic. And it is happening everywhere: in cities small or large, dense or sprawling, pricey or affordable. Rental markets in New York and Florida are no longer behaving oppositely; from March 2021 to March 2022, rents increased 32 percent in New York City and increased 30 percent in Tampa.
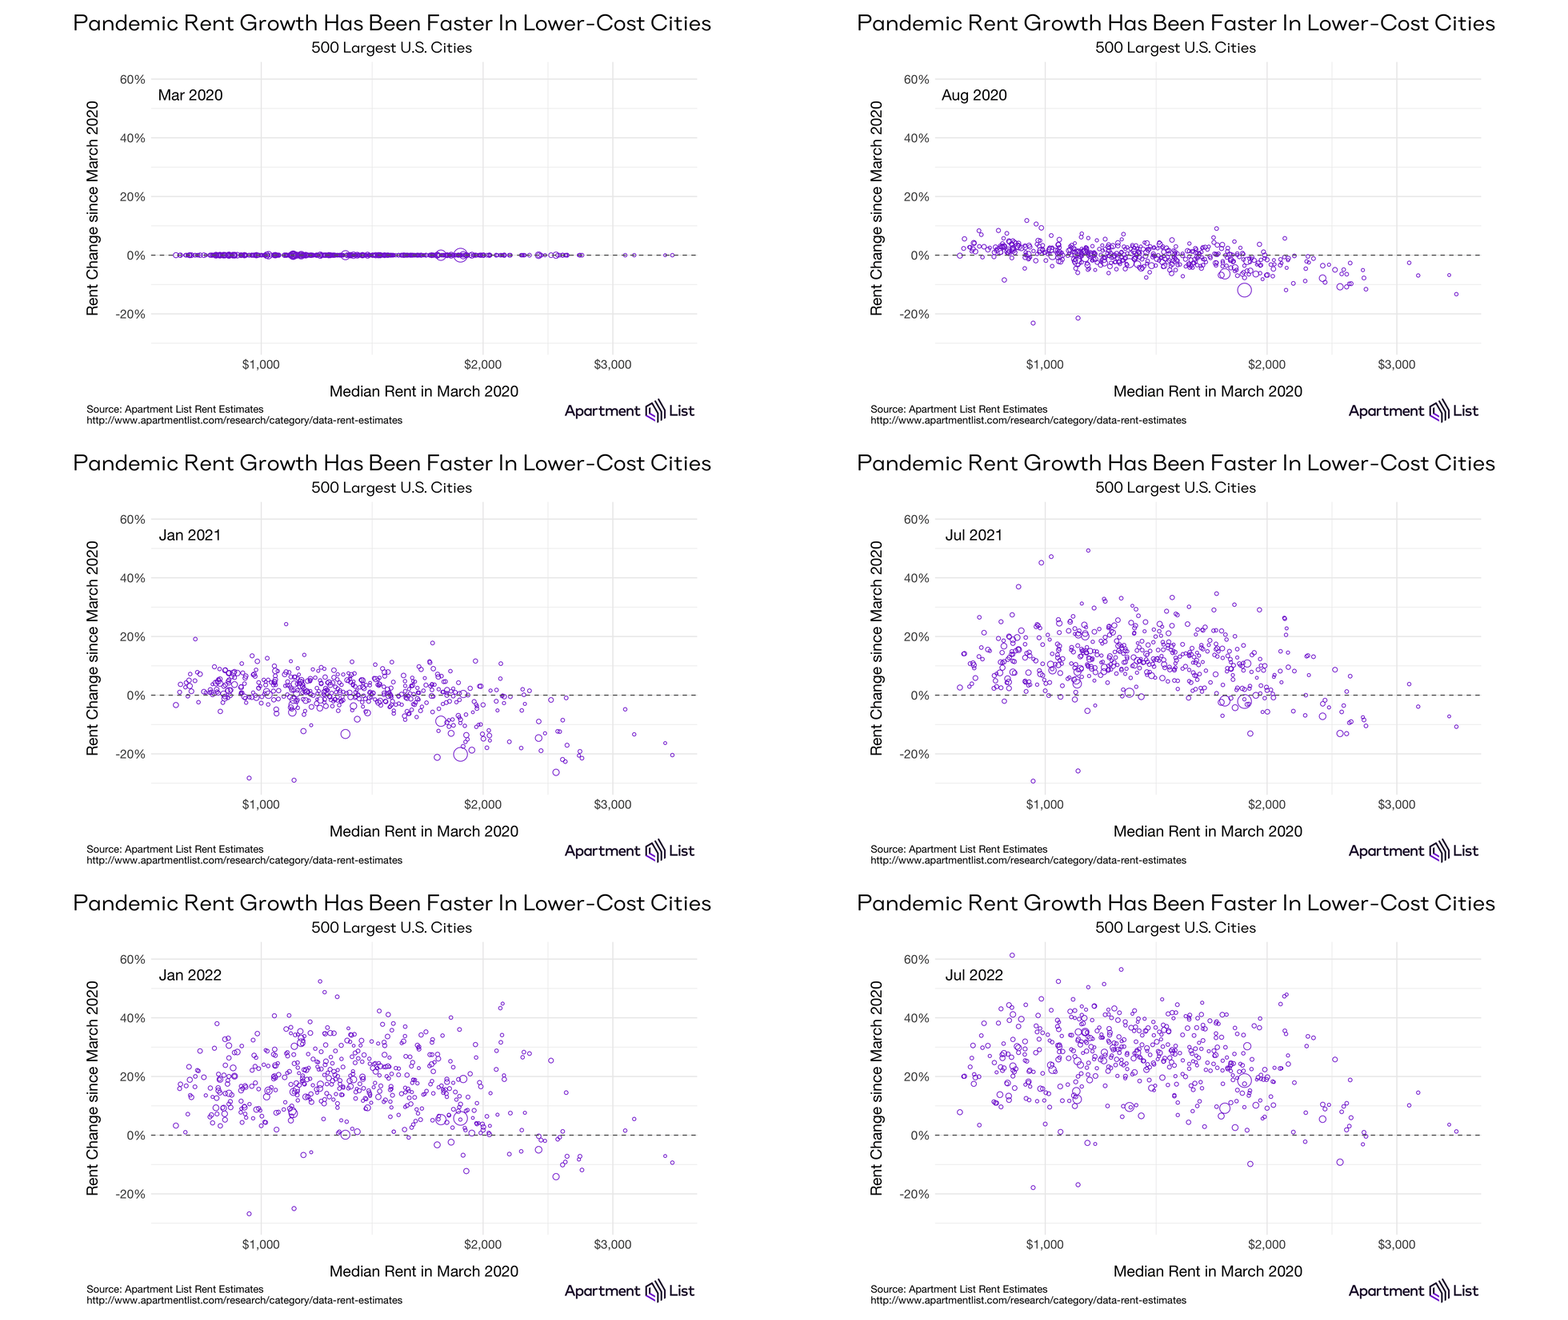
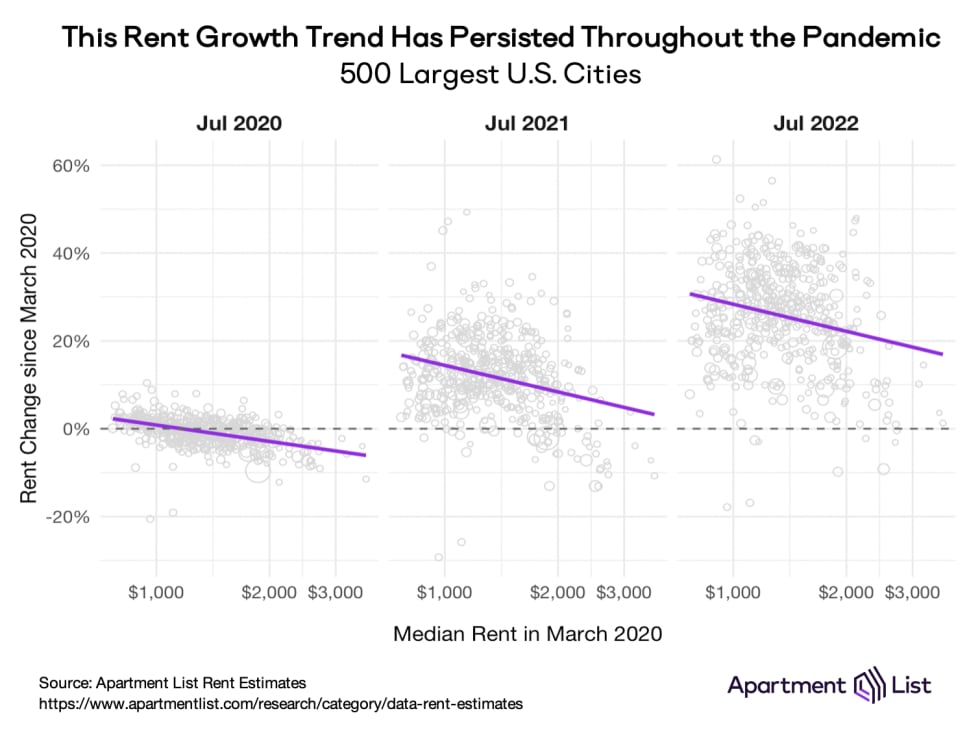
The animation above contains one dot for each of the 500 largest cities in our database, plotted left-to-right according to their pre-pandemic median rents. Cheaper cities are on the left, and more-expensive cities are on the right. As the animation moves forward in time, the vertical movement of each dot indicates how much (and how quickly) each city’s rent has changed over the past two years. A downward sloping trend emerged early in the pandemic, as rent growth was concentrated in the nation’s more affordable cities. That trend has persisted over the past two years, even as rent growth has swept across the nation.
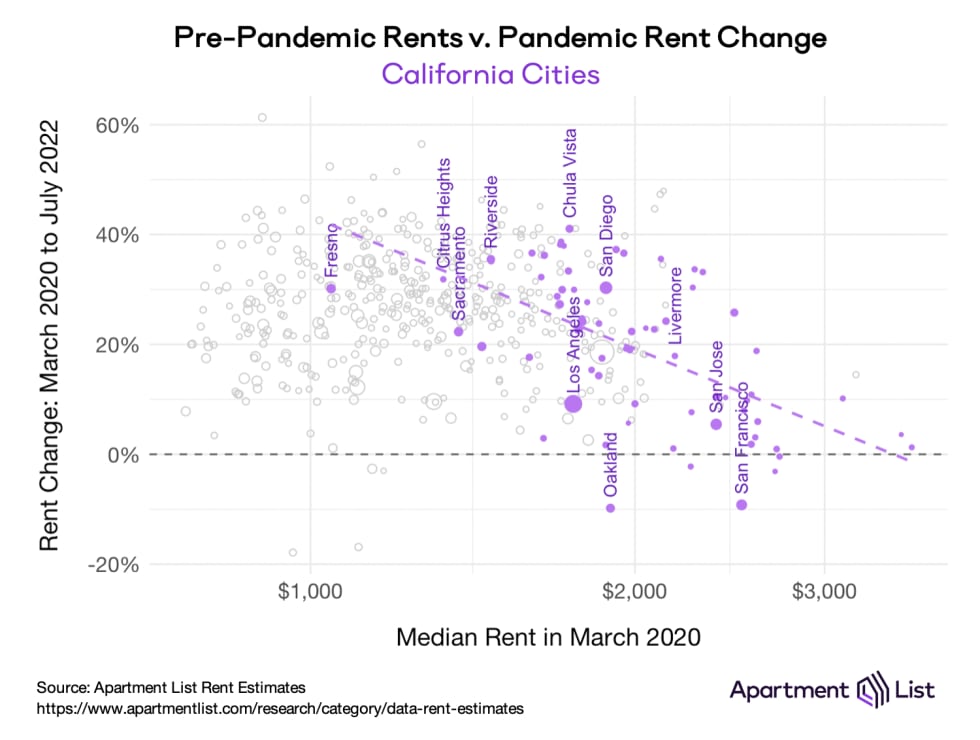
Unsurprisingly, the trend is strongest in states with large price gaps between the expensive and affordable ends of the rental market. California, home to pricey coastal cities as well as vast suburban zones, serves as a great example. Below, we highlight California cities in purple and isolate just the final frame of the animation, showing rent growth from March 2020 to July 2022. The three largest cities within the expensive Bay Area – San Francisco, Oakland, and San Jose – sit towards the bottom-right, while large, lower-cost inland cities like Fresno, Sacramento, and Riverside sit towards the upper-left.
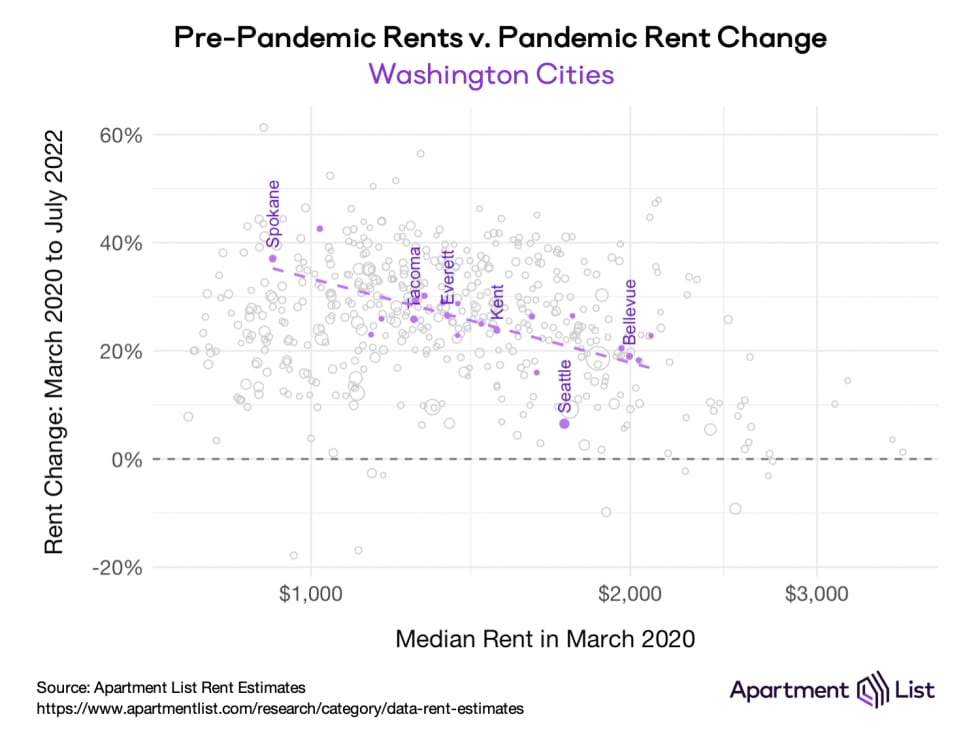
Washington shows a similar, albeit less dramatic trend. Rent growth has been slowest in Seattle and its closest suburbs, but it accelerates as you move outward into other, more-affordable parts of the state. Near the eastern border with Idaho, pandemic rent growth has reached up to 40 percent in the cities of Spokane and Spokane Valley.
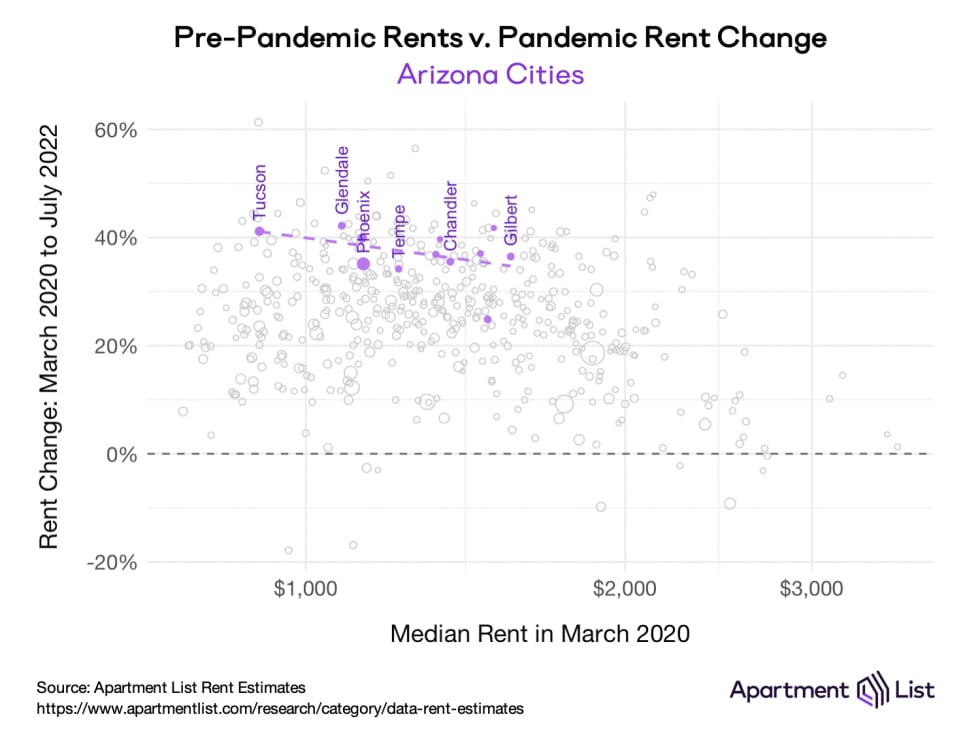
The trend begins to break as we move into the Sun Belt, where a rapid influx of new residents has burdened virtually every city with high rent inflation, regardless of how expensive they were before the pandemic. In Arizona, every city but Scottsdale has seen rent prices rise by more than 30 percent. Tucson and Gilbert were the cheapest and priciest Arizona cities as of March 2020, respectively. But since then, Tucson rents are up 41 percent and Gilbert rents are up 36 percent.
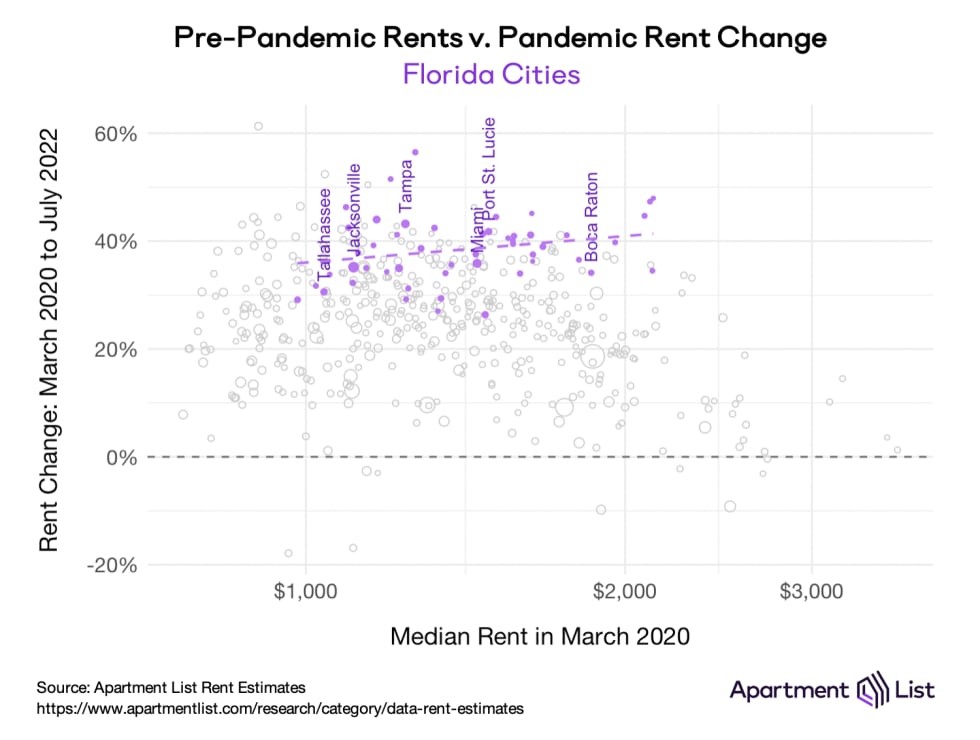
The trend actually reverses in Florida, the epicenter of pandemic-era rent inflation. Here, prices have risen slightly faster in the more-expensive parts of the state. Like in Arizona, most cities have seen rents go up by 30 percent or more, but Florida is home to many markets exceeding 40 or even 50 percent. Within Florida, the broad Tampa region has been growing the fastest. Since March 2020, rents are up 43 percent in Tampa proper, 44 percent in Clearwater and St. Petersburg, 46 percent in Largo, 51 percent in Bradenton, and 56 percent in Town ‘n’ Country.
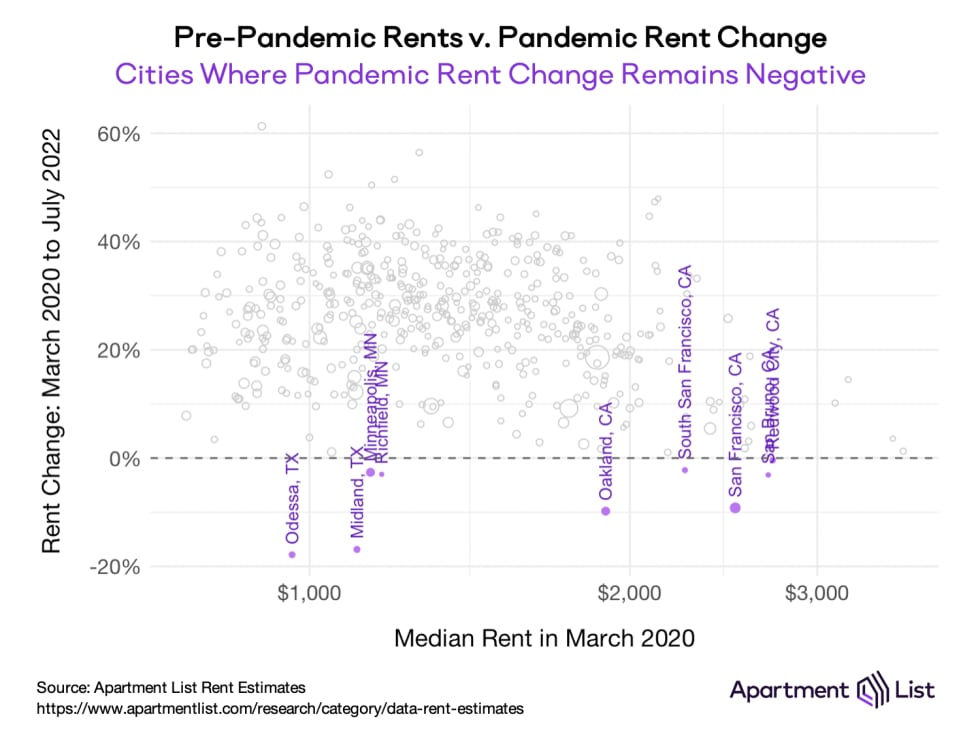
Today, there are only nine cities in our database where the median rent in July 2022 remains below its pre-pandemic level. Five are located in California’s Bay Area: Oakland (-9.8 percent), San Francisco (-9.2 percent), San Bruno (-3.1 percent), South San Francisco (-2.2 percent), and Redwood City (-0.4 percent). Two more are in Minnesota: Minneapolis (-2.6 percent) and its nearby suburb of Richfield (-3.0 percent). And the last two are oil towns in West Texas, where local economies have been roiled throughout the pandemic by a turbulent energy sector: Midland (-16.9 percent) and Odessa (-17.9 percent).
For a complete history of each city’s rent growth, please visit our Data Downloads page. We also publish updates and market commentary every month in our National Rent Report. If you have specific questions or data requests, you can also reach our team at research@apartmentlist.com.
Share this Article

