Rent Growth & Inflation Explainer

Introduction
Waning housing affordability and broad-based price increases throughout the economy have been among the most pressing issues of the past year. The Bureau of Labor Statistics’ Consumer Price Index (CPI) – the most commonly cited measure of inflation – was up by 8.6 percent year-over-year as of May, its fastest growth rate in 40 years. Over the same period, the Apartment List rent index spiked by 15.3 percent and for-sale home prices have been rising even faster. Housing costs are a major determinant of official inflation estimates, but the housing component of CPI is up by just 5.5 percent over the past year, far slower than the growth reported by our index for rentals or Case-Shiller on the for-sale side of the market. This has understandably caused some confusion among close followers of our data, but rest assured that there’s a perfectly reasonable explanation for the discrepancy, and the figures are not ultimately at odds to the degree that it may first appear. To help shed light on this topic, we’ve put together this explainer on how housing costs factor into CPI calculations, and what our rent index might tell us about where housing inflation is heading.
What is inflation and how do housing costs factor in?
Inflation refers to the rate at which prices for goods and services rise throughout the economy over time. The most commonly cited measure of inflation is the Consumer Price Index (CPI), which is estimated monthly by the Bureau of Labor Statistics (BLS).1 The CPI is calculated by tracking price changes across a fixed list of goods and services which are meant to be representative of the major categories of spending for the average household. The overall index is a weighted average of the price changes across these individual components. Given that rent or mortgage payments are the most significant monthly cost for most households, it is perhaps unsurprising that housing is, in fact, the single largest component of CPI, comprising roughly one-third of the overall index.
The “Shelter” component of CPI is itself comprised of subcomponents for rental housing and owner-occupied housing. Crucially though, the BLS methodology is based on market rents for both rentals and owner-occupied housing. For renters, BLS tracks changes in monthly rent payments, as one might expect. But for homeowners, rather than considering monthly mortgage payments, BLS relies on estimates of how much a home would be expected to rent for if it were to be put on the rental market – a concept referred to as Owner’s Equivalent Rent (OER). Because changes in market rent prices are the key determinant of both of these housing subindexes, the two measures tend to move roughly in tandem. This can be seen in the chart below, which plots year-over-year growth rates from 2018 to present for the two major housing components of CPI – Rent of Primary Residence and OER – along with the overall Shelter component and topline CPI for comparison.2
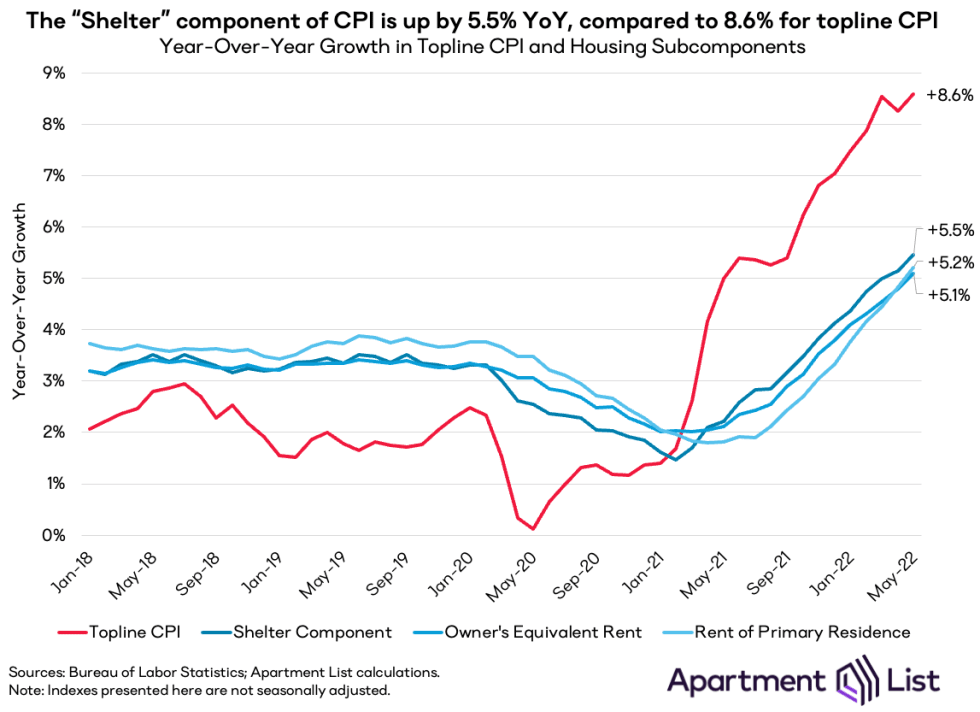
The CPI’s measures show that housing inflation has been running well above pre-pandemic trends. Year-over-year growth of the shelter component currently sits at 5.5 percent, after never rising above 3.5 percent in the two years preceding the pandemic. Rising inflation in the shelter component is certainly contributing to the rising inflation captured by topline CPI, but it is actually not the primary driver. In fact, topline CPI is currently up by 8.6 percent year-over-year, well above the rate of increase that we’re seeing in the shelter component. The rapid rise in topline CPI has been driven in large part by the more volatile energy and food components, which are up by 34.6 percent and 10.1 percent year-over-year, respectively.
But I thought housing costs were going through the roof?
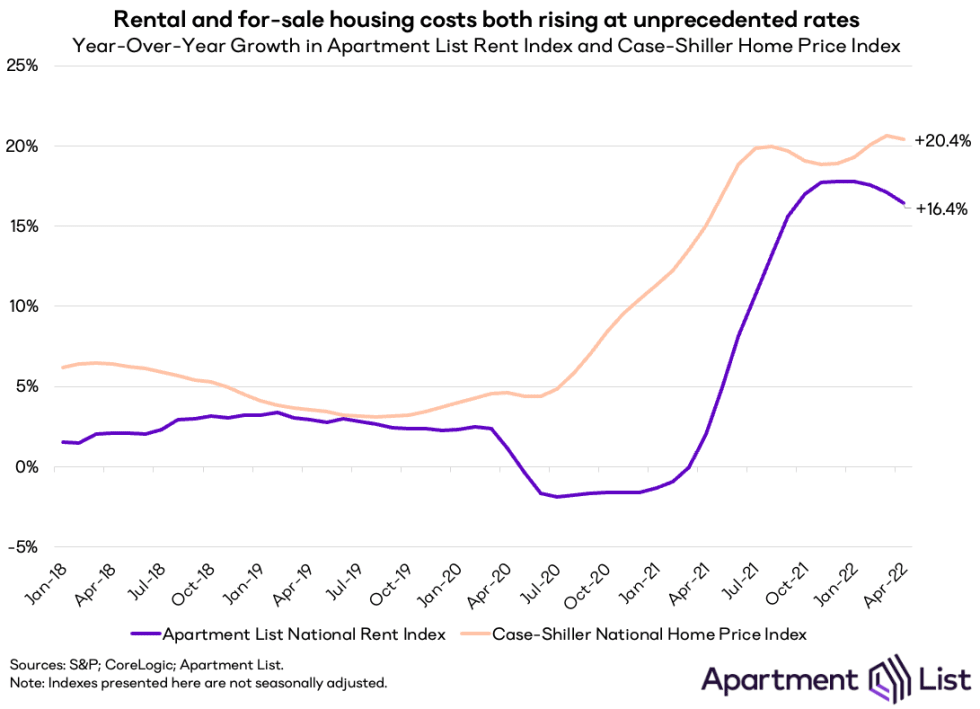
Close followers of our research and other housing market indicators may be surprised to hear that the shelter component of CPI is up by just 5.5 percent year-over-year. After all, our national rent index spiked by 15.3 percent from May 2021 to May 2022. And the situation has certainly not been any less turbulent on the for-sale side of the market – the Case-Shiller Index was up by 20.4 percent year-over-year as of the most recent release with data through April. Upcoming Case-Shiller releases are likely to show a rapid cooldown in the for-sale market in response to spiking mortgage rates, but as described above, sales prices are less relevant to how CPI measures housing inflation than market rents. That still leaves the question of why our rent index is reporting prices rising so much faster than the CPI measure.
The reason that the shelter component of CPI shows housing costs rising more modestly than our index is that the two measures are actually answering different questions. Crucially, our repeat-rent index tracks the change in rent prices for new leases, while the CPI measures the price change in market rents for all housing units. New leases always see the most significant price increases (or declines) in any given market, whereas renewal leases tend to see more modest rent adjustments. And more importantly, only a small fraction of households sign a new or renewal lease in any given month, while the large majority of households see no change in their housing costs. As a result, housing price changes will always appear more muted when considering all households rather than only those who signed new leases.
Our index is also more immediately responsive to changes in market rents, whereas the CPI measure reflects changes more gradually and with a bit of a lag. This too has an intuitive explanation related to the different methodologies of the two indices. Consider, for example, a month in which rent prices rise rapidly. Our index, which looks only at new leases, will register this rent spike immediately in the month in which it occurs. But when looking at all households, the impact is dampened by the fact that only a small share of households actually move in that month. However, as more households move and sign new leases in the ensuing months, they too are impacted by the price increase and their rent costs reset to the new market rates. In this way, the price increase continues to gradually filter into the CPI’s rent measure.
What can the Apartment List Rent Index tell us about inflation going forward?
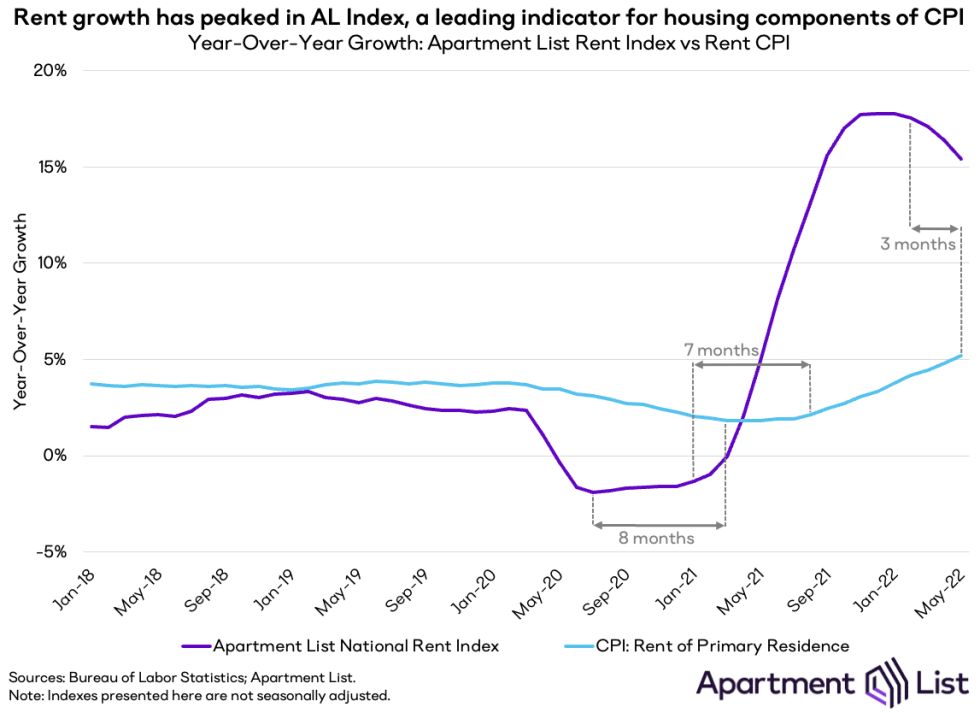
When the year-over-year changes in our rent index are plotted against those of the “Rent of Primary Residence” subcomponent of CPI, we can see clearly that the two follow similar trends, albeit with the CPI measure exhibiting the more muted and gradual trends described conceptually above. This can be seen most clearly by focusing on the pandemic era, which has seen the most dramatic price shifts. In 2020, our index recorded a modest dip in prices, with year-over-year growth bottoming out at -1.9 percent in July of 2020. The CPI’s rent measure also began to dip near the onset of the pandemic, but year-over-year growth bottomed out at 1.8 percent in March 2021 – eight months later than our index, and never approaching negative territory.
That dip was short lived, however, and 2021 brought with it skyrocketing growth in our index, with total rent growth last year coming in 17.5 percent, more than six times the average from the two years preceding the pandemic. We mark January 2021 as the inflection point for this shift in market dynamics as observed in our index, well before the CPI measure had hit its bottom. After remaining in that trough for a few months, the CPI rent measure also began to climb in August 2021, seven months after our index. It’s worth noting here that CoreLogic has observed a similar 9 to 12 month lag between their Single-Family Rent Index and the OER component of CPI, validating the idea that real-time housing indexes from private company listing data can serve as a leading indicator for the official CPI estimates.
As for 2022, our index has already been showing signs of the market cooling since the start of the year. Year-over-year growth in our rent index peaked at 17.8 percent this January and has since fallen to 14.1 percent as of June. Meanwhile, the rent component of CPI is still showing year-over-year growth on the rise. In fact, May brought the fastest month-over-month growth yet in the CPI rent index. This is consistent with the lag that we have observed in the prior inflection points noted above. Assuming a seven to eight month lag, we would expect that year-over-year growth in the rent CPI will begin to decline in the data for September or October. The exact duration of lag may not be so precise, but it’s likely that year-over-year growth in the rent CPI will continue to rise with the next few CPI releases, but should begin to fall before the end of this year. It’s possible that year-over-year growth in the rent CPI could break into the six to seven percent range, but we do not expect the growth rate of rent CPI to come close to the peaks observed in our index.
But even after the growth rate peaks, it may be some time before it comes back down to pre-pandemic levels. Our index has seen rent growth in the first half of 2021 coming in well behind last year’s pace, but still much faster than the growth we observed in the years preceding the pandemic. From January to June of this year, our index is up 5.4 percent, compared to 8.8 percent in the same months of last year, and 3.4 percent in 2019.
Conclusion
Because of the way that housing costs are measured by the BLS, the rent component of CPI reports rent growth that is significantly lower than what a renter looking to sign a new lease would actually face. This is not a bug, but a feature, as the rent CPI is meant to encompass all households, not just those who move in any given month. While rent growth has certainly been contributing to the elevated inflation rate reported by the CPI, the most significant drivers are actually energy and food prices. That said, it remains true that renters who are looking to move this year are facing significantly higher prices than they would have just one year ago, while those who are looking to purchase homes are also navigating a historically difficult time in the market. The collision of rapidly rising housing costs and broad-based price increases throughout the economy has made affordability an even more pressing concern over the past year, and while there are some signs of easing, they are likely to be gradual.
- Inflation is also measured by the Bureau of Economic Analysis (BEA) through their Personal Consumption Expenditures Index (PCE). CPI and PCE tend to move in tandem, but with some minor divergence in magnitude due to methodological differences, with CPI inflation generally coming in a bit higher than PCE.↩
- In addition to Rent of Primary Residence and OER, the Shelter index also includes a more volatile "Lodging Away From Home" component, which is why Shelter grows more slowly than both Rent of Primary Residence and OER for much of 2020.↩
Share this Article
