March Rent Report
Welcome to the March 2017 National Apartment List Rent Report! This month we saw a substantial increase in our national rent index; after months of subdued rent growth, this could be an indication that the market is picking back up.
Despite the overall increase, rent growth varies substantially by region, and many of the nation's most expensive cities are still experiencing below average growth. Read on for a more detailed analysis of the trends we're seeing this month
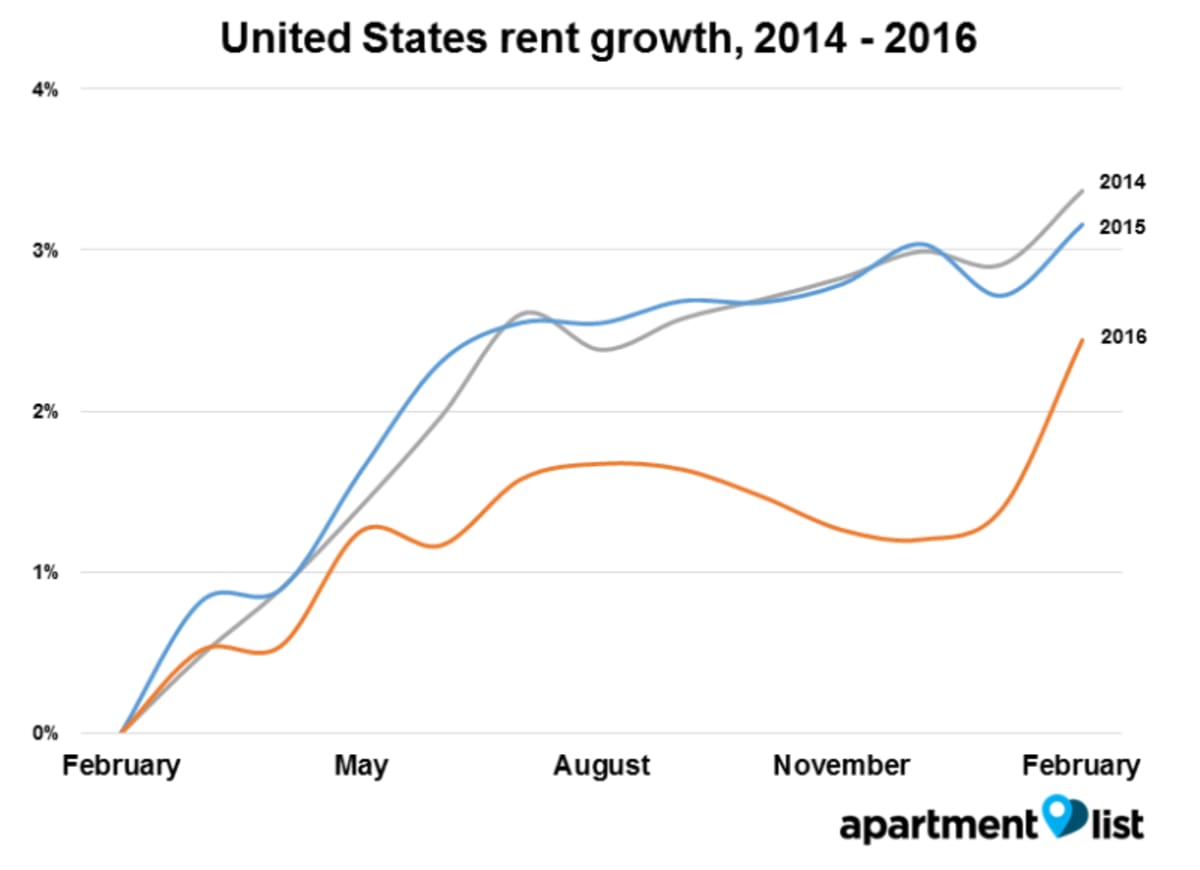
National index jumped sharply this month
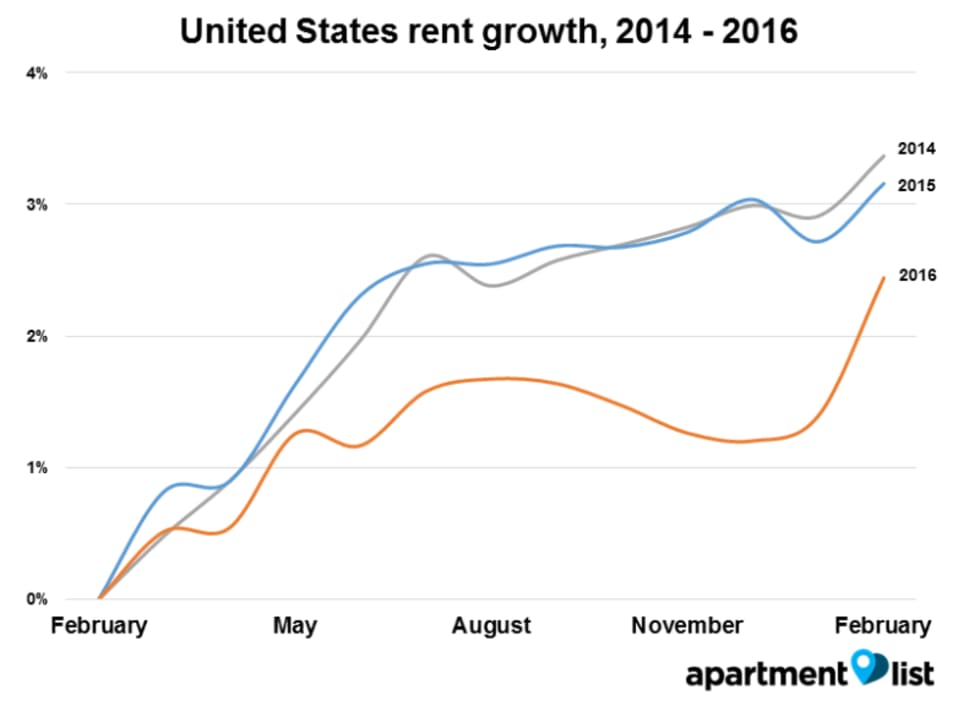
Our national index shows that rents this month were 2.4% higher than at the same point last year; a substantial portion of that increase is due to a sharp 1.0% increase month-over-month. This is the first significant rent increase we have seen in some time, as rents were essentially flat for the eight months prior.
Despite the surge, year-over-year rent growth is still trailing it's pace from 2015 and 2014, but it is beginning to catch up. In December of last year, the rate of rent growth was 1.8% lower than the prior year, but this month that gap has closed to 0.7%.
While seasonal rent growth at this time of year is expected, an increase of this size comes as a bit of a surprise. It remains to be seen if this month's growth is an aberration, or if the market is not actually cooling as much as expected.
California cities experience fastest month-over-month growth
Given the size of this month's rent increase nationally, we were interested to see how things broke down at a more granular level. The following table shows the top ten cities with the fastest month-over-month increases in rent:
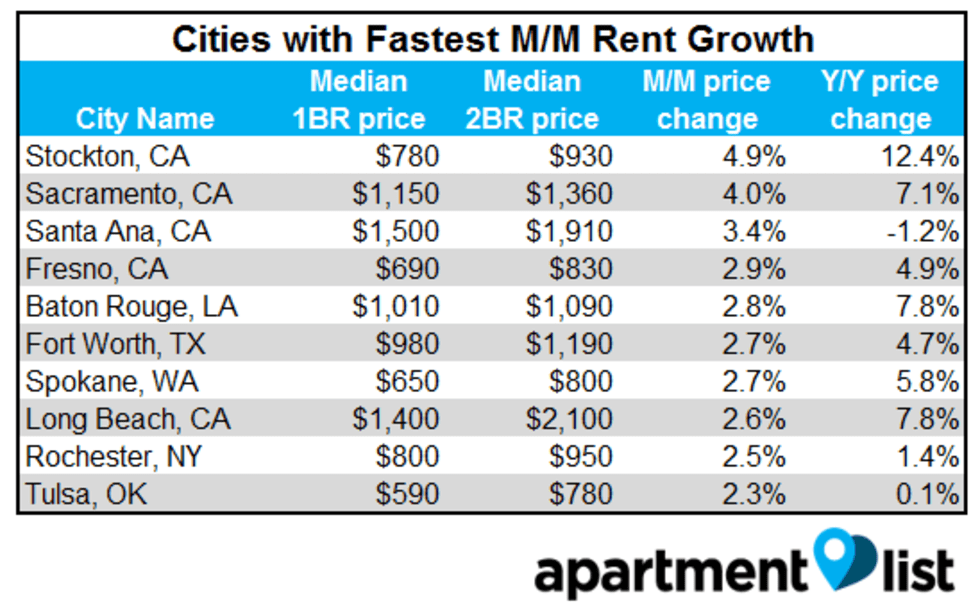
Note that California cities make up half of the top ten, and occupy all of the top four spots. Notably absent from the list are the Bay Area hubs of San Francisco and San Jose; as discussed below, these cities have seen rents leveling off and even declining in recent months, and it seems that California's affordability crisis is now beginning to extend out to its more affordable metros. The rest of the cities on this list are scattered across the country, but all have median rents below the national average of $1,250 - again, this seems to indicate that the biggest increases are happening in more affordable cities, which may have more room to tolerate the hikes.
The map below takes a higher level view, and looks at month-over-month growth aggregated by state:
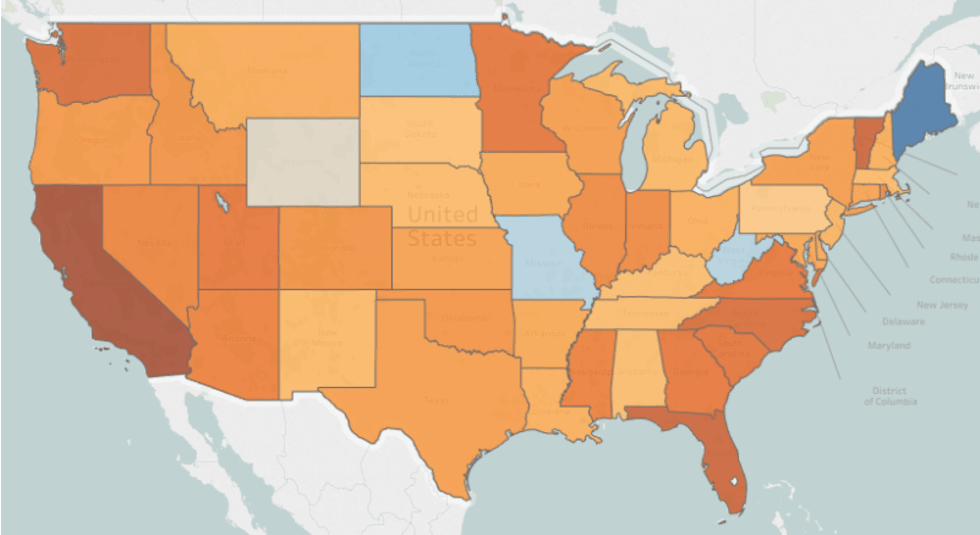
Given the city level data above, it's unsurprising that California tops the list at the state level as well, with 2.0% month-over-month growth. Generally, states in the West and South experienced the fastest growth, while rents in the Midwest and New England tended to remain more flat.
Rents still declining in four of the ten most expensive cities
As we've noted previously, many of the nation's hottest rental markets have shown signs of cooling in recent months. The chart below shows growth over the past year for five of the ten most expensive cities in the country:
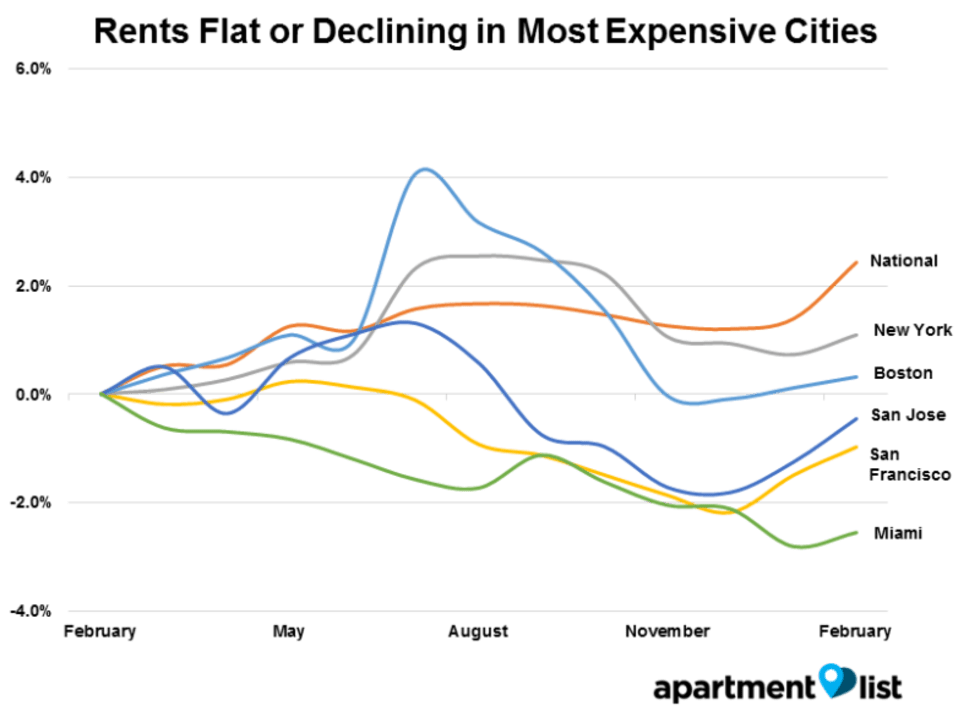
Note that even with recent increases over the past month or two, rents are still down year-over-year in San Francisco, Miami, and San Jose. Rents have been below their February 2016 level for the past six months in San Jose, the past 8 months in San Francisco, and the entirety of the past year in Miami. Rents are increasing in New York and Boston, but slowly - those cities have had year-over-year growth of 0.3% and 1.1%, respectively. Of the ten costliest cities, only Jersey City and Seattle have seen rents grow faster than the national average over the past year. Many of these cities seem to have reached a point where their markets cannot tolerate additional rent hikes, and with more new supply expected throughout the year, renters in these cities may finally be getting some much needed relief.
Please see additional data below for the nation's 100 largest cities, or check out the full data for your city or county at our rental data page. And as always, feel free to contact us with any questions!
| City Name | Median 1 BR price | Median 2 BR price | M/M price change | Y/Y price change |
|---|---|---|---|---|
| San Francisco, CA | $3,400 | $4,600 | 0.5% | -1.0% |
| New York, NY | $3,200 | $4,100 | 0.4% | 1.1% |
| Boston, MA | $2,800 | $3,400 | 0.2% | 0.3% |
| Washington, DC | $2,150 | $3,060 | 0.9% | 1.5% |
| Jersey City, NJ | $2,800 | 1.9% | 2.7% | |
| Los Angeles, CA | $1,920 | $2,700 | 2.0% | 2.4% |
| San Jose, CA | $2,220 | $2,690 | 0.8% | -0.5% |
| Stamford, CT | $1,970 | $2,530 | -0.9% | -3.1% |
| Miami, FL | $1,900 | $2,400 | 0.3% | -2.5% |
| Seattle, WA | $1,680 | $2,250 | 1.7% | 5.6% |
Check out our rent reports for the following cities:
- Atlanta, GA
- Austin, TX
- Baltimore, MD
- Boston, MA
- Boulder, CO
- Charlotte, NC
- Chicago, IL
- Cleveland, OH
- Colorado Springs, CO
- Dallas, TX
- Denver, CO
- Detroit, MI
- Fort Collins, CO
- Fort Lauderdale, FL
- Houston, TX
- Indianapolis, IN
- Jacksonville, FL
- Los Angeles, CA
- Miami, FL
- Minneapolis, MN
- New York, NY
- Orlando, FL
- Phoenix, AZ
- Raleigh, NC
- San Antonio, TX
- San Diego, CA
- San Francisco, CA
- San Jose, CA
- Seattle, WA
- Tallahassee, FL
- Tampa, FL
- Tucson, AZ
- Washington, DC
If you would like to get future updates from Apartment List Rentonomics, please subscribe to our email list.
Methodology:
Apartment List Rent Report data is drawn monthly from the millions of listings on our site. 1-bedroom and 2-bedroom rents are calculated as the median for units available in the specified size and time period. Price changes are calculated using a “same unit” methodology similar to the Case-Shiller “repeat sales” home prices methodology, taking the average price change for units available across both time periods. For top city rankings, we calculated median 1-bedroom and 2-bedroom rents in 100 top cities and then ranked them by 2-bedroom rents.
About Apartment List Rent Reports:
Apartment List’s Rent Reports cover rental pricing data in major cities, their suburbs, and their neighborhoods. We provide valuable leading indicators of rental price trends, highlight data on top cities, and identify the key facts renters should know. As always, our goal is to provide price transparency to America’s 105 million renters to help them make the best possible decisions in choosing a place to call home. Apartment List publishes Rent Reports during the first calendar week of each month.
Share this Article
