Where Did We Build Housing This Decade?

- New data from the Census Bureau shows how much each county’s housing stock expanded over the past decade. Nationally 9 million homes were built since 2010, growing the total market by 6.9 percent. But housing growth varies dramatically across different parts of the country.
- Metros in the Southern and Western United States added significantly more housing this decade than metros in the Midwest and Northeast. The states with the highest growth rates were North Dakota (+20 percent), Utah (+19 percent), and Texas (+15 percent).
- Few large metros built enough homes to keep up with economic growth. Using a heuristic of 1-2 new jobs for every new home, only 4 of the nation’s 25 largest metros met that threshold. The imbalance was greatest in Rust Belt cities (likely due to existing vacancies) and expensive coastal cities (which are notoriously supply-constrained).
- Many high-growth metros added homes by building out rather than building up. Construction was low this decade in high-density counties as well as sparsely-populated ones, whereas suburban counties on the peripheries of major cities saw rapid expansion.
Introduction
The last decade significantly shifted the urban geography of the United States. The longest economic expansion on record brought new opportunities and challenges, then came to a screeching pandemic halt in 2020. The growth was long-lived but uneven. New and existing innovation hubs and oil towns boomed, while some markets struggled to shake off sluggishness after the Great Recession. Throughout the 2010s, America’s housing growth both reflected and reinforced these trends.
In this report, we analyze housing supply growth across the United States to take stock of this changing landscape. According to recently-released data from the Census Bureau, the United States added over 9 million net new housing units from 2010 to 2020, expanding the nation’s housing inventory by 6.9 percent. Growth in new housing, however, varies dramatically by region. While some major markets are building enough to keep up with demand, many of the most sought-after metros are severely underbuilding.
North Dakota, Utah, and Texas lead the pack for new housing construction
The maps below show county- and state-level housing growth from 2010 to 2020.1 This decade, the three states that expanded their housing stock the fastest are:
- North Dakota (+20 percent): Rapid growth in North Dakota was driven by an oil boom in the earlier half of this decade, which brought thousands of new residents to a sparsely populated region, spurring demand for new housing. Western North Dakota is home to the nation’s two counties where housing inventory grew fastest, McKenzie (+125 percent) and Williams (+88 percent), while there are several other surrounding counties that grew faster than the national average.
- Utah (+19 percent): The Beehive State ranks second thanks to strong housing construction throughout the broad Salt Lake City region. Salt Lake County itself expanded its housing supply by 15.6 percent, yet still ranks 12th in the state. Even faster growth occurred in surrounding counties like Wasach (+40 percent), Utah (+30 percent), and Morgan (+27 percent). There is also a pocket of growth in the southwestern corner of the state, centered around the city of St. George; housing stock in Washington and Iron counties grew 35 and 17 percent, respectively.
- Texas (+15 percent): Texas expanded its housing inventory with rapid construction in the suburban areas surrounding its major metropolitan regions, a trend mirrored in other large markets. Dense pockets of growth can be seen around the Dallas and Houston metros, and along the corridor between Austin and San Antonio. The Texas county that saw the fastest growth this decade is Hays (+48 percent) just south of Austin.
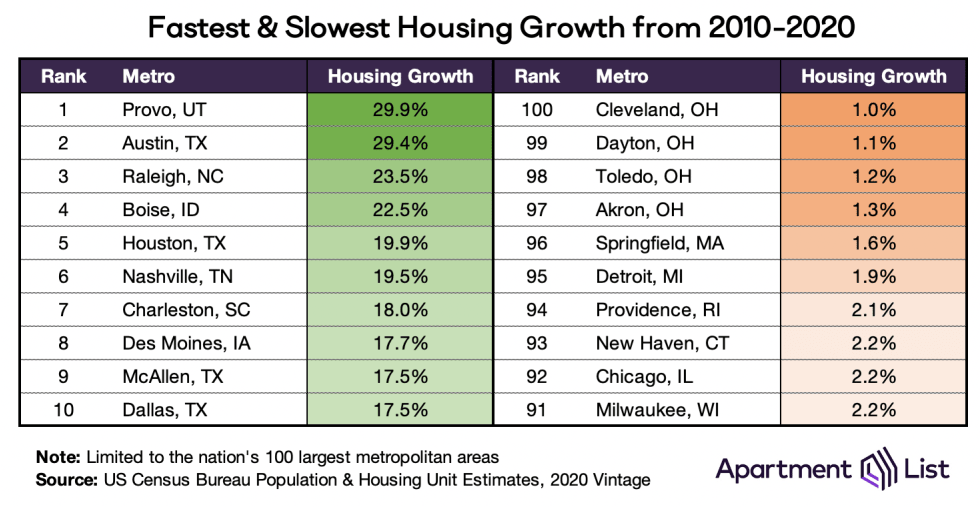
Rapid county-level growth is partially a reflection of how sparsely populated some parts of the country are. If we restrict our focus to just the 100 largest metropolitan areas, the Provo, UT metro boasts the quickest housing growth (+30 percent this decade). Four Texas metros can be found in the Top 10: Austin (+29 percent), Houston (+20 percent), McAllen (+18 percent), and Dallas (+18 percent). Raleigh and Nashville rank third and sixth, respectively, markets that emerged over the past decade as increasingly popular alternatives to established, expensive innovation hubs. Boise, where rent prices have been growing faster than anywhere else in the country, has also built homes quickly, growing its housing inventory by more than 22 percent over the past decade.
Click Here For Complete Metro-Level Data
Only 4 of the 25 largest metros built enough homes to match local job growth
We benchmark housing growth against local job growth to assess the degree to which new housing construction is keeping pace with demand. Job growth serves as a proxy for housing demand, because regions with growing economies will naturally attract new residents who need housing.2 If the supply of new homes cannot keep up with that influx, the homes that do exist will become prohibitively expensive, especially for lower-wage households. Therefore, to determine whether the nation’s growing housing markets are growing fast enough, we compare the new housing unit data from the Census Bureau with labor market data from the Bureau of Labor Statistics.3
Since many households include more than one working adult, a healthy, sustainable ratio of housing to job growth is one new housing unit for every 1-2 new jobs. A market that adds fewer homes may experience an undersupply of housing and a crunch on affordability, something we see playing out in many of the pricey coastal markets that have grown notoriously expensive over the past decade. In the map below, each circle’s size represents the size of the metro and its color represents its job growth-to-housing growth ratio. This decade, just four of the 25 largest metros in the nation achieved housing growth in line with job growth.
Click Here For Complete Metro-Level Data
When we zero in on the metros that have built the least new housing relative to jobs added (colored red in the map above), two distinct groups emerge. One is comprised of expensive, housing-constrained coastal markets: the San Francisco Bay Area (5.9 new jobs per new housing unit), various Southern California metros including Riverside (4.4) and Los Angeles (4.2), Miami (4.4), and New York City (4.2). These are metros that have become synonymous with the “affordability crisis” in part because they have added high-wage jobs much faster than they have added new housing.
The second group includes Rust Belt metros that dominate the list, occupying 7 of the top 10 spots. At the very top is the Detroit metro, where the number of jobs grew 18 percent this decade but the number of housing units grew just 2 percent. After Detroit comes a trio of Ohio metros: Dayton (7.2 jobs-per-unit), Toledo (7.0) and Cleveland (6.9) and further down the list are metros in Illinois, Michigan, and Pennsylvania.
But it would be inaccurate to say this second group is failing to build enough housing. The Rust Belt was hit particularly hard by the Great Recession, so at the start of the decade these metros had an excess of vacant housing. According to the Census Bureau’s Housing Vacancies and Homeownership Survey, in the first quarter of 2010 the rental vacancy rate in Detroit metro was 17.7 percent; in San Francisco metro it was just 6.5 percent.4 Since 2010, as jobs and workers have come back to these midwestern markets, there were abundant housing options waiting for them even in the absence of new construction.
On the other end of the spectrum, stretching across the Mountain West, Sun Belt, and South Atlantic are metros that have achieved a healthy jobs-to-homes ratio. This includes a handful of the nation’s largest metropolitan centers: Houston (1.2 new jobs per new home), Washington DC (1.7), and Dallas (1.8), as well as many smaller metros such as Tucson (1.1), Nashville (1.8), and all five of the largest cities in North Carolina.
Within many major metros, housing growth is concentrated in the suburbs
The new-jobs-to-new-homes ratio reveals which metros are building enough homes to account for economic growth. Looking closer at the counties that comprise each metro, on the other hand, reveals how they are doing it: by expanding into lower-density, suburban spaces.
Many big-city residents will tell you that over the past decade, new office towers and high-rise apartments have transformed their skyline. And it is true that since the Great Recession, dense multi-family has been the fastest-growing segment of housing construction. But in total dollar terms, it pales in comparison to the single-family homes being built at the peripheries of each growing metropolitan area.5 This is the construction that is fueling most of the housing market growth in metros across the Southern and Western United States.
Below, we plot housing growth since 2010 against baseline housing density in 2010; one dot for every county within the nation’s 100 latest metropolitan areas. The vertical lines split the distribution into three groups of equal size:
- In the densest third, housing inventory grew 6.8 percent. Construction levels are relatively low in counties that were already dense with housing. In these places, new construction faces a number of barriers including high construction costs, high land prices, restrictive zoning, and anti-growth opposition from some residents and politicians.
- In the least-dense third, housing inventory grew 6.9 percent. Construction levels are also low in counties where housing was sparse at the beginning of the decade. Even as metros expand outwards, these counties may still be too far from urban centers for new housing to attract much demand.
- The sweet spot is in the middle: suburban counties where housing inventory grew 11.3 percent this decade. These counties enjoy relative proximity to urban centers without many of the barriers that hinder development in dense cities.
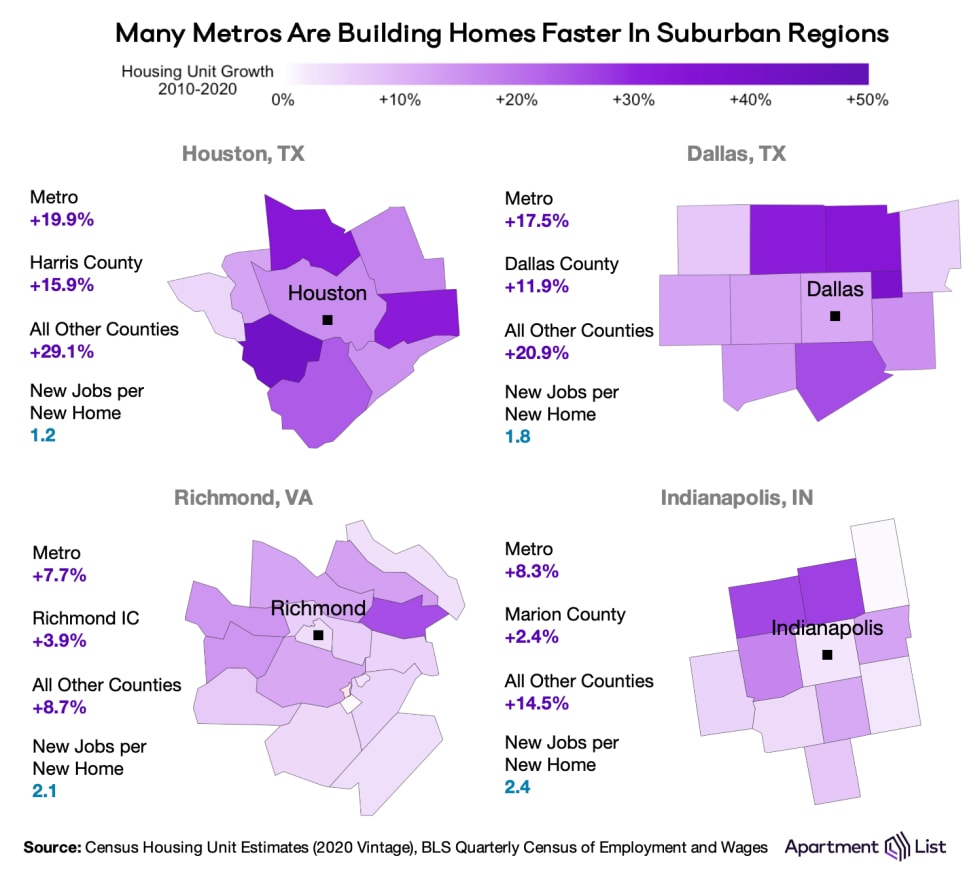
We see this suburban development in many of the nation’s fastest-growing metropolitan areas. The four examples below have healthy new-jobs-to-new-homes ratio at the metro level, but construction in outer counties took place roughly twice as fast as it did in central counties. In the case of Indianapolis metro, the housing growth rate in the 10 counties surrounding Indianapolis is over six times greater than in Indianapolis proper.
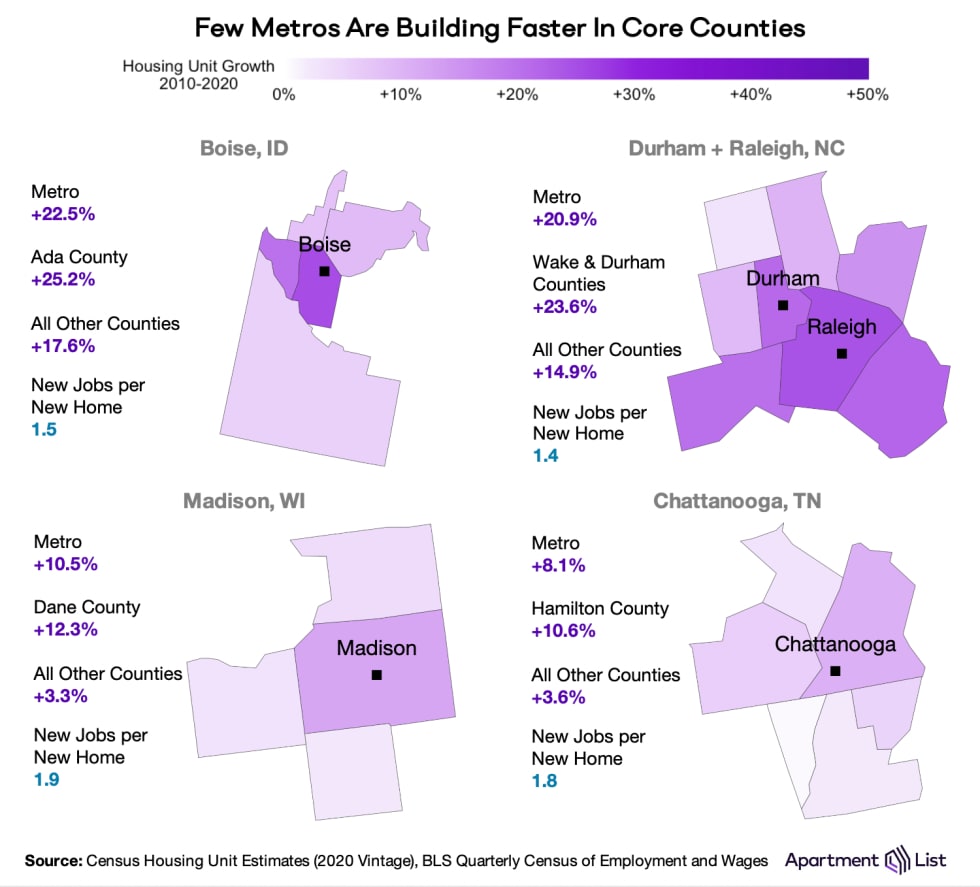
Examples of the opposite scenario - more development in the metro center, less in the peripheral regions - are more difficult to come by. These are typically smaller, lower-density metros where construction barriers are low even in the central county. Boise, Madison, Chattanooga, and North Carolina’s Research Triangle are such exceptions to the rule, growing rapidly in their cores over the past decade.
Among large metros, only ten have achieved rapid housing growth (more than double the national rate) in both central and peripheral regions. And with the exception of Des Moines, they are all in the Southern or Western United States. For much of the Midwest, and even more so the Northeast, new home construction was sluggish in all counties. Boston is the only northeastern metro to build faster than the national average in its central county (10.4%), while Harrisburg, PA, is the only one to do so in its peripheral counties.
Click Here For Complete Metro-Level Data
Conclusion
Over the past decade, the U.S. population grew quickly in the Mountain West and Sun Belt, where sufficient housing supply met successful job creation. Job-rich coastal markets were in high demand, but their housing growth could not keep pace with jobs, limiting their growth potential. In these regions, the resulting spatial mismatch between job growth and housing construction spurred a rise in both super-commuting and remote work.
As we look forward to the next ten years, we are certain they are initially going to be shaped by the pandemic recovery. With vaccination rates rising and businesses reopening, demand is once again surging in the cities where housing has been tight and undersupplied. The rise of remote work, however, could be a catalyst for change in the housing market. If the link between work and home location is increasingly broken, the lifestyle preferences of remote workers may start to dictate the next shift in housing demand. The early signs already show that the 2020s pandemic recovery will look very different from the 2010s Great Recession recovery, and the changing landscape of American housing will follow suit.
- The latest census data are available here: Population & Housing Units Estimates, Vintage 2020.↩
- The proliferation of remote work in a post-pandemic economy could impact this relationship. As remote workers severe the ties between where they live and where they work, housing growth could become less meaningful in the cities where remote-friendly companies are headquartered. For more on this, see our report: How Will Remote Work Impact Housing Preferences?↩
- Specifically, the BLS's Quarterly Census of Employment and Wages.↩
- See Tables 4a & 5a here: Quarterly Vacancy and Homeownership Rates by State and MSA↩
- In April 2021, single-family construction spending totalled $396 billion and multifamily construction spending totalled $98 billion. Source: US Census Bureau, Monthly Construction Spending Report.↩
Share this Article