The number of cost-burdened renter households has hit an all-time high

Intro
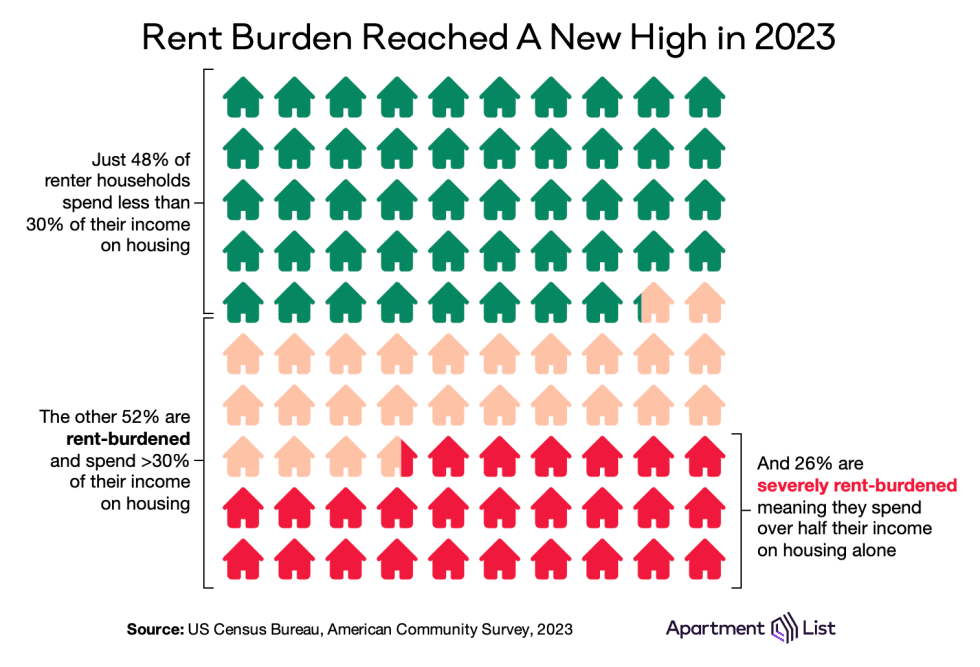
Broadly accepted financial wisdom dictates that a household should spend no more than 30 percent of its gross monthly income on housing costs. This rule of thumb is cited broadly – from personal finance blogs to government agencies. Unfortunately, the 30 percent threshold has proven elusive for a striking share of American renters – more than half spend above that level, qualifying them as “cost-burdened.” And more than one-in-four renter households spend over 50 percent of their income on rent, making them “severely cost-burdened.” In this report, we explore the latest data on this troubling indicator of the nation’s housing affordability crisis.
The number of cost-burdened renter households hits an all time high
As of 2023 – the most recent year of Census ACS data currently available – 22 million renter households are spending more than 30 percent of their income on rent. This represents an increase of 226 thousand compared to 2022, putting the number of rent-burdened households at an all-time high. That translates to 51.8 percent of all renter households in the U.S., virtually unchanged from last year. Of these, 11.2 million, or 26.4 percent of all renter households, are severely cost-burdened, spending more than half of their monthly gross income on rent.

The prevalence of rent burden has long been a significant issue, but data for recent years is especially troubling because it represents a reversal of modest progress that was made over the course of the 2010s. In the aftermath of the Great Financial Crisis, the renter cost burden rate hit a peak of 53.4 percent in 2011. But in the ensuing years, it gradually improved, eventually dipping to 48.4 percent in 2019.
However, this progress has since been reversed by the record-setting growth in rent prices that occurred in 2021 and 2022. Rent growth has since moderated, but the number of rent-burdened households is still on the rise. There are currently 2.1 million more cost-burdened renter households than there were in 2019. Even though the current rent burden rate is slightly lower than it was from 2010 to 2012, the number of renter households who are burdened by their housing costs has never been higher.
And in some ways, the cost burden rate could even be underestimating the degree to which housing affordability has worsened. A lack of affordability has deterred new household formation in recent years, as Americans are increasingly doubling up with family or roommates to save on housing costs. These individuals are struggling with housing affordability, but because they don’t represent their own households, they are not captured in cost burden statistics.
Additionally, as the affordability of for-sale housing has eroded even more rapidly than that of rentals, more prospective homebuyers are continuing to rent. This subset of renters who have been sidelined from the for-sale market tend to be higher-income, and their presence in the denominator of the renter cost-burden rate could be depressing that rate slightly.
Florida is the epicenter of the cost-burden crisis
Rent burden is a significant issue across the country, but its severity also varies meaningfully by geography. In general, markets across the Southern U.S. and along both coasts tend to have renter cost burden rates exceeding the national average. The nation’s coastal markets have long been among its most expensive, but an influx of renters to the Sun Belt has now also driven rapid cost burden increases in markets that were once affordable. Meanwhile the Midwest and Mountain West generally have cost burden rates below the national average, with markets in these regions serving as some of the last bastions of housing affordability.
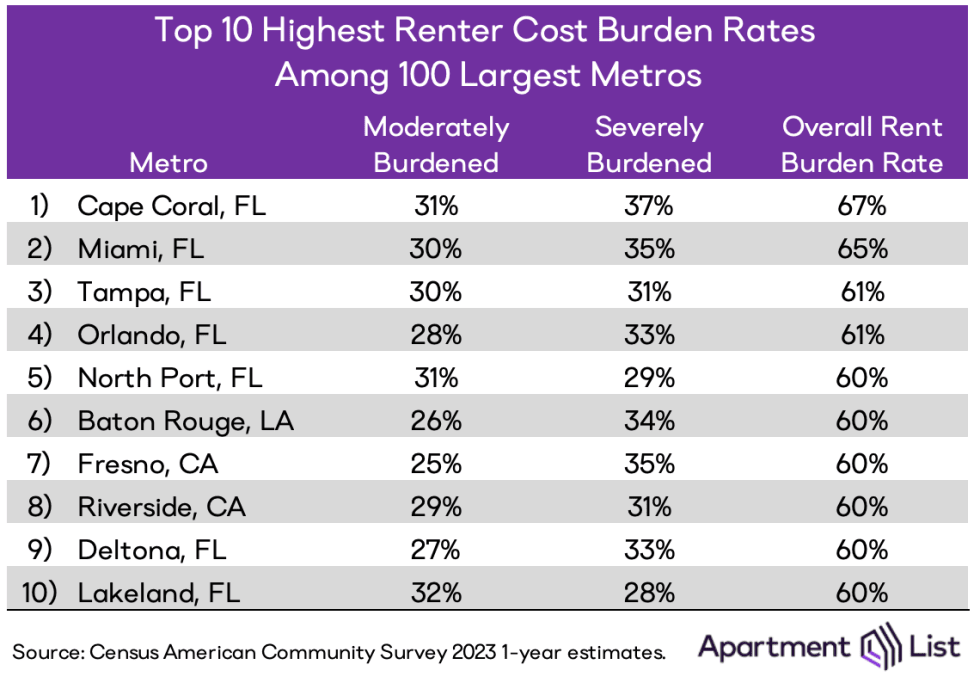
At the state level, the issue is most extreme in Florida, where 62 percent of renters are cost-burdened, and one-in-three renter households spend more than half of their income on rent. Among the metropolitan areas with the nation’s highest rates of rent burden, all of the top five and seven of the top ten are located in Florida. Cape Coral leads the way, with more than two-thirds of renters facing burdensome rental costs, followed by Miami (65%), Tampa (61%), Orlando (61%) and North Port (60%).
Two of the remaining metros with the worst cost-burden rates are located in California, but they not be the ones you would expect – Fresno and Riverside have relatively more affordable housing costs compared to California markets like San Francisco and Los Angeles, but that housing cost advantage is more than offset by lagging incomes in these areas.

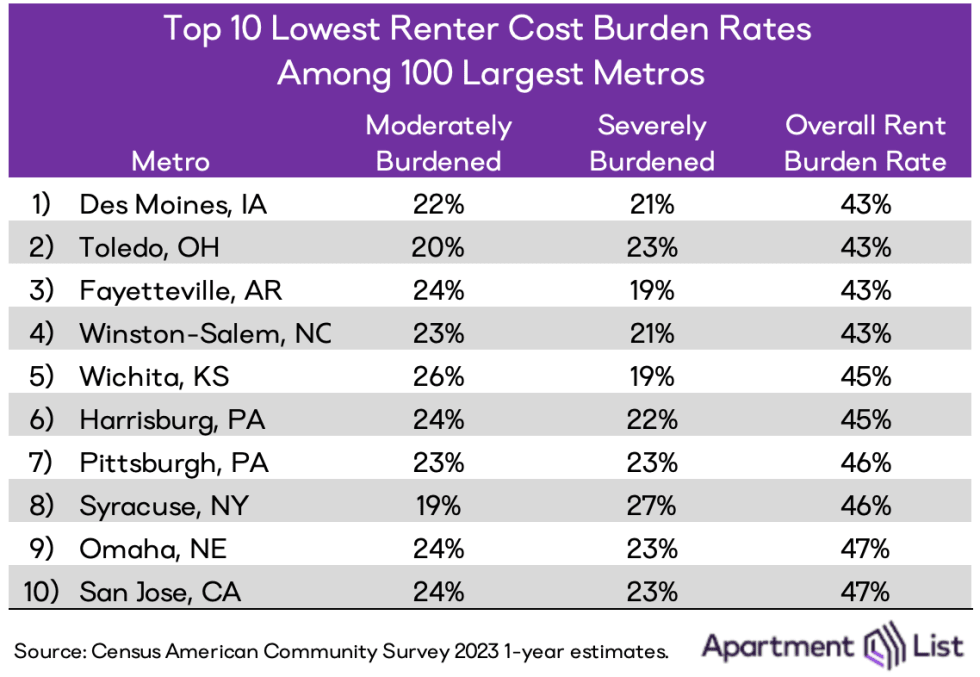
At the other end of the spectrum, Des Moines, IA has the nation’s lowest renter cost burden rate. But even here, 43 percent of renters struggle with excessive rent costs and more than one-in-five spend more than half of income on rent – housing affordability is a major issue even in the parts of the country that are performing best.
In general, the markets with the lowest cost-burden rates tend to be mid-sized and fairly affordable, away from the Sun Belt and coastal regions that have struggled to keep pace with rental demand. One notable exception is San Jose, CA, which has the nation’s 10th lowest renter cost burden rate despite having the highest metro-wide median rent among the 100 largest metros. This counter-intuitive combination of astronomical rents and below-average cost burden is attributable to the fact that the San Jose metro – home to Silicon Valley – also boasts some of the nation’s highest salaries. Meanwhile many of the region’s low-income residents have already been priced out to farther-flung inland markets. This example demonstrates another way in which cost burden rates – while an important and useful indicator – are not a comprehensive measure of housing affordability.

Renter cost burden rates have worsened virtually everywhere
As discussed above, the troubling prevalence of cost burden among American renters is compounded by the fact that the issue has worsened in recent years. That national trend is mirrored in just about every major housing market in the country. From 2019 to 2023, the renter cost burden rate increased in all of the nation’s 25 largest metros and in 92 of the 100 largest.
Among the 25 largest metros in the U.S., Tampa has experienced the most severe worsening of renter cost burden. In 2019, Tampa had the 6th highest rent burden rate at 52.6 percent; by 2023, Tampa’s rent burden rate had increased by 8.4 percentage points to 61 percent, placing it 2nd highest among the 25 largest metros. This worsening has been driven by skyrocketing rent prices – Tampa ranks first among the 25 largest metros for fastest rent growth from 2019 to 2023, with the median rent there up by a staggering 49 percent in total over those years.
Phoenix had the 2nd fastest increase in its renter cost burden rate, with an 8.2 percentage point jump from 46.6 percent in 2019 to 54.8 percent in 2023. The top five is rounded out by Dallas, Atlanta, and Charlotte. This list of markets testifies to how the exploding popularity of the Sun Belt in recent years has delivered a serious blow to the region’s affordability. Notably, most of these markets have actually been constructing new rental units at a relatively fast clip, but not fast enough to keep pace with demand.
Wage growth struggling to keep pace with rents
To understand cost burden, it is important to look not just at rent prices, but also at how they compare to incomes. The chart below plots metro level median rent growth from 2019 to 2023 against renter income growth over the same period (both in nominal terms). Each marker represents one of the nation’s 100 largest metros, sized by population, and shaded based on the change in the metro’s cost burden rate during those same years, with red indicating worsening cost burden and green signaling improvement. In metros sitting above the diagonal line, rents have grown faster than incomes in recent years, whereas in metros below the diagonal, incomes have grown faster than rents.
Since 2019, rents have grown faster than renter incomes in 82 of the nation’s 100 largest metros. The markets with the widest gaps are those that have seen the most extreme worsening of rent burden rates. Tampa is again a good example – the median renter income in the Tampa metro increased meaningfully by 33 percent from 2019 to 2023, but the metro’s median rent rose significantly faster over the same period (+49 percent). It’s also important to note that the wage gains reported here do not necessarily accrue uniformly to all renters – a market’s median renter income can also be driven up by an influx of new renters who earn more than the area’s existing renters, a dynamic almost certainly at play in fast-growing markets such as Tampa and the other Sun Belt metros where rent burden is worsening most rapidly.
Conclusion
In 2021, the national median rent spiked by a record-setting 18 percent in a single year, erasing nearly a decade of gradual improvement in the nation’s renter cost burden rate. Since then, rent growth has slowed considerably, and prices are now actually dipping modestly. Nonetheless, the number of cost-burdened renter households is still on the rise, and hit a new record in 2023. With more than half of renters spending an unhealthy share of their income on rent, it is clear that significant work must be done to alleviate a housing affordability crisis that has now extended to virtually every part of the country.
Share this Article
