Rents Continue to Dip, While Home Prices Rebound to All-Time Highs
The U.S. rental market got very expensive very quickly in 2021 and 2022, with year-over-year rent growth topping out near 20 percent. But for-sale home prices were rising even faster, and by the end of last year the cost premium of owning instead of renting was higher than ever before. The gap has widened further in 2023, as home prices rebound quickly from a brief dip, while rents are down year-over-year and continue to soften.
Comparing rental and for-sale markets across the United States
Below we compare the for-rent and for-sale housing markets since the start of the pandemic in March 2020 – a period marked by massive price growth and dwindling affordability. Rent growth is measured using the Apartment List National and Metro Rent Estimates, while price changes in the for-sale market are measured using the Case-Shiller National and Metro Area Indices.
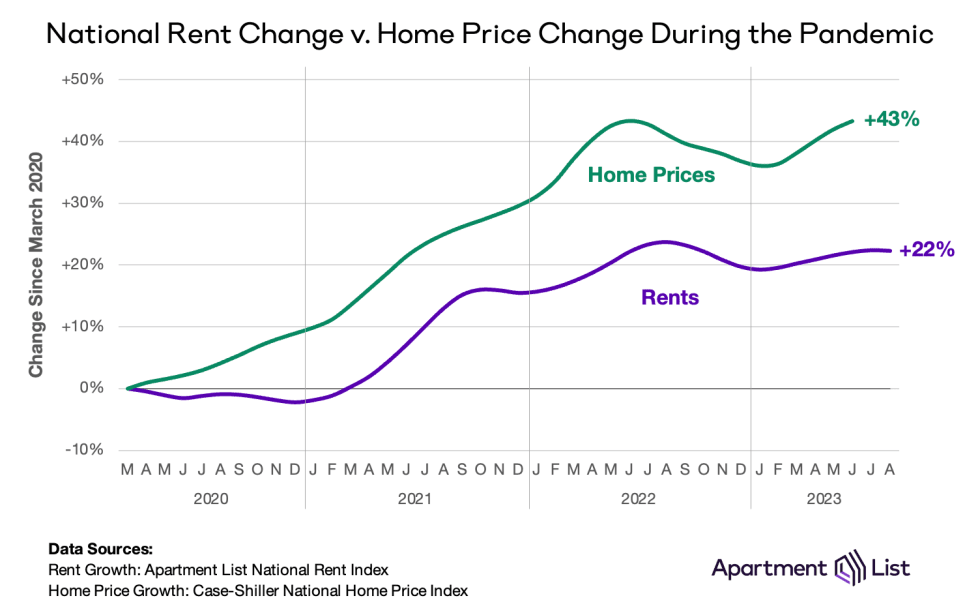
In year one of the pandemic, rapid shifts in household formation led home prices to soar while rents were largely stagnant. Over 2 million households, mostly renters living alone or with roommates, disappeared and then re-formed in 12 months as people settled into new working and living arrangements. The rental market saw a brief spike in vacancies and a brief dip in rents, but by the end of year one, rents were essentially back to pre-pandemic levels.1 Meanwhile, many renters looked at this year as an opportunity to buy a home, with mortgage rates at historic lows and many equipped with the flexibility to work anywhere. These forces put a lot of pressure on an already-tight housing market, and while nationwide rents moved little year-over-year, home prices jumped 13.5 percent.
In year two, a surge in household formation caused a shortage of vacant homes in both sectors of the housing market. The apartment vacancy rate fell below 4 percent, and active for-sale listings fell to less than half of pre-pandemic inventory. With demand greatly outpacing supply, and inflation sweeping across all sectors of the economy, by March 2022 rent prices were 16.3 percent higher than they had been in March 2020, while home prices were up 33.5 percent over the same period.
The tides finally turned in year three. In its fight against inflation, the Federal Reserve hiked interest rates, significantly ramping up mortgage rates and the cost of purchasing a home. This turned away potential buyers who were on the fence, and encouraged some sellers to drop list prices. Home price appreciation since March 2020 peaked at a staggering 43.3 percent in June 2022, but a dip in the second half of the year – a once-common seasonal trend that became non-existent during the pandemic – sank prices 5 percent to close out the year.
However, macro conditions did not produce the inventory boom required to sustain this price drop. High interest rates had pulled back demand but also negatively impacted supply. Investment in new single-family home construction stalled, while many existing homeowners – most of whom are locked into low mortgage rates – see little incentive to move, even as their current homes swell in value. A rebound over the past four months has brought home prices back to their peak and year-over-year growth to 0 percent.
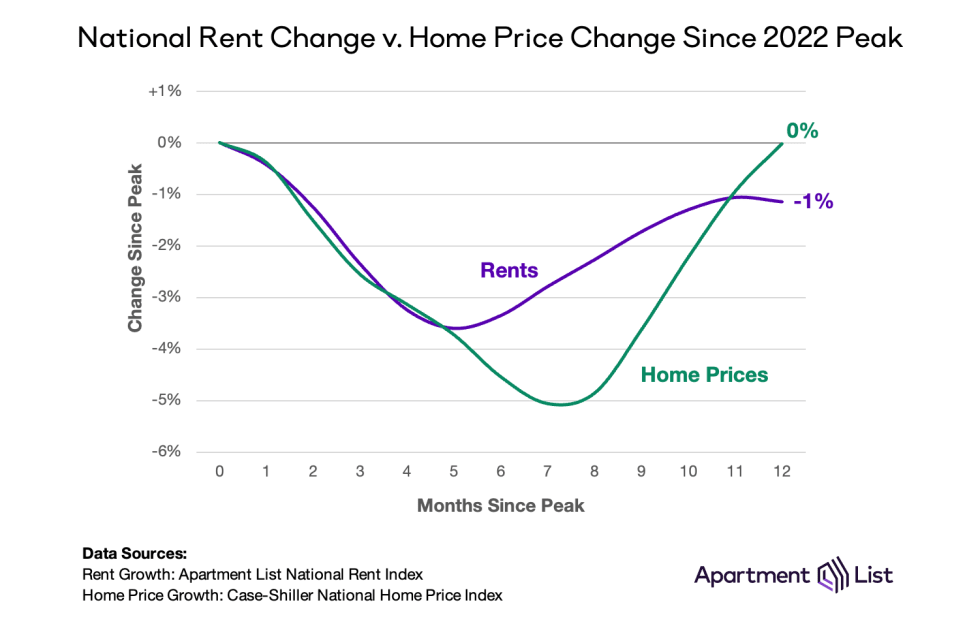
Thanks to supply expansion, the rental market experienced a slightly different trajectory during year three of the pandemic. While single-family construction stalled, multi-family construction has remained strong even in the face of high interest rates. Rents peaked in 2022 at around the same time as home prices, and while the following dip was not as sharp as in the for-sale market, it has proven stickier. Rents fell 3.6 percent off their peak, and have yet to fully rebound. Today, year-over-year rent growth stands at -1.2 percent, and after experiencing its first monthly rent drop in August, the coming winter is shaping up to be another slow one for the rental market.
Rents remain below-peak in most large metropolitan areas
The Case-Shiller index includes data for 20 large metropolitan areas across the United States. The interactive chart below compares these indices against local rental data from Apartment List. While for-sale prices have experienced more volatility over the past year, rent declines tend to be milder but more widespread and longer-lasting.
Compared to their 2022 highs, home prices are down in 10 of 20 metros. On the West Coast, the San Francisco and Seattle metros are the only two where for-sale prices fell more than 15 percent, and today after a slight rebound they remain more than 10 percent below-peak. Meanwhile, all of the metros that have rebounded fully are located in the eastern half of the country, led by Chicago, New York, and Cleveland. And despite the recent dip in some markets, prices in all 20 metros are currently substantially higher than they were in March 2020. In Florida, homes in the Miami and Tampa metros are over 60 percent more expensive today than they were at the start of the pandemic. Even in San Francisco, which has seen the most modest pandemic-era growth, for-sale home prices are currently 28 percent higher than they were in March 2020.
Price drops over the past year in the rental market are more commonplace; rents are below-peak in 15 of those same 20 metros. Again it is western markets seeing the largest dips, spanning coastal metros like Portland, Seattle, and San Francisco as well as inland sprawling metros like Las Vegas and Phoenix. While rent drops have not been particularly dramatic, the approaching winter season coupled with actively high levels of new multi-family permitting and construction should lead to further softness in the coming months.
Complete data by metropolitan area
| Metro | Rent Growth Since Pandemic | Price Growth Since Pandemic | Rent Growth Since Peak | Price Growth Since Peak |
|---|---|---|---|---|
| Atlanta | 25.4% | 51.4% | -3.8% | 1.5% |
| Boston | 19.5% | 40.2% | 1.5% | 0.9% |
| Charlotte | 26.6% | 56.2% | -1.8% | 1.1% |
| Chicago | 20.0% | 35.3% | 3.3% | 3.5% |
| Cleveland | 17.9% | 41.0% | -1.9% | 3.2% |
| Dallas | 24.9% | 51.9% | -1.9% | -4.1% |
| Denver | 21.6% | 39.2% | -0.1% | -4.5% |
| Detroit | 20.2% | 38.2% | -2.3% | 2.2% |
| Las Vegas | 29.1% | 38.5% | -5.1% | -8.2% |
| Los Angeles | 15.1% | 40.8% | -2.1% | -2.3% |
- In the first year of the pandemic, rent trends varied dramatically by market. Rent growth was flat nationwide, but certain cities experienced double-digit declines while others experienced double-digit increases.↩
Share this Article