What will the pullback in multifamily construction permitting mean for the rental market?

Introduction
Following a period of record-setting rent growth, the national median rent has since dipped slightly from its late 2022 peak. One of the key factors in this rapid cooldown has been a surge of new apartment construction adding supply to the market. 2023 saw the most new apartments completed since the 1980s and the number of multifamily units under construction peaked late last year at a record level. With nearly a million units still in the pipeline, this year is on track to bring even more new inventory than last.
Looking further ahead, though, the end of the current supply boom is already in sight. There has been a sharp pullback in the number of new multifamily projects getting underway, and that will translate to a slowdown in apartments hitting the market next year and beyond. This report breaks down the latest data on multifamily construction trends and explores what it can tell us about where the rental market is headed.
Multifamily building permits have fallen sharply from 2022 peak
In 2022, building permits were issued for 707 thousand multifamily housing units – the highest level since 1985. This boom in new apartment construction was taking place against a backdrop of skyrocketing rents and historically low interest rates, conditions which made multifamily development look like a particularly attractive investment. But in the time since, those conditions have shifted considerably. The national median rent has been declining year-over-year since last summer, and interest rates are higher than they’ve been since 2007. In response to these changing conditions, developers have begun to pull back from investing in new multifamily projects.
In 2023, permits were issued for 591 thousand multifamily units, a 16 percent decline compared to 2022. And based on data through April, 2024 is on pace to permit 525 thousand units, which would represent another year-over-year decline of 11 percent.1 This recent trend can be viewed from two angles, both of which are accurate. On one hand, we’ve seen an abrupt slowdown in apartment construction activity. But on the other hand, when viewed over a longer horizon, current permitting levels remain fairly robust even after the decline. If 2024 does end with 525 thousand units permitted, as the year-to-date trend suggests, that level would be 26 percent below the 2022 peak, but it would still be 9 percent higher than the 2015 to 2019 average and higher than any year from 1987 to 2022.
Despite the pullback in permitting, completions are still on the rise
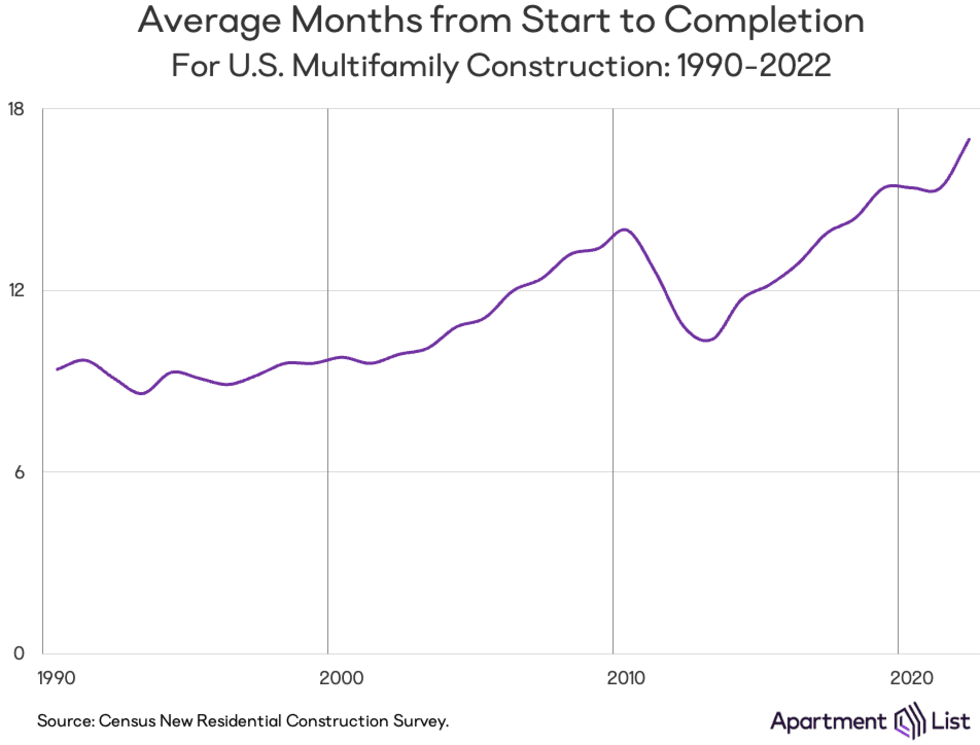
Another important fact to keep in mind is that obtaining a building permit is just the first step in new construction getting started. It takes a long time for multifamily developments to get completed, and construction times have been getting even lengthier. In 2022, it took an average of 17 months for multifamily projects to go from construction start to construction completion (with an additional three month lag between permits being issued and construction getting underway).

This construction time has been gradually increasing for years, and is up from a long-term average of 10 months from 1990 to 2009.2 Because of the lengthy construction time for multifamily projects, the slowdown in permitting activity has not yet translated to a slowdown in units hitting the market. Rather, the multifamily projects getting completed today are largely those that got started during the permitting boom of a couple of years ago. 450 thousand new multifamily units hit the market in 2023, representing a 22 percent increase compared to 2022 and the highest level since 1987. The first four months of 2024 have seen an even sharper increase in multifamily completions, and if the current pace continues, we’ll end the year with 588 thousand new units.3
Even though permitting activity has been slowing for some time, we’re only now hitting the peak of new supply hitting the market. The number of multifamily units under construction peaked in late 2023 at over a million, an all-time record. More recently, the number of units under construction has been gradually declining as the number of completions has begun to outpace the number of new units being issued. But even after the recent decline, the number of units still in the pipeline (919K) remains higher than at any point in history before the recent peak. As we look ahead to next year and beyond, the permitting slowdown will eventually filter through to completions, but in the meantime, there remains a historic construction backlog still being worked through.
Austin continues to build more apartments than any other large metro
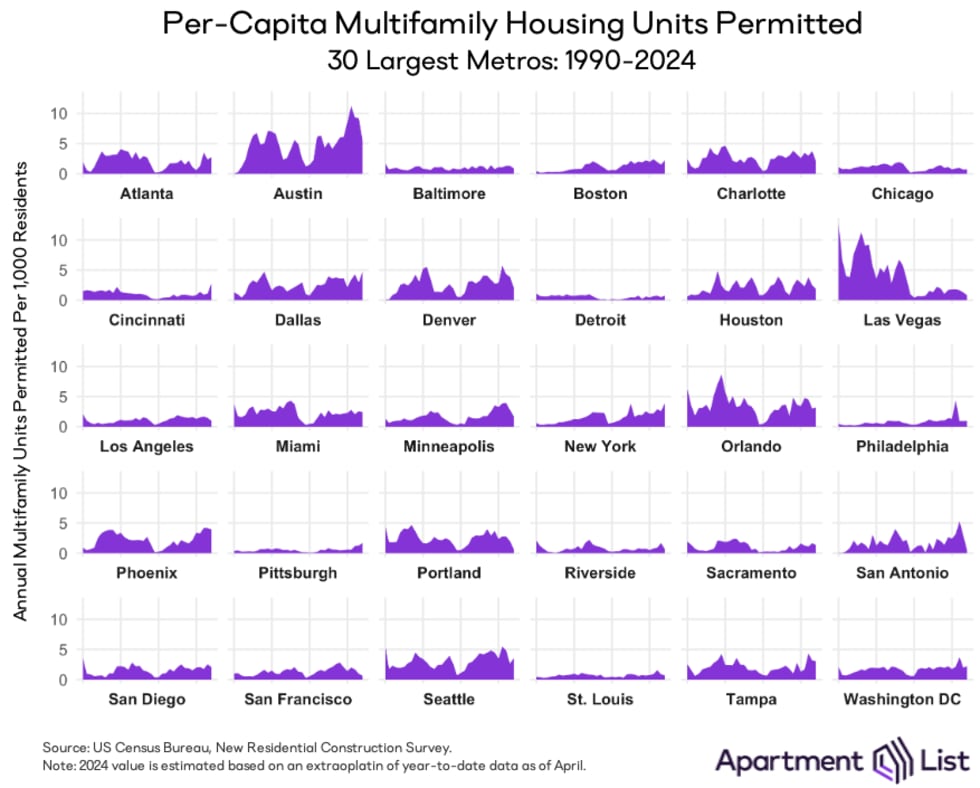
Underlying the broad national trend, the multifamily construction boom of recent years has had significant regional variation. The chart below presents the long term-trends in multifamily permitting activity from 1990 through 2024 for the nation’s 30 largest metros on a per-capita basis (i.e. controlling for differences in population). In general, markets throughout the Sun Belt have been building fastest on a per-capita basis, while those in the Northeast and Midwest are generally building less.

Austin, TX serves as the prime example of the construction boom – the metro has led the way for multifamily permitting per-capita for seven years running. In 2023, 9.2 new multifamily units were permitted in the Austin metro for every 1,000 residents. For comparison, Austin’s pace of multifamily permitting last year was 61 percent higher than that of the second-ranked metro (Raleigh, NC) and 31 times greater than that of the metro with the slowest pace (Birmingham, AL). Austin is currently on pace to see a dramatic pullback in permitting in 2024 - but even with that pullback, Austin is still on pace to log the most new permits-per-capita this year.
Austin’s rental market is also illustrative of the impact that increased supply can have on prices. We estimate that rents in the Austin metro have dipped by 7 percent year-over-year, the sharpest decline of any large metro. This dip in rent prices is taking place even as the metro continues to experience strong demand, as the rapid pace of new construction has more than kept pace with the influx of new renters to the area.4
The ability of new supply to dampen rent growth isn’t exclusive to Austin, but is rather a trend that we observe in many markets. Raleigh, NC had both the second highest rate of multifamily permits-per-capita issued in 2023 and currently has the second sharpest year-over-year rent decline as of our latest estimates. Jacksonville, Charlotte, Phoenix, and Nashville all also land in the top 10 for both fastest multifamily permitting and sharpest rent declines.
While the most significant construction activity is taking place in fast-growing markets throughout the Sun Belt, activity has also picked up in a handful of markets in the Midwest and along the pricey coasts – areas that haven’t historically been known for rapid housing supply expansion. Columbus, Minneapolis, Seattle, NYC, Miami, and San Diego all ranked in the top 20 for per-capita multifamily permitting in 2023. In the Midwest markets, this may reflect growing demand in a part of the country that stands as the last bastion of relative housing affordability. The coastal markets mentioned, however, have long been among the nation’s most expensive. Current rates of construction in these metros, even if they represent an improvement, are not sufficient to fully combat their acute affordability issues which have been decades in the making, particularly as a pullback is getting underway.
What does this mean going forward?
A pullback in multifamily construction is already underway and can be seen clearly in permitting data. That said, even though the number of new units being permitted has fallen sharply, it is still relatively robust by historic standards. And because of the lengthy construction timeline of multifamily projects, we’re still working through the historic backlog of projects that has built up in recent years. In fact, 2024 is set to see the most new multifamily completions in decades. At the same time, a surge in built-for-rent single-family homes is also contributing to the growing options available to renters.
The influx of new apartment inventory this year should result in a continuation of the market conditions that defined 2023, when increasing levels of new supply collided with softening demand, leading to a rapid slowdown in rent growth and increasing vacancy rates. Looking ahead to the remainder of this year and into next, we expect that these conditions are likely to persist. Unless demand rebounds to levels solidly above the long-term average, it’s likely that rent growth will remain soft and that vacancy rates could continue to inch higher. These trends will be especially pronounced in the southern markets that are seeing the fastest housing stock expansion.
These conditions will not be indefinite, however. The pullback in new projects getting underway will eventually translate to a slowdown in new completions. We expect that 2024 will be the peak for new apartments hitting the market, and that next year will see fewer completions. When this happens, demand could begin to outstrip supply again, leading to tighter market conditions. The prevailing conditions in the rental market are currently bringing some much-needed relief to renters, but over the medium term, those winds are expected to shift.
- We arrive at this 2024 full year estimate by extrapolating actual monthly permitting estimates for January through April based on the typical annual seasonality in permit issuance. In other words, we estimate a 2024 total under the assumption that year-to-date actuals comprise a share of the annual total that is consistent with the long-run average.↩
- The lengthening of construction times can be traced to a number of causes – growing scope as multifamily projects have increased in size (i.e. an increase in the average number of units-per-building), labor and materials shortages, and additional pandemic-related disruptions in more recent years.↩
- This 2024 full-year estimate is calculated with the same approach used to estimate 2024 permits above.↩
- Here it’s important to note that Apartment List’s estimates of rent growth are calculated based on the sample of properties we observe on our platform, which are not fully representative of the entire rental market. Apartment List inventory is largely comprised of large, professionally-managed multifamily properties which tend to have above average prices. These properties may face more direct competition from new supply compared to lower priced units, such that pricing trends may vary in the lower price tiers where we have less coverage.↩
Share this Article
