The U.S. Added Nearly 600,000 Super Commuters in 2022

New data from the US Census Bureau shows a growing number of Americans are spending at least 90 minutes each way traveling to and from work, a practice known as “super-commuting.” This trend isn’t new; super-commuting was a growing problem throughout the 2010s, as metropolitan areas grew outward and workers moved further from job centers in search of affordable housing and homeownership. From 2010 to 2019, the super-commuting rate rose from 2.4 percent of the nation’s workforce to 3.1 percent. At its peak, 4.6 million workers were enduring three-plus hours of commuting daily.

The COVID-19 pandemic provided a brief respite, eliminating commutes for many and reducing commute times for the rest as traffic abated. As the economy went remote, the number of super commuters fell by over 1.5 million even as demand for suburban and exurban living remained strong.
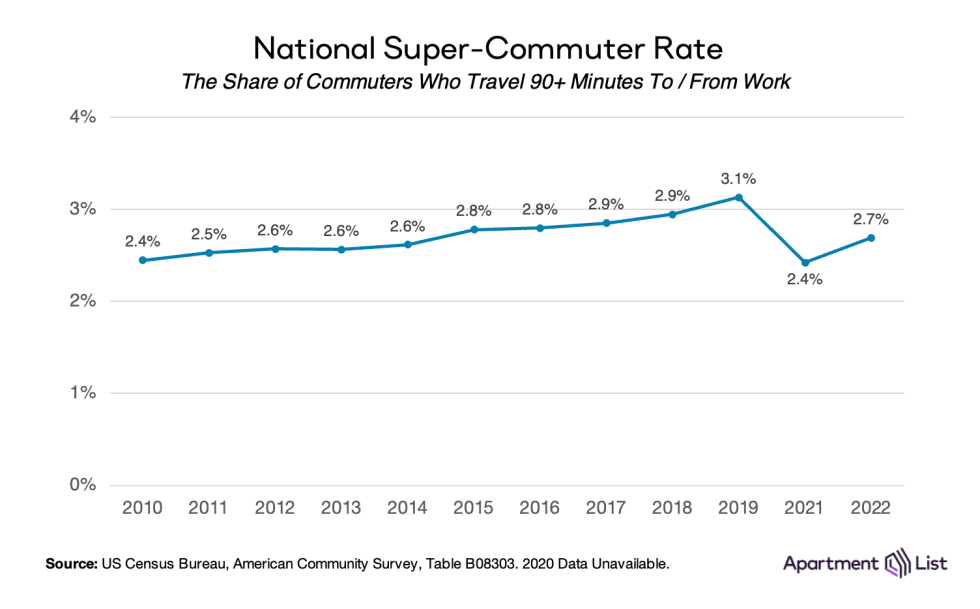
But 2022 brought a resumption of the earlier trend. Remote work remained popular, but a shift back towards in-office work meant 10 million more workers commuted compared to 2021. Consequently, the number of super-commuters jumped by nearly 600,000 year-over-year. This is the largest single-year jump on record, and while still well short of the peak, it brings the total number of super-commuters back to 3.7 million.
The Impacts of Suburbanization & COVID
City-to-suburb migration has been strong for decades, and its underlying forces have shifted over time. But a recent focus on homeownership and affordable cost-of-living has encouraged families to spread into lower-density communities even if they intend to keep their centrally-located jobs. The latest population estimates from the US Census Bureau show suburbanization vividly, with high-growth counties forming visible rings around urban cores.
Historical patterns of housing development have also encouraged suburbanization and lengthier commutes. Many regions with high super-commuter rates have been expanding job markets much faster than housing markets, in some cases adding more than 10 jobs for every new home built. Naturally, this uneven growth drives up local housing prices and encourages families to look outward for affordable living. Other markets have more-sustainable jobs-to-housing ratios, but there, it is sprawling single-family housing which dominates, instead of multifamily developments that would support higher density, better job access, and shorter commutes.
And as with any discussion of urban housing, labor, or transportation, the effect of the COVID-19 pandemic cannot be understated. Super-commuting dropped rapidly in 2020 thanks to the widespread adoption of remote work. Nineteen million workers ceased commuting altogether, and the total number of super-commuters reduced by more than 1.5 million. But the pandemic also spurred a sharp increase in demand for suburban housing, shifting more workers to communities that are less-efficiently connected to jobs. In this way, remote work may actually encourage some to accept longer commutes, especially as hybrid working arrangements remain more popular than fully-remote ones. Hybrid roles could make a long commute tolerable if it only needs to happen once or twice per week, especially if it unlocks better pay than what is offered by local jobs.
Wages Are Higher For Those Willing To Commute Long Distances
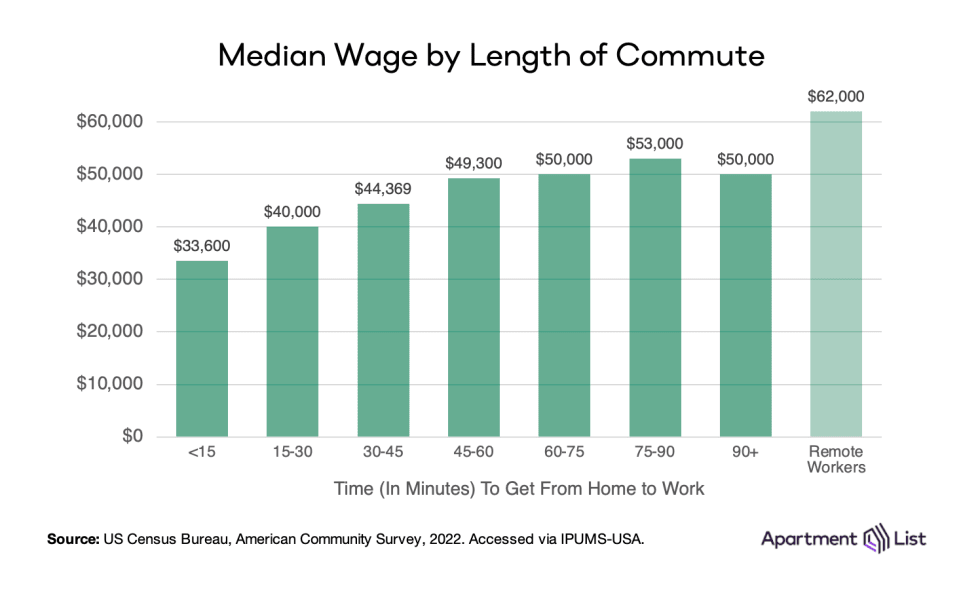
Ultimately, the decision of how long one is willing to commute may come down to wages. The latest census data clearly show that workers are willing to trade lengthy commutes for higher incomes. In 2022, the median wage eclipses $50,000 for workers who spend at least one hour commuting, and is actually lowest for those who live within a quick 15-minute trip to work.
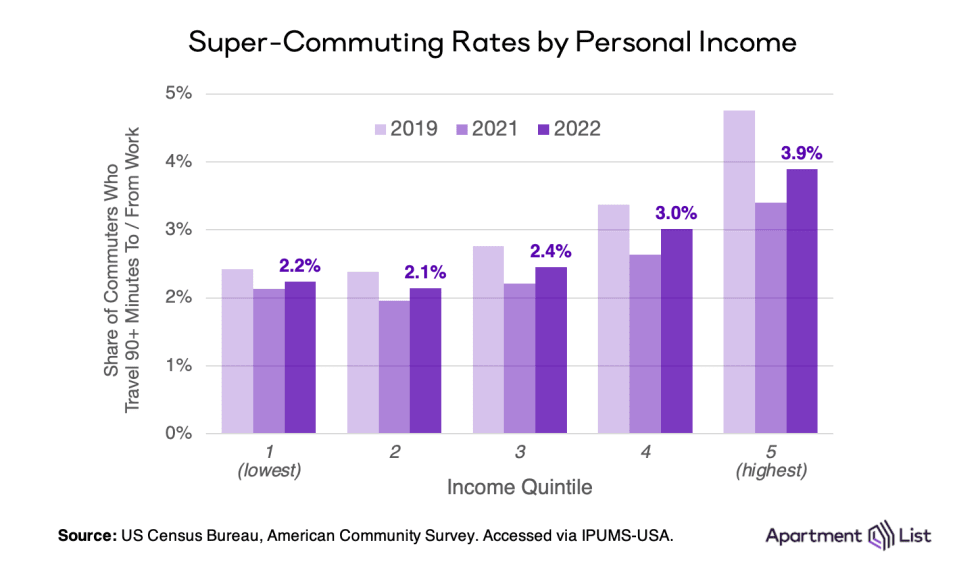
The correlation between wages and commutes was even stronger before the pandemic, when super-commuter rates were twice as high for the nation’s top income bracket (personal wages >$75,000) than its bottom (personal wages <$14,000). The relationship still exists, but has been weakened by the disparate impact of remote work, as high-earners have been more likely to transition from super-commuting to working from home. Within the highest income bracket today, over one-quarter of employees are remote and the super-commuter rate sits just below 4 percent.
The Geography of Super-Commuting
Super-commuting is most common at the fringes of the nation’s strongest job markets. Here, in the suburban and exurban counties surrounding major metropolitan cities, workers who are willing to stretch their commutes can enjoy lower cost-of-living while still accessing higher-wage, in-person jobs. The nationwide super-commuting rate is 2.7 percent, but double-digit rates can be found along the peripheries of several large metros in California and Texas, as well as Seattle, New York, and Washington D.C.
The Los Angeles metropolitan area provides the clearest example of how suburbanization and super-commuting grow hand-in-hand. Many of the smaller cities along the northern and eastern boundaries of the metro were originally developed as farming communities, but then exploded in population during the late-20th century as residents sought cheaper housing that was no longer available in more-central cities like Los Angeles.
Today, the region has more super-commuters than anywhere else. The nation’s highest super-commuter rate can be found in Palmdale, a 60-mile drive from Los Angeles, where 16.9 percent of all workers commute at least 90 minutes for work. Additionally, super-commuter rates in Victorville, Apple Valley, Hesperia, and Lake Elsinore all rank in the national top 10. Several other cities in the region have super-commuting rates that are more than double the national average of 2.7 percent. Connected to Los Angeles by traffic-snarled freeways and limited transit options, workers in these cities must tolerate long commutes in order to access the higher wages offered in the urban core.
Public Transit Riders Continue To Super-Commute In Large Numbers
For many, super-commuting translates to long hours behind the wheel of a car. And while the vast majority of commuters drive private vehicles (92 percent), it is transit riders who endure a disproportionate share of super-commuting.
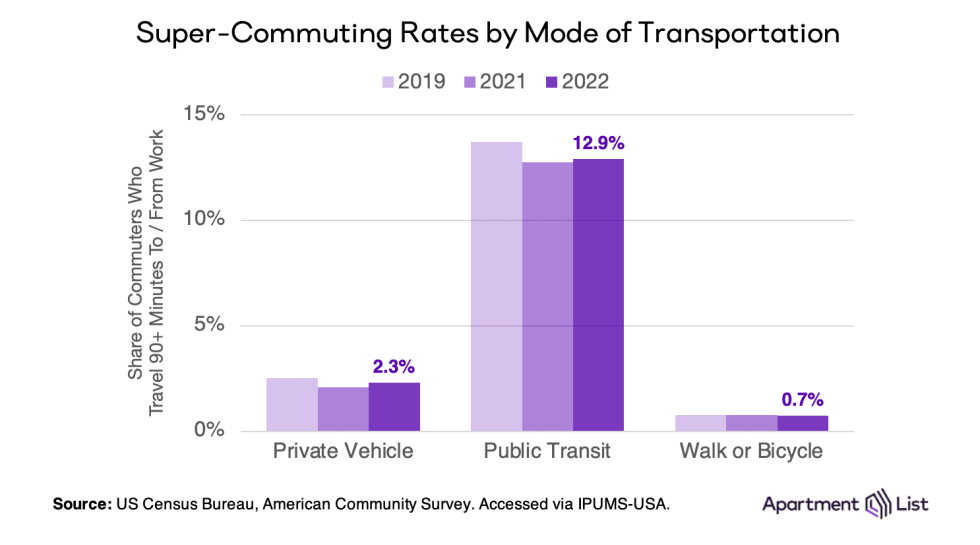
For drivers, only 2.3 percent commuted 90+ minutes to work in 2022. Consistent with the national trend, this is slightly more than in 2021, but still less than the pre-pandemic peak in 2019. The super-commuting rate for transit riders, on the other hand, is 12.9 percent. Transit riders account for just 4 percent of the nation’s commuters, but 17 percent of its super-commuters.
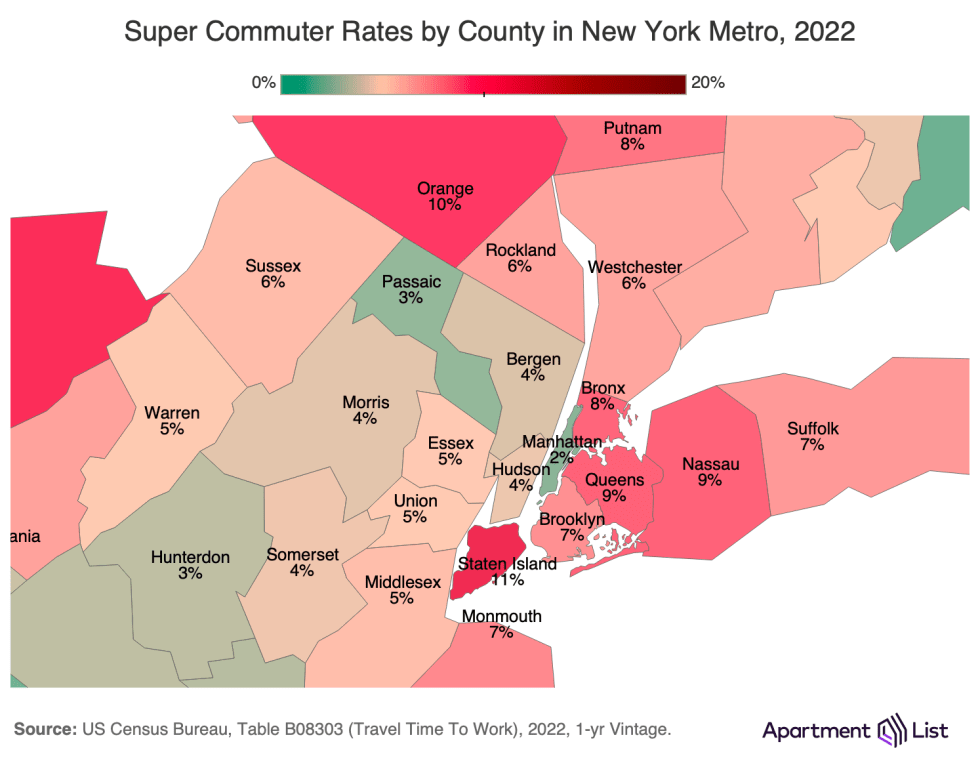
Nowhere is this more visible than in the nation’s transit capital and largest metro, New York. Its five boroughs, plus surrounding counties that make up the greater metropolitan area, have the highest rates of transit adoption in the country. But with the exception of Manhattan, they also have relatively high rates of super-commuting, led by Staten Island where more than 1-in-10 workers are super-commuters.
Super Commuting & Its Implications
The relationship between where people live and where they work continues to evolve. A record number continue working from home; however, many employers appear to be shifting back to in-person or hybrid arrangements. This is putting more commuters on roadways and transitways daily – including more super-commuters – and resuming the pre-pandemic trend. Worsening commutes for drivers increase car-related expenses, impact physical health, and amplify the environmental consequences of suburban sprawl. Meanwhile, worsening commutes for transit riders harm quality-of-life in urban cities and disproportionately affect the car-free households that tend to be lower-income. Altogether, this trend may increase tension between workers and employers, as they negotiate working arrangements that affect their commutes.
Housing is of course central to any attempts at cutting back on super-commuting. In cities and suburbs alike, dense construction and infill development (built at a rate that scales appropriately with job growth) can improve housing opportunities so that those who wish to live closer to work can afford to do so.
Share this Article

