Apartment List Renter Migration Report: 2026
Welcome to the 2026 Apartment List Renter Migration Report. Here we analyze data on millions of searches to see where our users are looking to move, shedding new light on the migration patterns of America’s renters. This report incorporates the search preferences of users who registered with Apartment List between January 1 and December 31, 2025.1
A large share of renters are considering a big move in 2026
Over the past half-decade, rapid developments in remote work, housing construction, affordability, and local economic growth have shifted American migration patterns. Overall migration has been slowing somewhat, although many individual markets have experienced extreme swings in housing demand. Longer-distance moves – to new states or metropolitan areas – were briefly popular immediately after the COVID-19 pandemic but have since slowed, as inflation pushed affordability concerns and moving costs to new highs.
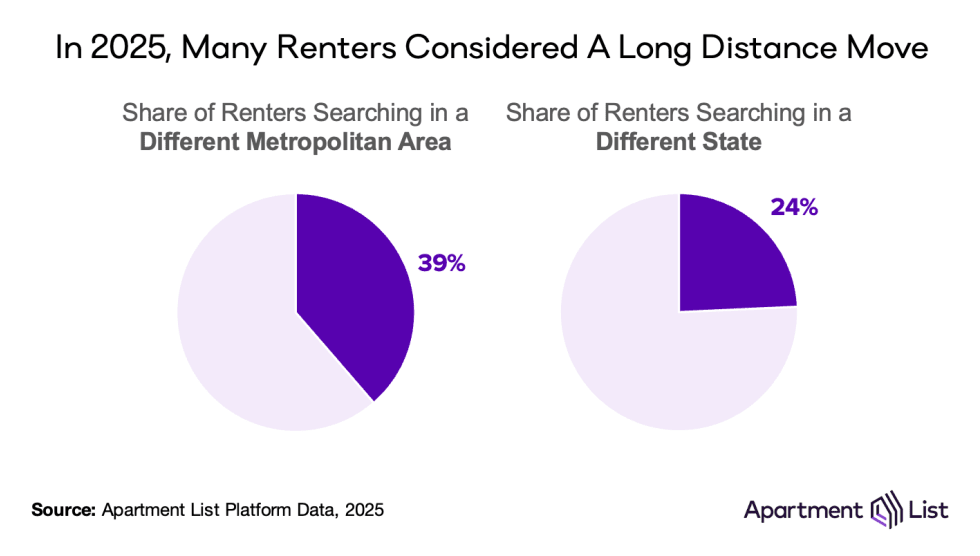
Search data from Apartment List indicates whether these patterns are set to continue or reverse course. In 2025, the share of renters on our platform looking for a new home in a new metropolitan area held steady at 39 percent. The share looking for a longer-distance move across state lines declines slightly, to 24 percent.
Americans are continuing to migrate to the Sunbelt and Mountain West
One enduring feature of the post-pandemic housing market is migration out of dense, expensive markets, and into more-affordable ones. Census data shows this clearly; from 2024 to 2025, states like California, New York, and Massachusetts experienced domestic migration outflows to the Sun Belt and Mountain West regions. This pattern has held true for several years, despite net domestic migration (i.e., population change driven by movers, rather than births/deaths) continuing to trend down.2
In absolute terms, California, New York, Illinois, New Jersey, and Massachusetts had the largest net domestic migration outflows between 2024 and 2025. In California specifically, 229,000 more people moved out of the state than moved into it. California’s total population was essentially flat year-over-year, but only because net negative domestic migration was offset by net positive international migration (+109,000) and net positive natural growth (110,000 more births than deaths). So the state remains a major importer of new residents from across the globe, and also a major exporter of residents to other parts of the country. In percentage terms, the state that lost 0.6% of its population to domestic migration.
At the other end of the spectrum, North Carolina, Texas, South Carolina, Tennessee, and Arizona have gained the most new residents through domestic migration. In North Carolina, net domestic migration totaled +84,000, a +0.8 percent population increase. Meanwhile, the neighbor to the south has cemented itself as the nation’s fastest growing state, at least in percentage terms. For the fourth straight year, South Carolina has topped the rankings, with +1.2 percent population growth (net +66,000 residents).
CA and NY continue to export renters to TX and FL
Below we dig into the top destinations for renters looking to leave the two states that lost the largest populations due to domestic outmigration (California and New York), as well as the sources of renters searching into the two states that took in the most domestic movers (North Carolina and Texas).
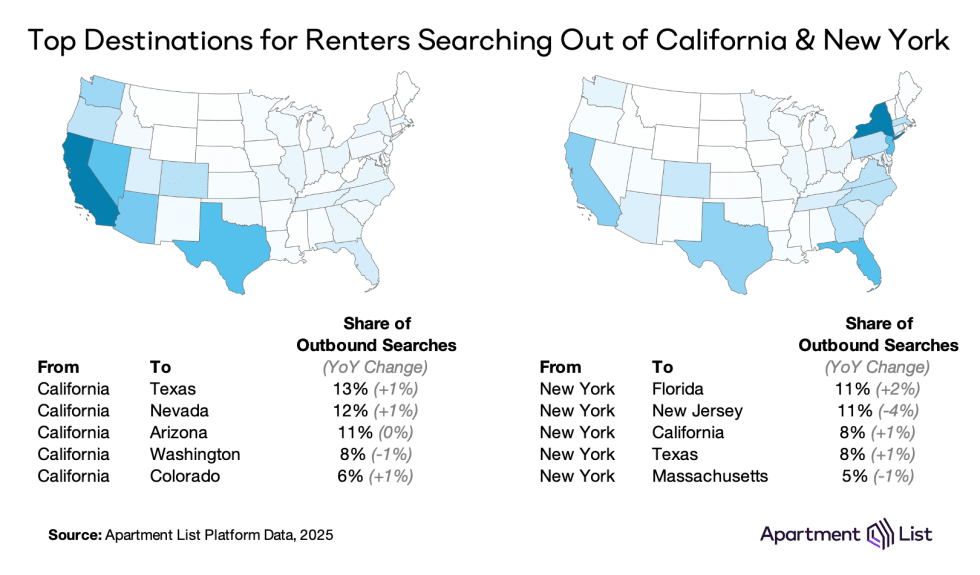
For renters looking to move out of California, Texas was the most popular destination, edging out neighboring Nevada and Arizona. Washington and Colorado rounded out the Top 5. Interestingly, Florida has been losing favor; the Sunshine State received 3.8 percent of California’s outbound searches in 2025, down from 4.2 percent in 2024 and 5.3 percent in 2023. This has been offset by annual percentage point increases in popularity to Texas, Nevada, and Colorado.
Yet Florida has gained popularity on the East Coast, and now occupies the top spot among renters looking out of New York. 11 percent of potential movers from New York are searching in Florida, edging out New Jersey which used to be the top destination. California and Texas remain popular long-distance options for outbound New Yorkers as well.
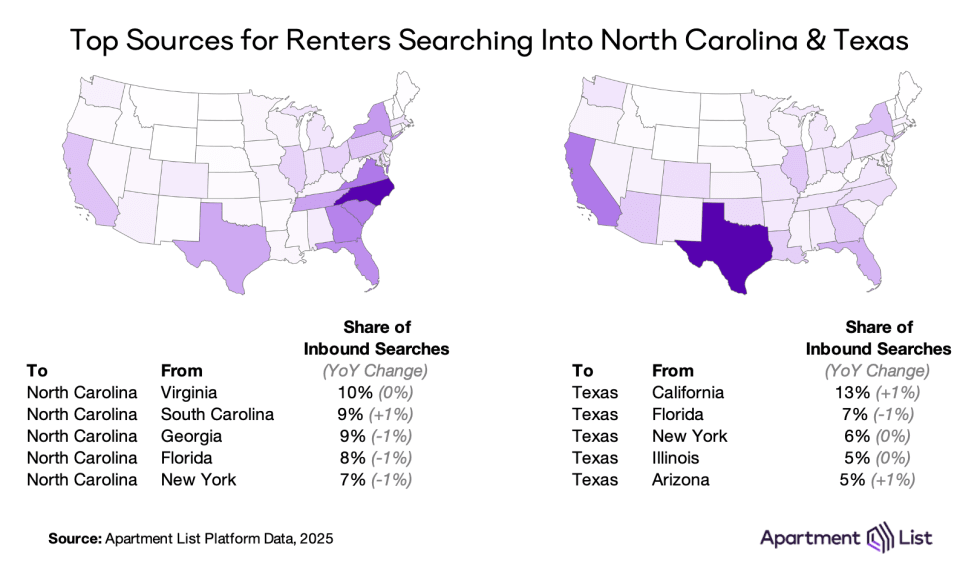
North Carolina and Texas gained more residents through domestic migration in 2025 than any other state. When we look at the most common sources of inbound rental searches, we see New York and Florida in both states’ Top 5. North Carolina receives the most interest from nearby southeastern states like Virginia, South Carolina, and Georgia, while search interest into Texas is more spread out, coming primarily from California, Florida, and New York.
Local data highlight the popularity of smaller, southeastern metros
The metro-level cuts of our search data also validate trends seen in the Census data. The table below shows the 10 metros with the highest share of inbound searches coming from out-of-market renters – renters living in some other metropolitan area.
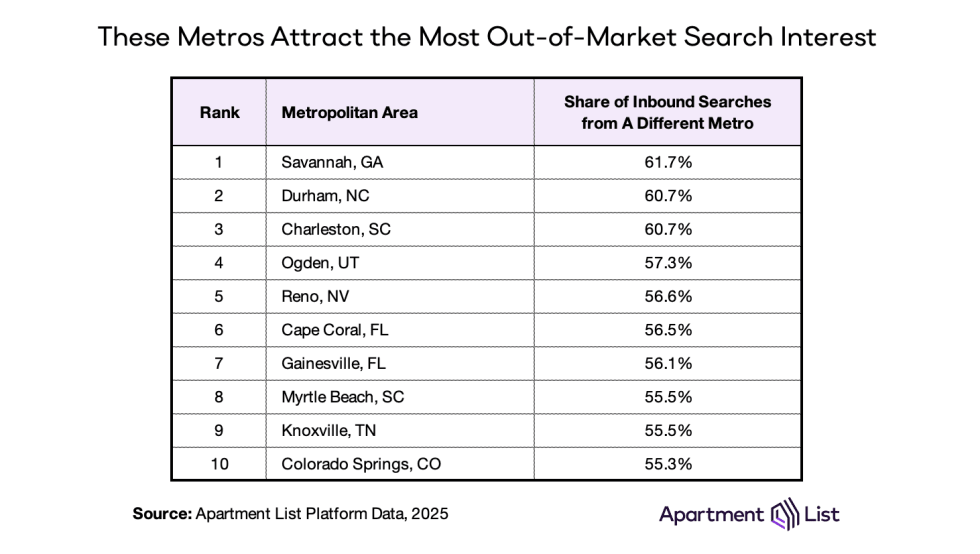
Consistent with the Census Bureau’s domestic migration data covered above, this list is dominated by markets in fast-growing states. Savannah GA, Durham NC, and Charleston SC top the list, where over 60 percent of searches come from out-of-towners. For these metros, nearby Raleigh, Charlotte, and Atlanta are the top sources of inbound searches, as renters from larger, more-expensive markets look to take their dollar further in fast-growing cities.
We see this trend in other parts of the country too, with large search channels out of Salt Lake City and into Ogden UT, out of Sacramento and San Francisco and into Reno, NV, out of Denver and into Colorado Springs, CO. These rental markets are poised to continue growing through 2026, so long-term affordability will depend greatly on whether there is enough available supply to absorb new renters.
Conclusion
The geographic flexibility offered by remote work, coupled with worsening affordability, have swayed America’s migration patterns in recent years. Despite migration rates slowing, data from the Census Bureau as well as the Apartment List platform signal sustained interest in lower-density, lower-cost regions of the country, namely the Southeast and Mountain West. But as remote work appears to be losing some momentum, popularity in these regions may also wane, at least for markets that do not offer competitive wages. See below for full metro- and state-level data.
Complete metro- and state-level migration data
For access to granular data, the tables below offer summaries for over 100 metropolitan areas and all 50 states + DC.
Metro-Level Data
| Metro | Outbound Share (1) | Top Outbound Location (2) | Inbound Share (3) | Top Inbound Location (4) |
|---|---|---|---|---|
| Albany, NY | 34.2% | New York, NY | 36.7% | Syracuse, NY |
| Albuquerque, NM | 19.9% | Santa Fe, NM | 33.7% | Phoenix, AZ |
| Atlanta, GA | 34.9% | Augusta, GA | 22.6% | New York, NY |
| Austin, TX | 48.6% | San Antonio, TX | 41.0% | Dallas, TX |
| Baltimore, MD | 44.3% | Washington, DC | 33.1% | Washington, DC |
| Baton Rouge, LA | 33.2% | New Orleans, LA | 50.4% | New Orleans, LA |
| Birmingham, AL | 46.9% | Huntsville, AL | 34.6% | Atlanta, GA |
| Boise, ID | 27.0% | Spokane, WA | 47.1% | Seattle, WA |
| Boston, MA | 36.9% | Providence, RI | 34.0% | New York, NY |
| Cape Coral, FL | 62.7% | Miami, FL | 56.5% | Miami, FL |
Table notes:
- The share of searches from the metro (ie. outbound searches) that are destined for apartments outside the metro.
- Among outbound searches leaving the metro, the most popular destination.
- The share of searches into the metro (ie. inbound searches) that originated from users who lives outside the metro.
- Among inbound searches into the metro, the most popular source location.
State-Level Data
| State | Outbound Share (1) | Top Outbound Location (2) | Inbound Share (3) | Top Inbound Location (4) |
|---|---|---|---|---|
| Alabama | 33.6% | Florida | 25.7% | Georgia |
| Alaska | 26.5% | Washington | 44.9% | Washington |
| Arizona | 18.5% | New Mexico | 23.9% | California |
| Arkansas | 30.7% | Texas | 38.0% | Texas |
| California | 16.5% | Texas | 13.8% | Texas |
| Colorado | 21.4% | California | 32.9% | Texas |
| Connecticut | 28.4% | Massachusetts | 28.2% | New York |
| Delaware | 36.1% | Pennsylvania | 44.1% | Pennsylvania |
| District of Columbia | 71.1% | Maryland | 72.3% | Maryland |
| Florida | 16.5% | Texas | 21.5% | New York |
Table notes:
- The share of searches from the metro (ie. outbound searches) that are destined for apartments outside the metro.
- Among outbound searches leaving the metro, the most popular destination.
- The share of searches into the metro (ie. inbound searches) that originated from users who lives outside the metro.
- Among inbound searches into the metro, the most popular source location.
- The analysis in this report is based on apartment searches rather than completed moves, based on the search preferences that users provide when they register for Apartment List.↩
- In this report, we focus on net domestic migration as estimated by the Census Bureau, for it is the component of population change that aligns most closely with Apartment List user data. Note that domestic migration is just one component of population change, which is also impacted by international migration and natural population change (births minus deaths).↩
Share this Article

