Which Metros Have the Most Cost-Burdened Renters?
The share of cost-burdened renter households in the US declined significantly last year, as median incomes increased faster than rents. Metropolitan areas in Texas performed exceptionally well, with low and declining shares of renters facing challenges with affordability. Also, despite skyrocketing rents in tech hubs like Seattle, Denver, and San Jose, the share of cost-burdened renters there remain lower than national averages.
Despite these positive trends, housing continues to be unaffordable for more than half of renters nationwide. Metros in Florida and Southern California continue to struggle, with high rates of cost-burdened renters in Miami (63.9%), Los Angeles (58.6%), and San Diego (56.7%). Elsewhere, the situation is mixed: renters in NYC, Albuquerque, and Chicago struggle, but those in DC, Columbus, and Salt Lake City fare better.
As before, our analysis shows that rental affordability is driven by both rents and incomes. To help renters, city officials, policymakers, and housing advocates should continue to strive for wage growth, while keeping a lid on rising rents.
Background
As the U.S. renter population nears 44 million households - 37% of all households in the nation - the challenges facing this group of Americans are of increasing importance. Despite strong employment growth in recent years, housing affordability continues to be a major concern for many renters across the country. To better understand the challenges facing renters, we dug into Census data on renter cost burdens across the US.
We obtained Census data from 2005-2015. Renters are divided into three groups:
| Category | Share of Income Spent on Rent |
|---|---|
| Not cost-burdened | Less than 30% |
| Moderately cost-burdened | 30 - 50% |
| Severely cost-burdened | More than 50% |
We then looked at Census data on median rents and renter incomes, to see how they drive affordability.
50.6% of US renters were cost-burdened in 2015
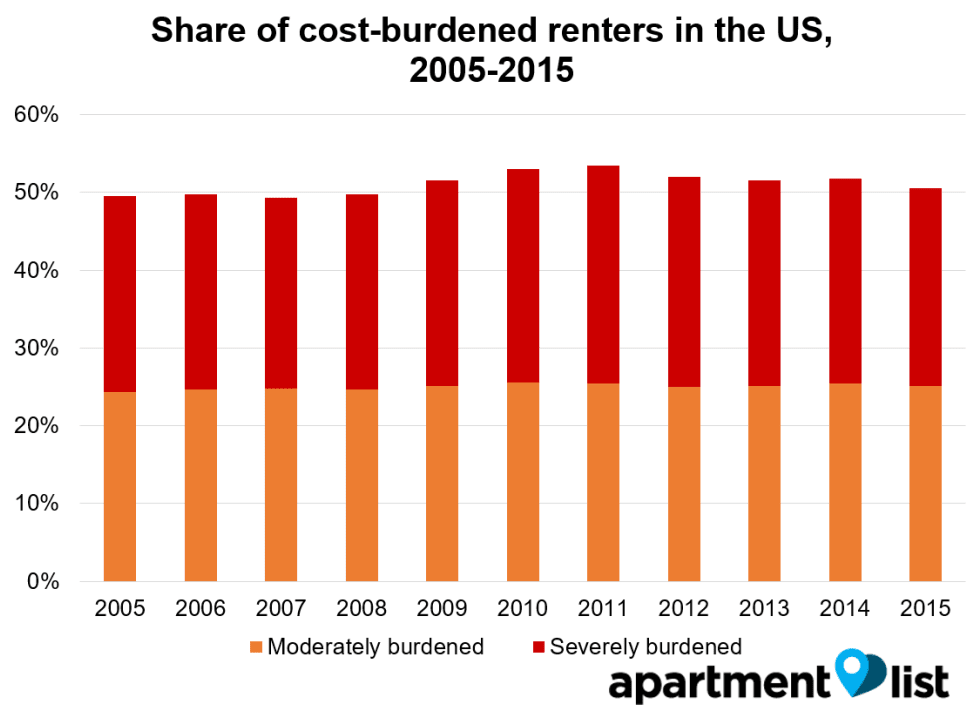
First, we analyzed data for the US as a whole, from 2005-2015. 50.6% of renters were cost-burdened in 2015 - down 1.2% from the year before, and 2.8% below the 2011 peak. Encouragingly, most of the improvement has been seen among severely cost-burdened renters.
Despite these gains, close to a quarter of renters continue to pay more than half of their income in rent, which likely makes it difficult to afford healthcare, prepare for emergencies, or save for a down payment on a home. Also, renter cost burdens remain near historic highs: only 24% of renters were burdened in 1960, and 38% as recently as 2000.
Renter incomes continue to outpace rents, improving affordability
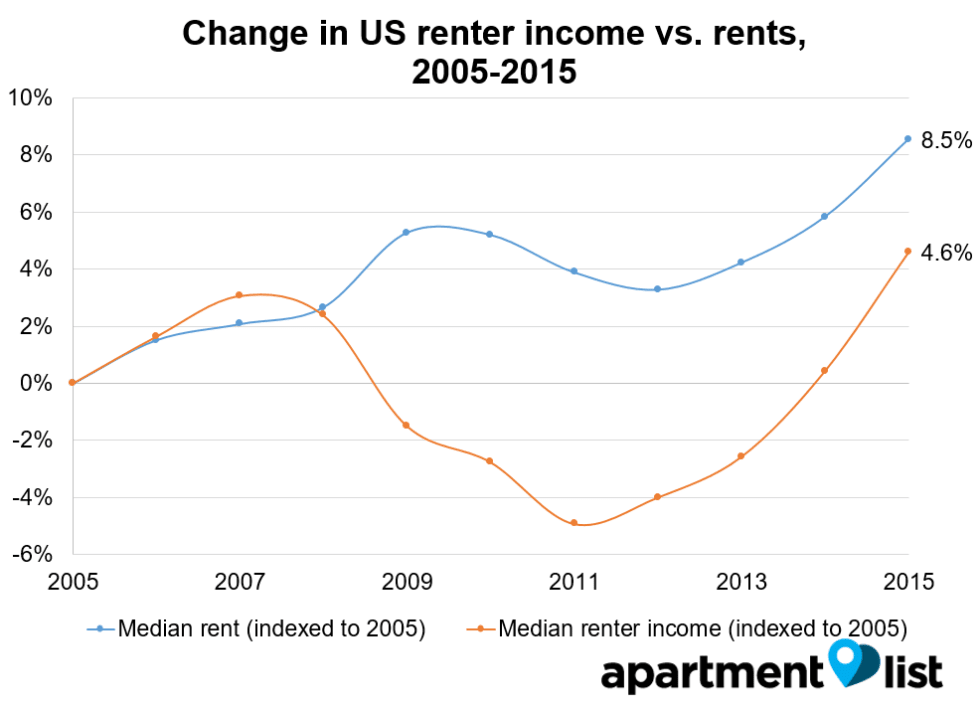
Next, we compared median rents and renter incomes in the US, to understand the drivers of changes in affordability. Incomes fell sharply from 2007-2011 even as rents continued to rise, causing the share of cost-burdened renters to increase. More recently, however, the recovery in incomes has improved affordability among renters.
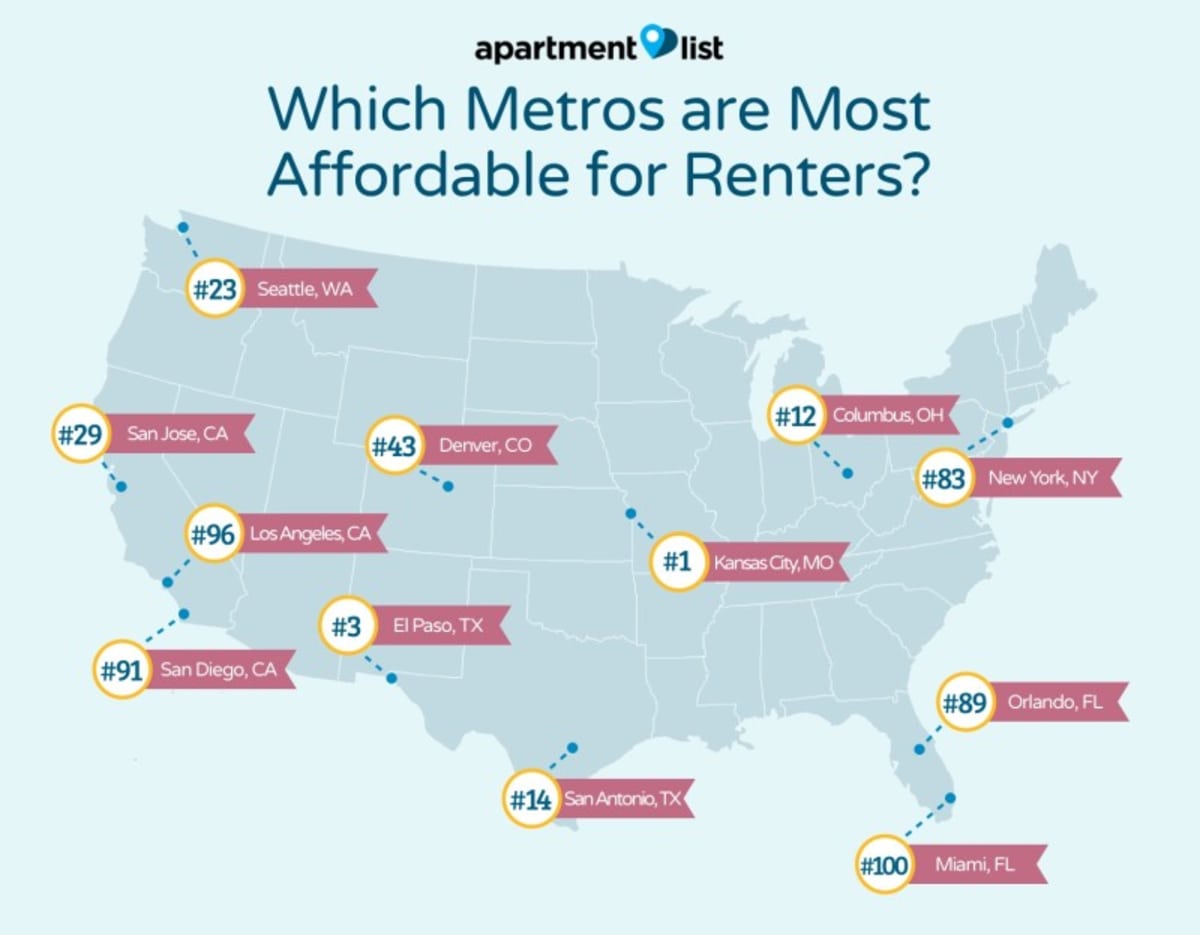
Texas and tech hubs are relatively affordable; Florida and Southern California are not
The share of cost burdened renters is 50.6% nationwide, but this figure varies significantly across metros. Affordability is worst in Florida and Southern California, areas with skyrocketing rents and stagnant wages. On the other end of the spectrum, more affordable Midwestern metros tend to have much lower shares of cost burdened renters.
Next, we dive into the trends for groups of metropolitan areas across the nation.
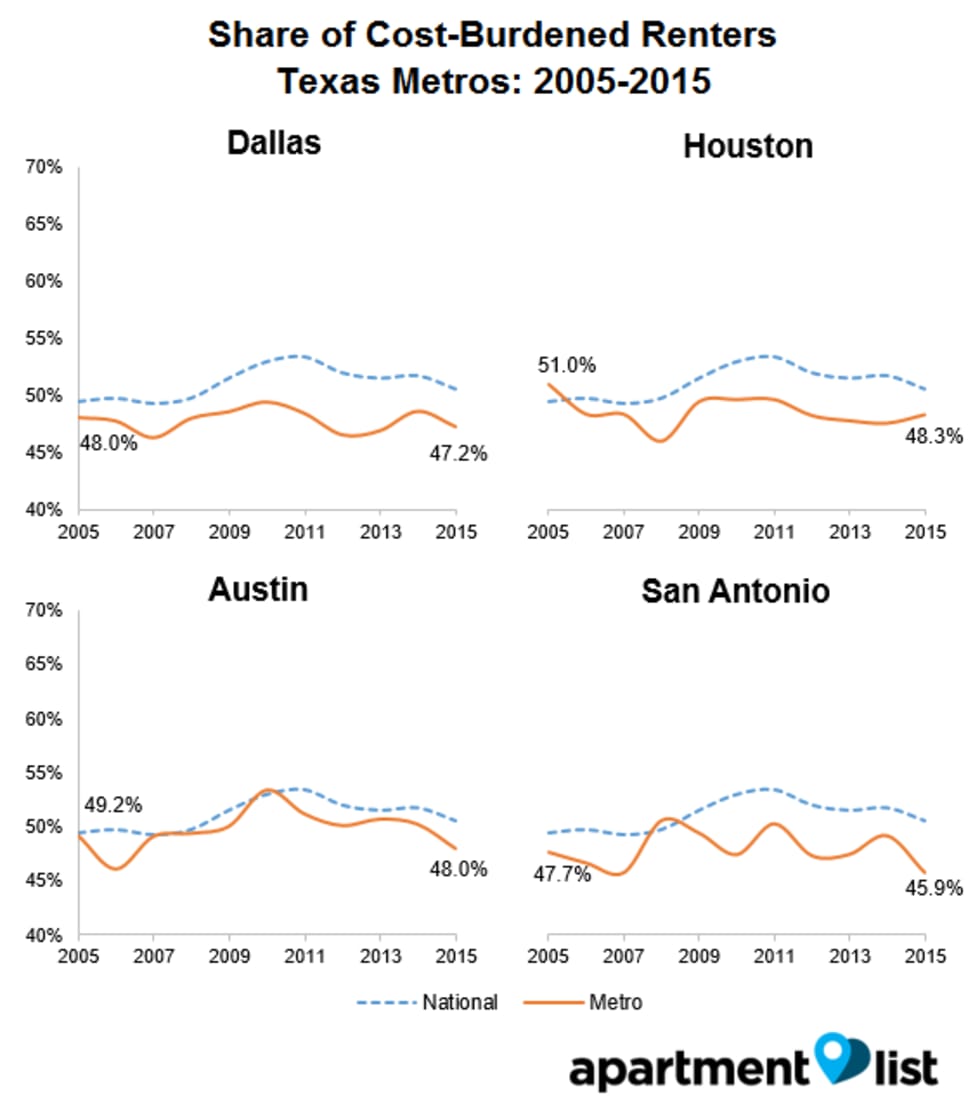 Texas metropolitan areas generally performed very well. Rental affordability has improved in each of these major metros in the state over the past decade, and the 2015 numbers are all well below the national average.
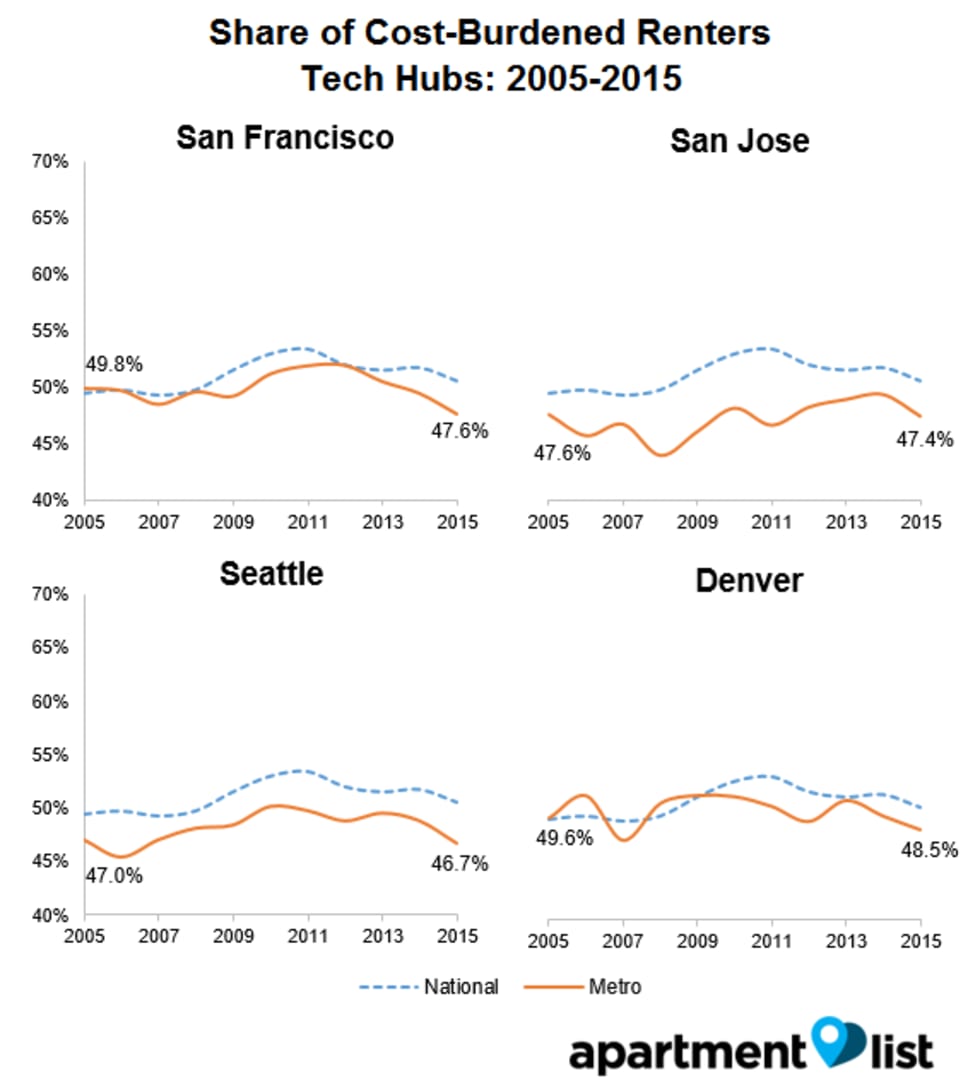
Despite the outcry over skyrocketing rents in the nation’s tech hubs, San Francisco, San Jose, Seattle, and Denver outperformed the national average.
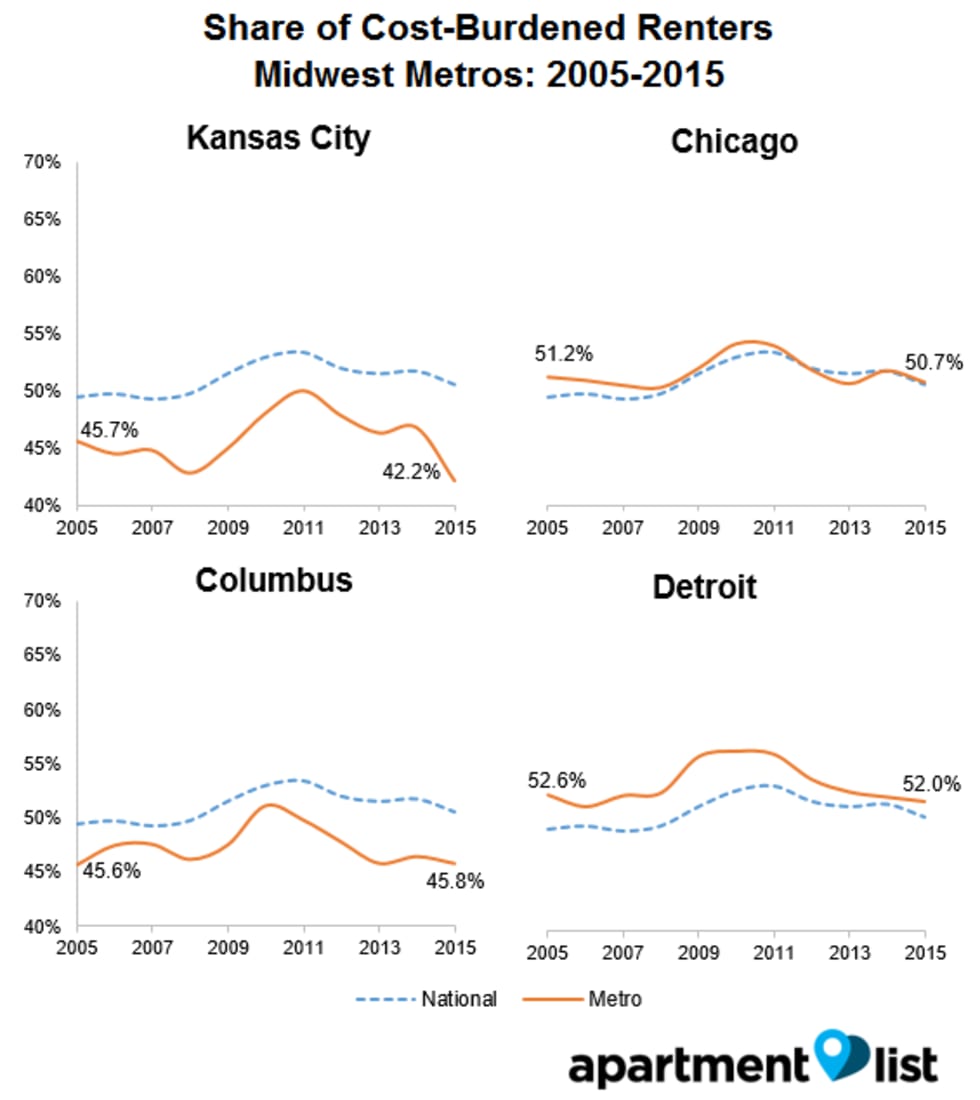
The picture is more mixed in the Midwest. Kansas City has the lowest share of cost-burdened renters out of nation’s the 100 largest metros, and Columbus is also well below the national average. In Chicago and Detroit, however, more than half of renters struggle with affordability.
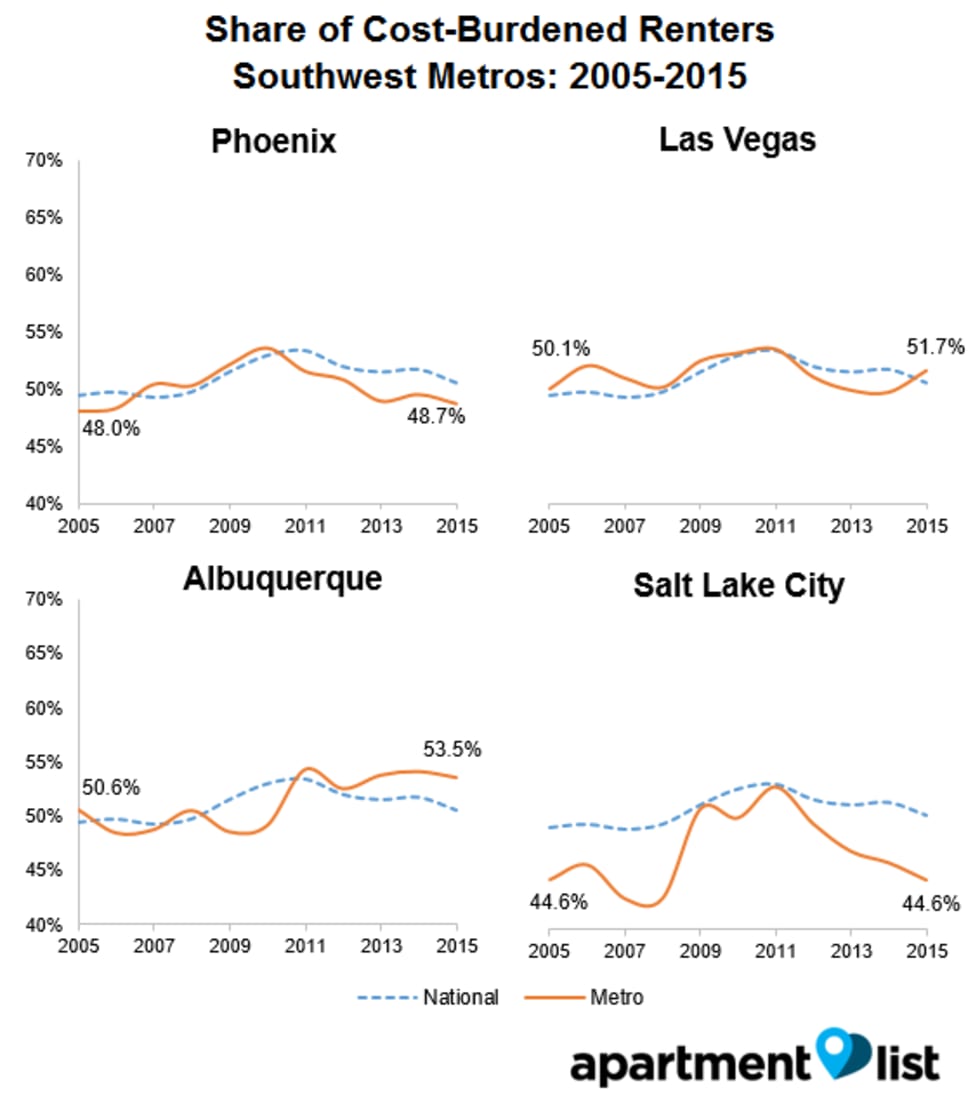
A similar situation can be seen in the Southwest. Phoenix and Salt Lake City are relatively affordable, but Las Vegas and Albuquerque have higher cost burden rates than the US as a whole.
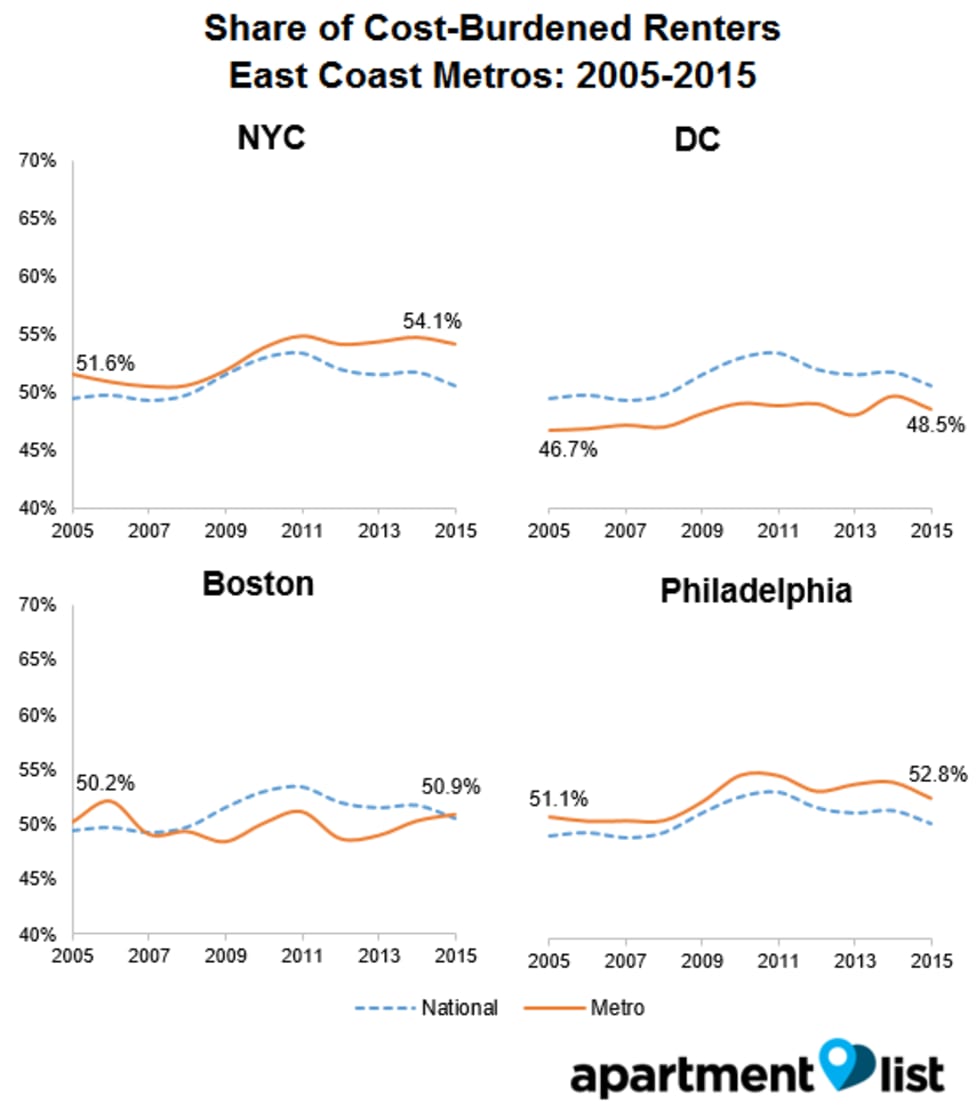
The major metros on the East Coast are known to have high rents, but stronger employment markets as well. DC, with its steady construction of new apartments, is the most affordable of the four, while NYC is the lease affordable.
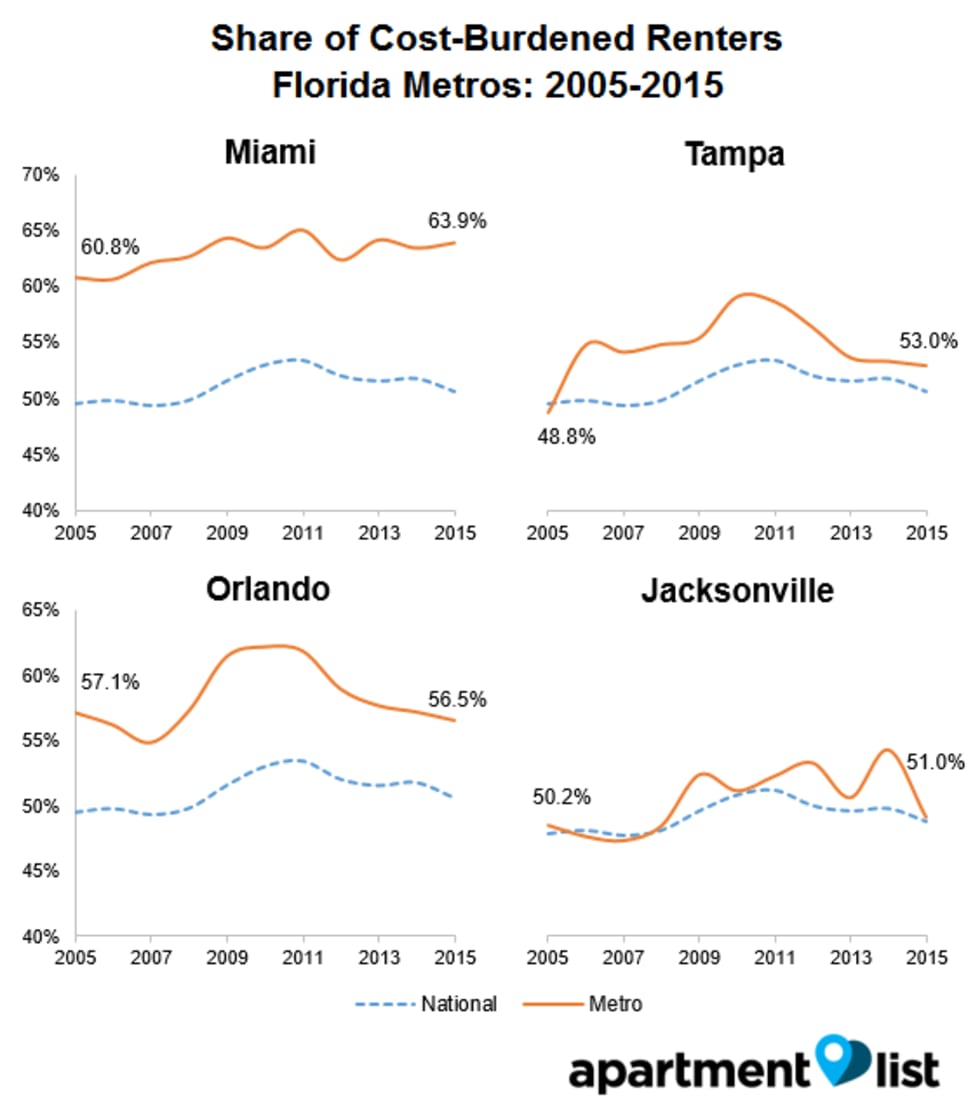
Several Florida metros struggle with affordability. Miami tops the 100 largest metros with the highest share of cost-burdened renters (63.9%). Also, despite improvements in Tampa, Orlando, and Jacksonville, all three remain more unaffordable than the national average.

Southern California is one of the most unaffordable regions in the US - each of the four metros have cost-burden rates of 56% or more. Most worryingly, affordability has not improved much in recent years, as wage growth fails to outpace rent increases.
Incomes and rents are key drivers of affordability
Earlier, we looked at how changes in rent and income drive affordability at the national level. Now, we study this dynamic for individual metros, comparing inflation-adjusted renter income and rent growth over the past decade:
In metros that fall above the dotted line, incomes have grown faster than rents; below the axis, the opposite is true. Individual marks are sized by population and shaded based on change in the cost burden rate: red indicates that the number of cost burdened renters in a metro has increased, while green indicates that it has decreased.
As seen above, cost burdens tend to decrease when income growth outpaces rent growth. Here are a few other observations:
- The upper right corner of the plot is filled mainly by cities with strong tech industries, where incomes have climbed sharply. Even though rents grew faster than incomes, cost burden rates have fallen.
- Rents have risen in Texas, by 10-20%, but incomes have generally kept up, resulting in improved rental affordability.
- Midwest metros such as Kansas City and Minneapolis have had somewhat slow wage growth, but with rents growing slowly or declining, they remain affordable places to live.
- Renters in NYC, Miami, Riverside, LA and San Diego struggle, as incomes have not kept pace with rents.
Rental affordability is improving, but has a long way to go
2015 marks the fourth consecutive year in which renter incomes increased faster than rents, reducing the share of cost-burdened renters nationwide. With more than 110 million renters nationwide, these changes - though small in percentage terms - can have meaningful impacts on the lives of Americans across the country. Improved affordability provides a host of benefits to renters, both tangible and intangible.
Our analysis also shows the importance of both wage growth and stable rents. Areas that had both (e.g., Texas metros) did the best, while those that had just one (tech hubs with strong incomes, or Midwestern cities with low rents) did reasonably well.
Despite the improvements, affordability continues to be a challenge for millions of renters. Even in relatively affordable metros, cost-burden rates are significantly higher than the nationwide average from fifteen years ago. If the situation does not improve in Florida and Southern California, renters may continue to migrate to cities on the interior in the coming years.
Share this Article
