Reconfiguring The American Household

- According to a new analysis of U.S. Census data, household composition - the way in which Americans organize themselves into households - is steadily changing.
- Young adults are becoming much less likely to share their home with a spouse or children; instead, they are moving back in with parents, or living with roommates and/or unmarried partners.
- 26-year-olds provide a stark example: 50 years ago, over three-quarters were married and living with their spouse; today, this living arrangement has shrunk to just 24 percent. In 2018, there were 300,000 more 26-year-olds living with parents than spouses.
- These trends mean that across the country, the nuclear family household is slowly disappearing. In 2018, the number of nuclear family households was the same as in 1984, when the United States population was 27 percent smaller. Nuclear families are becoming more expensive to maintain, and we see them declining in 20 of the nation's 25 largest metropolitan areas.
- Conversely, it is becoming much more common for multiple family units to live together under one roof. In some metros, these "unrelated" households have more than doubled since the start of the Great Recession.
- Social and economic forces are encouraging many Americans - particularly at the lower end of the income distribution - to band together and form larger households in order to afford their preferred housing.
Introduction
Choosing who to live with is one of the most important housing decisions we make. Should I move back home with mom and dad, or find roommates? Should I wait until marriage to move in with my significant other? If I look for an apartment with my sister and her husband, could we all share a nicer place? Researchers (including us) often analyze household-level data to learn about housing markets, but how do people sort into households in the first place? Household composition both shapes the demand for housing and adapts to housing availability.
The American household has been gradually evolving for decades — growing and diversifying. We analyze data from fifty years of the Census Bureau’s Current Population Survey to understand how shifts in cultural norms and economic conditions have influenced who lives together. These trends provide context and clues for what may happen next, as urban affordability becomes more scarce and coliving spaces make a push for the mainstream. Signs point to a future where there is really no such thing as a typical household.
Adults in Their Mid-20s Are Now More Likely to Live with a Parent Than a Spouse
In the 1960s, the vast majority of young adults in America lived with their spouse. Today, that is far from the case. The interactive chart below visualizes how living arrangements have changed over the last five decades. These arrangements include: living alone, with a married spouse, with an unmarried partner, with a parent, or with a non-family roommate. 1 The lines represent the likelihood that people of a certain age live in a certain type of household. Moving the slider changes the age of interest.
Download Complete Living Arrangements Data
As marriage rates continue to drop, the likelihood that young Americans live with a spouse has been in steady decline. Meanwhile, living with parents is becoming increasingly common for adults as they age into their late twenties and early thirties. Other household choices, such as living with roommates, living alone, or living with an unmarried partner, are also on the rise. Millennials today live in a much more varied range of household types than their predecessors did in young adulthood.
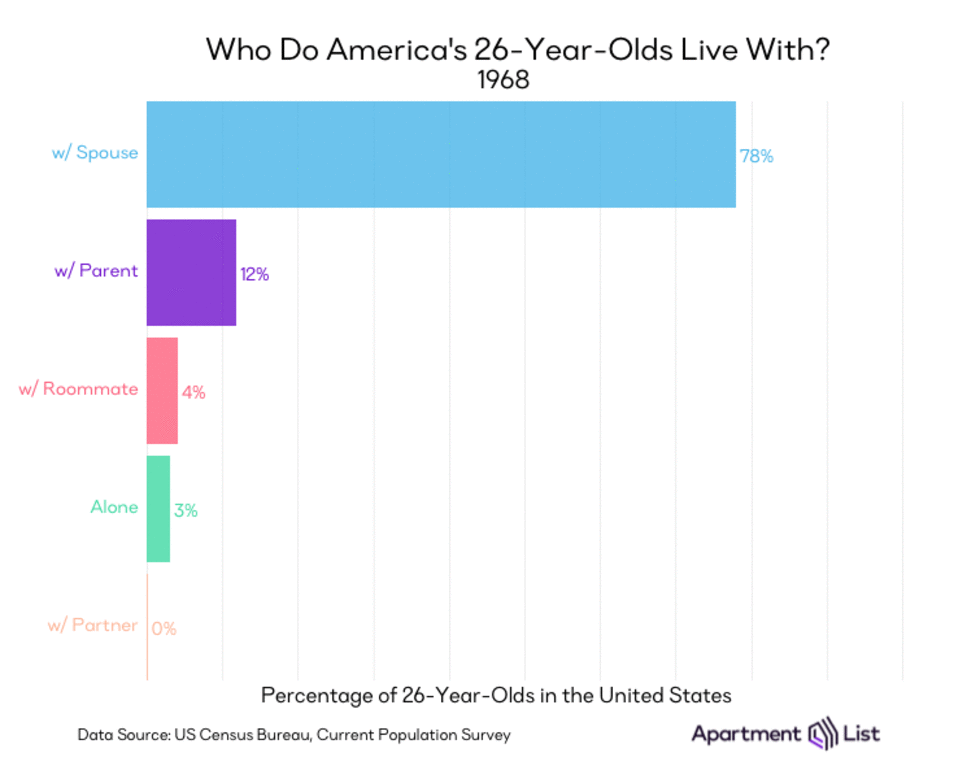
Tracking 26-year-olds provides a particularly striking example of how young adult living arrangements have shifted over time. Fifty years ago, 76 percent of 26-year-olds were married and cohabitating with spouses. Today, that share has plummeted to just 24 percent. Simultaneously, the share living at home has steadily risen, so that by 2018 there are over 300,000 more 26-year-olds living with parents than spouses. Meanwhile, living alone, living with roommates, and living with an unmarried partner have also become more common. Each of these arrangements represented fewer than 5 percent of 26-year-olds in the late 1960s, but today, 10 percent live alone, 15 percent live with a non-family roommate, and 17 percent live with an unmarried partner.
Since the Great Recession, Living with Parents, Roommates, or Unmarried Partners Has Become Much More Common for Young Adults
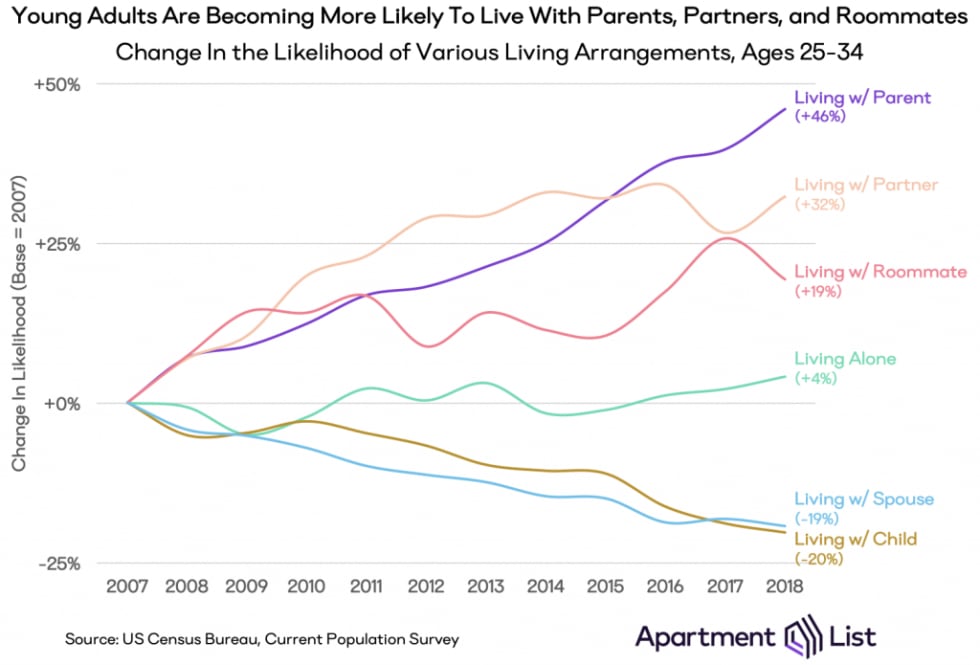
The story of 26-year-olds, and of young adults in general, highlights the economy’s influence on how people arrange themselves into households. Starting with 2007 - the year before the collapse of the housing market bubble - we see the beginning of a steady divergence in young adult housing composition that has continued to the present-day. This is a period characterized by economic recession, ballooning student debt, and even as the economy recovered, a dearth of affordable housing options in the cities with the best job opportunities. All of these factors put downward pressure on young adults who, in previous generations, would have been ready to start their own households. Instead, 25-34-year-olds 2 today are 46 percent more likely to live with a parent than in 2007, 32 percent more likely to move in with a partner before getting married, and 19 percent more likely to have a non-family roommate. In contrast, the likelihood of living with a spouse or a child have declined steadily, as cultural norms around marriage and education have encouraged millennials to start families later in life.
Unrelated Households Are on the Rise While Nuclear Family Homes Are Becoming Less Common
As young adults form households with roommates, partners, and parents, we observe broader changes in the overall household composition of many American cities. To measure this shift, we developed a framework for categorizing every American household according to the relationships among its members. Single-person households represent adults living on their own. In related households, all members are related to one another by blood, marriage, adoption, or partnership. This includes married and unmarried couples living together, nuclear families, and other single-family arrangements. Unrelated households are multi-person households in which at least one member is not related to the others. This includes the classic roommate arrangement or family members who share their homes with an unrelated housemate.
The total number of households in the United States rose 10 percent from 2007 to 2018, reaching a peak of 127.5 million. Related households comprise the vast majority but are the slowest-growing group (7 percent growth), growing half as quickly as single-person households (15 percent) and one-third as quickly as unrelated households (22 percent). The table below allows you to compare national trends to those of the 25 largest metropolitan areas across the country.
Download Complete Metro-Level Data
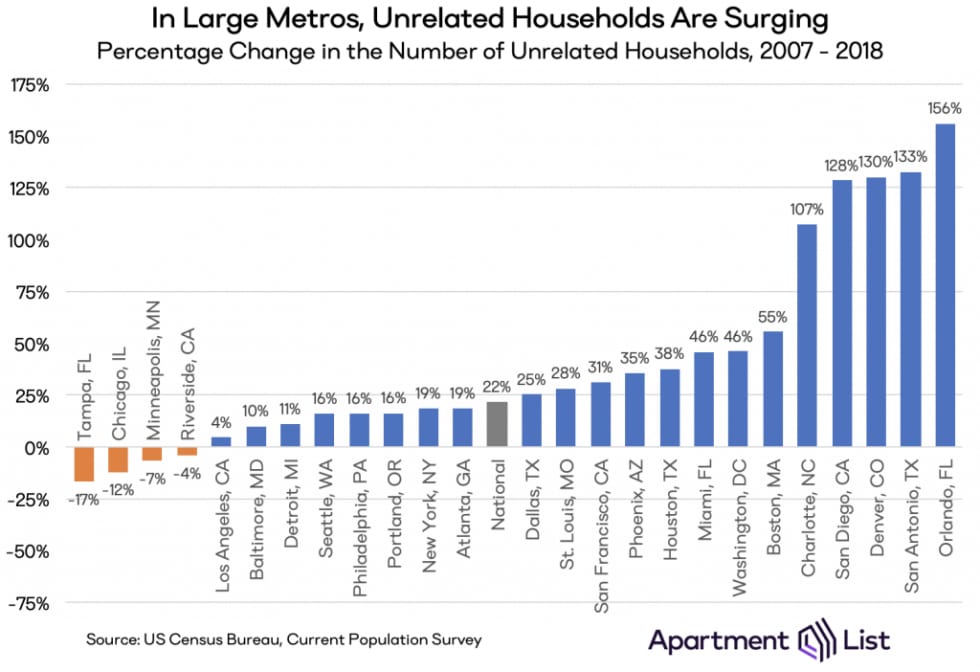
For most metros, one trend is consistent: unrelated households are becoming increasingly common as more people find it culturally acceptable and economically viable to share their home with non-family members. Of the 11.6 million new households formed since 2007, nearly half of them have unrelated housemates living together. And in five particular metros - Orlando, San Antonio, Denver, San Diego, and Charlotte - the number of unrelated households has more than doubled in the last twelve years. In fact, only four of the 25 largest metros experienced a drop in this household type.
The other eye-popping trend is that while unrelated households are on the rise, there are over 1 million fewer nuclear family households today than in 2007. This household type represents the archetypal American home: a married couple and their children, all living together under one roof.3 In our framework, it is the only household arrangement to shrink over time, and it is doing so at a staggering rate. 50 years ago, 42 percent of all American households were nuclear families; today, they comprise only 22 percent. And in 2018, there are roughly the same number of nuclear family households as in 1984, when the total United States population was 27 percent smaller. This decline is driven by two factors: 1) lower marriage and fertility rates leading to fewer nuclear families altogether, and 2) a greater percentage of nuclear families sharing their homes with non-nuclear housemates.4
![]()
From 2007 to 2018, the prevalence of nuclear family households dropped in 20 of the nation’s 25 largest metropolitan areas. In Southern California, Riverside metro once had the highest nuclear family rate in the nation before falling almost 8 percentage points. Nearby Los Angeles and San Diego metros also experienced declines, as did Boston (-7 percent), Denver (-6 percent), St. Louis (-5 percent), Atlanta (-4 percent), New York (-4 percent) and Philadelphia (-3 percent). Baltimore and Houston are the only metros posting a notable increase in the share of nuclear family households (+3 percent and +1 percent, respectively).
High Housing Costs Are Fueling the Rise of Larger, Unrelated Households
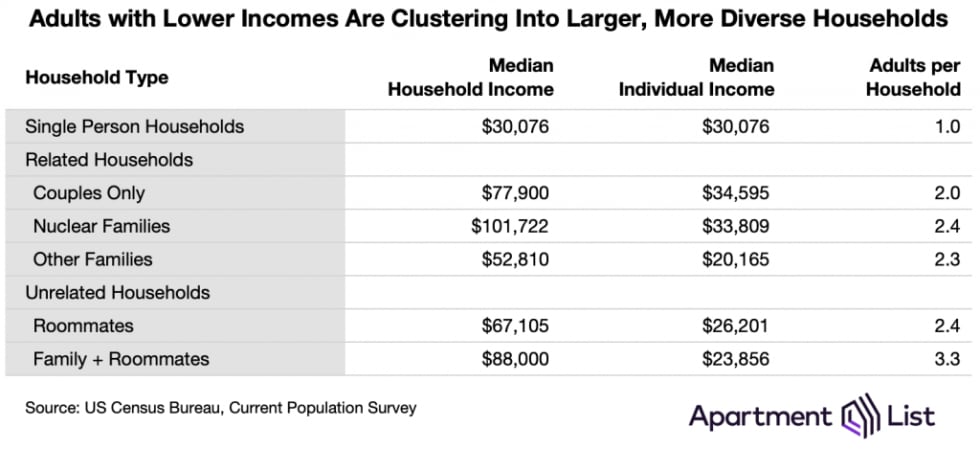
In many markets, nuclear household formation may be declining because the cost is becoming prohibitive. In 2018, the median nuclear family’s household income was $101,722, well above the national median of $63,179. As housing costs rise faster than incomes, wealthier families can maintain this household type without the support of supplemental income from non-nuclear housemates. But not all are so fortunate; nearly 15 percent of nuclear families live with a roommate or additional family member. And for those at the lower end of the income distribution, we see individuals (and families) banding together to afford their preferred housing. The table below compares median household and individual incomes,5 along with the average number of adults, for each household type. Personal incomes are highest for nuclear families and couples or individuals who live on their own. Incomes are much lower for those who share their housing with roommates and/or non-nuclear family members. Specifically, in Family + Roommate households, personal incomes are low while household incomes are high because these households have, on average, one extra adult contributing to the total income.
What's Next?
Going forward, we expect these trends to continue. Housing costs are rising quickly, especially in booming, urban job hubs and for those at the lower end of the income distribution. As rents continue to go up, roommates and coliving arrangements become even more appealing and we expect to see households grow or merge to afford available housing. Families, meanwhile, increasingly welcome relatives (and strangers) into their households. Moreover, as certain household arrangements become more common, stigma around them likely dissipates. It gets easier to move back in with mom and dad well into adulthood when the entire friend-group already has.
The diversification of the American household may also, in time, shape what our housing looks and feels like. As more people both search for roommates or choose to live alone, a wave of coliving companies is betting on shared living spaces. Growth in the popularity and policy relevance of accessory dwelling units (ADUs) mirrors the rise in large related or unrelated households. Homebuyers are starting to seek out homes that provide home sharing opportunities. If there is increasingly no such thing as a typical household, we soon won’t recognize a typical home either.
- These arrangements are not mutually exclusive; someone may live with both a spouse and a roommate.↩
- This definition of young adulthood is consistent with reports from the US Census Bureau, since this is the age range in which many Americans have finished school, find a job, and form households.↩
- A married couple with step-children or adopted children is considered a nuclear family. An unmarried couple living with children is not.↩
- This includes unrelated housemates as well as family members outside the nuclear unit (e.g., grandparent, aunt, etc.)↩
- Individual incomes are only considered for adults ages 18 and over.↩
Share this Article