$1,150
111 Belle Street, Columbus, OH 43215(380) 333-9602Rent Savings
- 19 units available
- Studio • 1 bed • 2 bed
- Amenities
In unit laundry, Nest technology, Patio / balcony, Dishwasher, Pet friendly, New construction + more
Verified listing
Verified

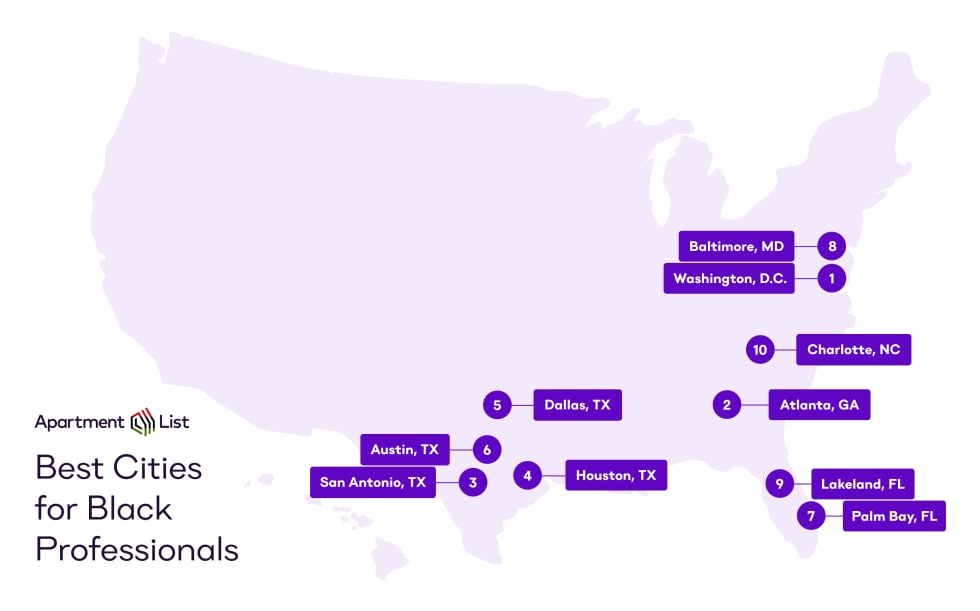
The best cities for Black professionals based on our comprehensive metrics are Washington, D.C., Atlanta, San Antonio, Houston, and Dallas. We partnered with Apartment List’s Black employee resource group (ERG), Black@A-List, to create this data-driven report that uncovers the best cities for Black professionals.
While the “best” place to live is ultimately subjective, we developed a comprehensive scoring system that considers a wide range of factors—from basic demographics like income levels and population distribution to lifestyle indicators, such as the percentage of Black teachers and doctors in a city. Read on to explore our methodology, discover how we selected our top five cities, and learn how to access and review the full dataset yourself.
Black@A-List came together to outline key components that would be relevant to Black professionals looking for a great city to live in. We sought to count metrics that reflect the lived experiences of members of the African diaspora who have graduated from college and are part of the workforce.
The essential urban features for a great community that our team landed on ultimately fell into four broad categories: (1) community and representation, (2) economic opportunity, (3) housing opportunity, and (4) business environment.
These four scores, along with the individual statistics that comprise them, are weighted and summed to yield a final composite score ranging from zero to 10. Lower scores indicate a combination of less Black representation, worse economic outcomes for Black households, and greater economic gaps between Black and non-Black individuals.
We acknowledge that this ranking will capture some but not all of the socioeconomic inequalities that exist between races and locations throughout the United States. For a more detailed examination of the numbers behind the rankings, refer to the data section below.
This score identifies regions that have a sizable (and growing) Black community that is well represented in various key occupations. This score considers the share of a city’s population who are Black, whether the Black population has increased or decreased over the past decade, and whether the Black community is proportionally represented in the teachers, doctors, lawyers, and managers who live there.
The economic opportunity score identifies strong job markets that offer competitive wages for Black professionals. This score considers the employment rate and college graduation rate among Black adults, the median income of Black workers, and income equity—the ratio of Black incomes to non-Black incomes.


The housing opportunity score measures affordability and equity within local housing markets. This score considers the Black homeownership rate, how it compares to that of non-Black households, and the Black cost burden rate, which is the percentage of Black households that spend more than 30% of their monthly income on housing costs.
Business environment measures the percentage of local businesses that are Black-owned, and, similar to the community and representation score, whether the Black ownership is proportional to the overall Black population.


We analyzed more than 80 cities to determine the best cities for Black professionals:

Coming in first place is Washington, D.C. With a final score of 70.78, D.C. is the best city for Black professionals. It ranks well on all scores, holding the No. 1 position for economic opportunity, No. 3 for housing opportunity, and No. 5 for business environment. D.C.’s lowest ranking is for its community and representation, which ranks No. 16.
Home to two historically black colleges and universities (HBCUs), Howard University and the University of the District of Columbia, it’s no surprise that over one-third of the region’s Black population has a college degree, well above average. Combined with a strong job market (92% of Black residents are employed), the median income among D.C.’s Black population is higher than anywhere else in the country, at $52,988.
D.C. is also a great place to be for entrepreneurs, and just over one-quarter of businesses in D.C. are Black-owned. You can pick up a new novel at MahoganyBooks, grab some fresh flowers at Lee’s Flower Shop, or get in a hard workout at Cut Seven.
Homeownership is a major contributor to racial wealth disparities in the United States. Nationally, the Black homeownership rate trails all other racial groups and is over 30 percentage points lower than that of white non-Hispanics. In D.C., the gap for Black homeownership relative to the population is 17%. At the same time, 51% of Black households own their homes, putting them at No. 3 on our list for homeownership.
| Washington, D.C. | Percentage |
|---|---|
| Black Population Share | 28% |
| Black Homeownership | 51% |
| Black Teachers | 22% |
| Black Doctors | 30% |
| Black Lawyers | 13% |
| Black Managers | 21% |

Atlanta is awarded second place for the best cities for Black professionals with a final score of 70.59. Atlanta ranks well for most factors, such as No. 1 for community and representation, No. 10 for housing opportunity, No. 11 for economic opportunity, and No. 2 for its business environment.
Atlanta is known for its Atlanta University Center, which is the consortium of four HBCUs: Clark Atlanta University, Morehouse College, Morehouse School of Medicine, and Spelman College. This density of HBCUs may explain why Atlanta is home to a large Black community (36% of all residents) with a high share of adults holding a bachelor's degree (34%).
The median income in Atlanta is $42,156 per year, which is lower than in Washington, D.C., but it is more closely aligned with non-Black incomes in the area. Furthermore, the employment rate for Black residents is 93%.
Atlanta boasts both a large and growing Black population of 36%. According to our analysis, the population is growing at one of the highest rates in the country—second only to Las Vegas—signaling an increasingly robust business climate. Black-owned businesses are quite common in Atlanta, at a 37% share. Catch a Southern meal at the Atlanta Breakfast Club, go skating at Cascade Skating, or pick up some tea at Just Add Honey Tea Company.
Lastly, 50% of the Black population in Atlanta is homeowners. Similar to D.C., the cost burden is lower than the rest of the country at 41%.
| Atlanta | Percentage |
|---|---|
| Black Population Share | 36% |
| Black Homeownership | 50% |
| Black Teachers | 34% |
| Black Doctors | 33% |
| Black Lawyers | 22% |
| Black Managers | 26% |
Moving to the Lone Star State, three Texas cities rank in our top five. San Antonio comes first, with a final score of 63.09 and top-10 rankings in economic opportunity (No. 2) and community and representation (No. 10). It also has a moderate score for housing opportunity (No. 11) and business environment (No. 20).
Compared to other cities, San Antonio’s Black population is relatively small, accounting for 9% of all residents, which is around half of the average. However, the local Black employment rate is relatively high (94%). The median income in San Antonio for Black individuals is $41,926, which is only slightly lower than Atlanta's $42,156 per year.
On the other hand, the share of Black graduates is high at 31%. After Alabama, Texas has the second-highest number of HBCUs. While the state itself is an HBCU powerhouse, St. Philip's College is the only one of its kind in San Antonio. This may explain why the share of professionals is lower compared to our other top two cities.
Despite this, there are still plenty of Black-owned businesses to support in San Antonio. Start your day off by taking a boxing class at Black Stallion Boxing Plus. Stop for a hefty portion of lunch at the Jerk Shack, a hot spot for Jamaican cuisine. Then take a class or enjoy a performance at the San Antonio Ballet School, designed to cultivate the art of dance among future generations.
While the Black homeownership rate is relatively high at 44%, the gap compared with non-Black homeownership remains substantial, trailing by 20%. Perhaps this could be explained by San Antonio’s overall homeownership rate, which is also lower than the state’s average. Additionally, the lower homeownership gap could also explain why the cost burden rate is lower than average at 43%.
| San Antonio | Percentage |
|---|---|
| Black Population Share | 9% |
| Black Homeownership | 44% |
| Black Teachers | 8% |
| Black Doctors | 8% |
| Black Lawyers | 9% |
| Black Managers | 7% |

Keeping our focus on Texas, the next city on our list is Houston, in fourth place. With a final score of 62.32, Houston boasts a strong business environment score (No. 3 in the nation), community and representation score (No. 4), and economic opportunity score (No. 10). But higher housing costs hurt Houston’s housing opportunity score, which ranks No. 23. Additionally, 45% of Black households in Houston spend more than 30% of their income on housing expenses, up 3% from 2019.
Although Houston ranks lower overall in terms of Black population share at 19%, it has a larger Black population than nearby San Antonio. Furthermore, the community is well represented in some critical occupations: 21% of teachers are Black, as are 21% of doctors. Houston is also home to the HBCU Texas Southern University, which helps boost the job market, as the median Black income is several thousand dollars above the average.
Similarly, 21% of local businesses are Black-owned, more than in any other part of Texas, which represents a 2% increase since last year. From the Mitochondria Gallery to Wanderstay Boutique Hotel and Wisdom Vegan Bakery and Café, Houston has it all.
| Houston | Percentage |
|---|---|
| Black Population Share | 19% |
| Black Homeownership | 42% |
| Black Teachers | 21% |
| Black Doctors | 21% |
| Black Lawyers | 14% |
| Black Managers | 14% |

After briefly getting knocked out of fifth position last year, Dallas is back in our No. 5 spot this year, knocking Palm Bay, Florida, out of our more recent top rankings. With a final score of 58.99, Dallas rose in position due to its No. 5 ranking for the Black community and representation, as well as its No. 7 ranking for both business environment and economic opportunities for Black professionals. However, it only saw a No. 39 ranking for housing opportunities for Black professionals.
Compared to other Texas metros, Dallas is more expensive than other areas, but it also offers a promising job market, which could make it easier for Black professionals to find promising career opportunities. Currently, Dallas holds a 93% Black employment rate and a $43,632 median income for Black professionals, which, while higher than many metro areas, is still significantly lower than the median U.S. household income.
Similar to Houston, Dallas also ranks lower overall in terms of Black population share, at 18%. Although there was a decline in the share of careers held by Black lawyers, teachers, and managers, the share of businesses owned by Black individuals climbed to 19%, reflecting a 1% increase since last year. From the Pan-African Connection Bookstore and Resource Center to soul food at Brunchaholics, Dallas offers something for everyone.
| Dallas | Percentage |
|---|---|
| Black Population Share | 18% |
| Black Homeownership | 38% |
| Black Teachers | 15% |
| Black Doctors | 18% |
| Black Lawyers | 9% |
| Black Managers | 12% |

| City | Black Population Share | Homeownership Rate | Black Employment Rate | Share of Teachers Who Are Black | Share of Doctors Who Are Black |
|---|---|---|---|---|---|
| Washington, D.C. | 28% | 51% | 92% | 22% | 30% |
| Atlanta | 37% | 50% | 93% | 34% | 33% |
| San Antonio | 9% | 44% | 94% | 8% | 8% |
| Houston | 19% | 42% | 91% | 21% | 21% |
| Dallas | 18% | 38% | 93% | 15% | 18% |
The best cities for Black professionals include Washington, D.C., Atlanta, and San Antonio, Houston, and Dallas.
Use the table below to compare the cities and their respective scores. Below the Rankings table, you will find more granular information about the data and how our scores were calculated.
Use the table below to compare the cities and their respective scores. Below the Rankings table you will find more granular information about the data and how our scores were calculated.
| Rank | City | Final Score |
|---|---|---|
| 1 | Washington, DC | 70.8 |
| 2 | Atlanta, GA | 70.6 |
| 3 | San Antonio, TX | 63.1 |
| 4 | Houston, TX | 62.3 |
| 5 | Dallas, TX | 59.0 |
| 6 | Austin, TX | 58.7 |
| 7 | Palm Bay, FL | 58.4 |
| 8 | Baltimore, MD | 57.9 |
| 9 | Lakeland, FL | 57.8 |
| 10 | Charlotte, NC | 57.3 |
| Rank | City | Community & Representation | Economic Opportunity | Housing Opportunity | Business Environment |
|---|---|---|---|---|---|
| 1 | Washington, DC | 17 | 1 | 3 | 8 |
| 2 | Atlanta, GA | 1 | 9 | 9 | 2 |
| 3 | San Antonio, TX | 9 | 3 | 13 | 28 |
| 4 | Houston, TX | 2 | 11 | 28 | 5 |
| 5 | Dallas, TX | 5 | 7 | 43 | 7 |
| 6 | Austin, TX | 29 | 2 | 32 | 35 |
| 7 | Palm Bay, FL | 31 | 45 | 1 | 19 |
| 8 | Baltimore, MD | 16 | 12 | 22 | 25 |
| 9 | Lakeland, FL | 13 | 36 | 12 | 6 |
| 10 | Charlotte, NC | 10 | 20 | 15 | 26 |
A total of 76 locations were included in this analysis. For individual factors (e.g., employment rate, median income), weights, and data sources, please view the complete data.
Each factor was converted into a normalized score from 0 to 100 according to the distribution of values across locations. Normalized scores were then weighted and summed to give every location a final composite score between 0 and 100. A score of 100 would mean a location ranked first in every individual factor in the analysis.
We wrote this report in collaboration with the Apartment List Black ERG, also known as, "Black@A-List". Pictured below are a few of those employees who helped us with this report!
Employee Resource Groups (ERGs) at Apartment List are meant to serve as a safe space for Apartment List employees. They meet frequently to chat about their shared experiences, plan company-wide events, and form allyship across the company. Apartment List has 5 different ERGs that each represent a different identity group: Black, Asian, Latinx, Women, and LGBTQ+.


In unit laundry, Nest technology, Patio / balcony, Dishwasher, Pet friendly, New construction + more
In unit laundry, Patio / balcony, Pet friendly, Stainless steel, Walk in closets, Gym + more