Red vs. Blue States: Which are More Affordable for Renters?

Apartment List recently analyzed Census data to understand how rental affordability varies across the United States. With the presidential primary season upon us, we were curious to know whether Democrat or Republican states were more affordable for renters. Rents tend to be much higher on the Democrat-leaning coasts, but incomes there are higher as well_—_in fact, San Francisco has the lowest share of cost-burdened renters of the 50 cities in our study. What does the data say?
Data and Methodology
To get an answer, we first created a political affiliation index using voting trends and history in all 50 states. Our index factors in votes from recent presidential elections, the breakdown of Senate and House delegations, and the parties of the past three governors. Idaho, Utah, and Mississippi were most red, and Delaware, Oregon, and New York were most blue. In all, we had 27 Republican- and 23 Democrat-leaning states.
Next, we combined our political affiliation index with median renter income, rents, and cost-burden rates from the Census. We then compared red and blue states on a population-weighted basis, to determine which group was more affordable for renters to live in. Additional data is included at the end of the article, but for now, on to the results!
Democrat-Leaning States are Much More Expensive for Renters
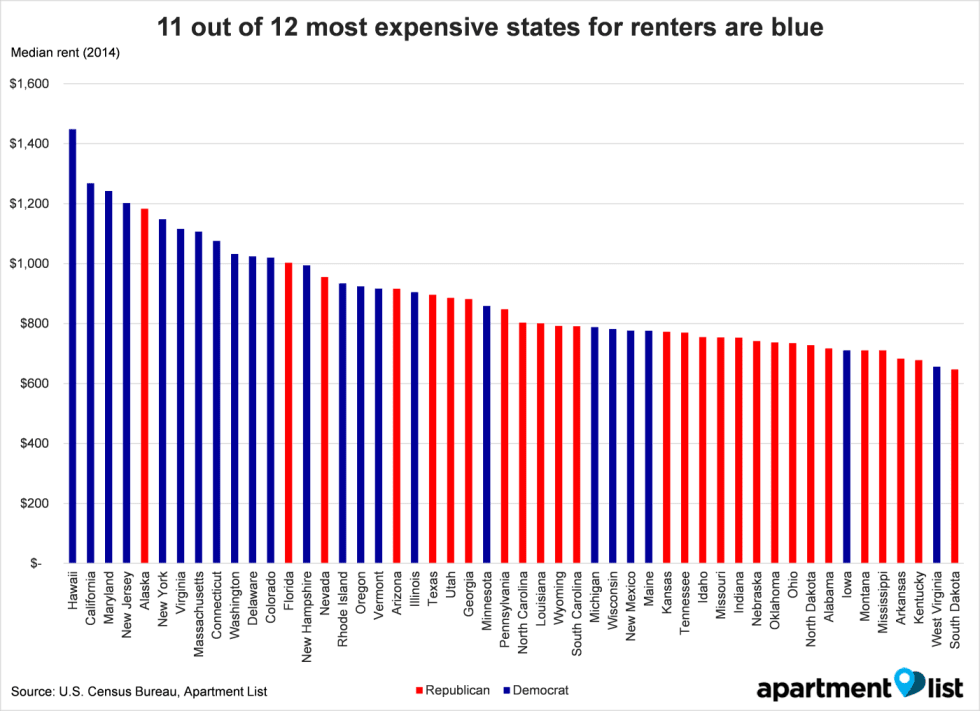
First off, Democrat-leaning states are much more expensive. With the exception of Alaska, the twelve most expensive states in the US are all blue. The median rent in Hawaii, the most expensive state, was $1,448 in 2014, or 55% more than the national average. On a population-weighted basis, the median rent in blue states was $1,073, compared to $837 for red states - a $236 difference each month! That's enough for two ski passes or even a plane ticket for a weekend getaway.
On the flipside, Republican states account for all but two of the 17 lowest-rent states. In some ways, this is not surprising - Republican strongholds are located in the middle of the country, where rents are generally lower. Popular states like Hawaii and California experience higher rents, but it may be possible that renters there make enough to afford the expensive rents. With that in mind, we looked at median renter incomes across states to see how they compare.
Renter Incomes are Much Higher in Democrat-Leaning States
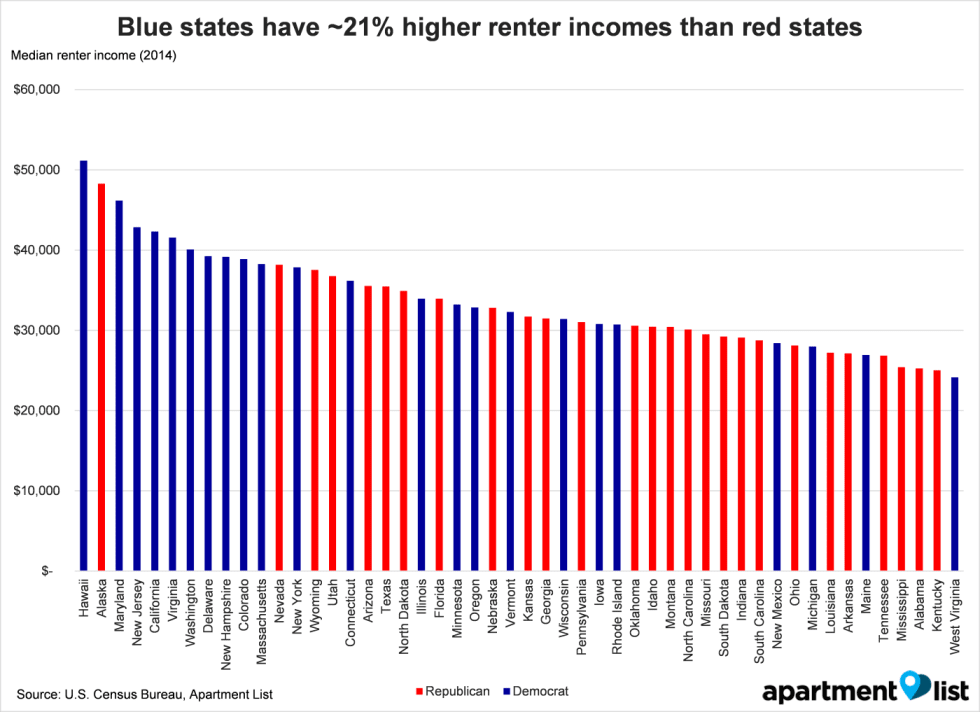
Looking at the data, we see that median renter incomes are significantly higher in Democrat-leaning states. The median income in blue states was $37,945 in 2014, which was 21% higher than the median income of $31,430 in red states. Alaska is the only Republican state in the top ten highest earning states, whereas red states account for 15 of the 20 states with the lowest renter incomes.
With the knowledge that blue states are more expensive but also bring in higher median incomes, we looked at the cost-burden rates of each state to determine which states were most affordable. (As a reminder, a cost-burdened renter is one who spends more than 30% of their income on rent.) Since this metric is based on both income and rent, it can provide a clearer picture of where renters struggle the most with affordability.
8 Out of 10 Most Unaffordable States for Renters are Democrat-Leaning
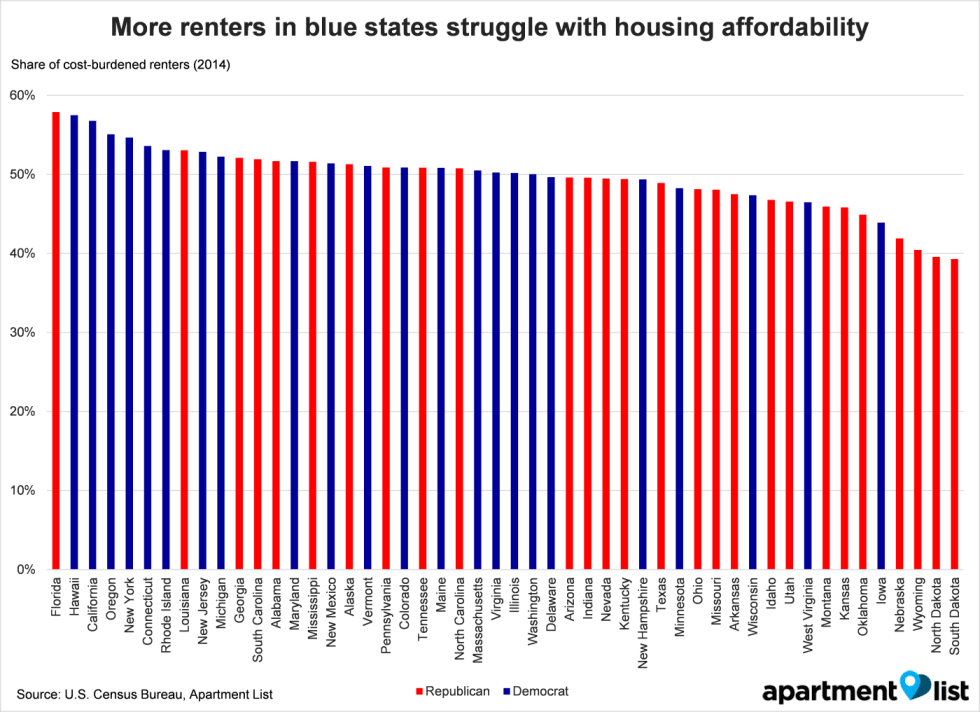
The results were a little surprising. With blue states having both higher rents and incomes and red states having lower rents and incomes, we expected blue and red states to have roughly equal cost-burden rates, but that wasn't the case. 8 of the 10 most unaffordable states were blue, with Hawaii, California, and Oregon all having cost-burden rates of more than 55%. On a population-weighted basis, blue states have a 52.7% cost-burden rate, which is 2.3% higher than red states (50.4%).
On the Republican side, Florida has the unfortunate claim of being the most unaffordable state overall, with a 58% cost-burden rate. Overall, however, red states are significantly more affordable. 17 of the 23 states with cost-burden rates below 50% lean Republican, with North Dakota, South Dakota, and Wyoming leading the charge.
Conclusion
We're wary of drawing too many conclusions from this data, as it is difficult to determine which direction the causality flows. The key driver here may be geography rather than ideology - after all, Florida, Hawaii, and California are most unaffordable, and states further inland seem to do a bit better. On the margin, however, the data does suggest that red states are more affordable - for example, Utah renters do better than Colorado, and Ohio better than Michigan. Also, rents are increasing more quickly in blue states - they rose by 20% from 2007-2014, and only 17% in red states.
Ultimately, housing affordability is a challenge that renters nationwide face - the nationwide share of cost-burden renters was under 40% just fifteen years ago, and today almost every state is above that mark. The economic recovery has helped, but there is clearly work that remains for us to make renting more affordable across the board. As always, if you are looking for the perfect place to live, Apartment List is here to help!
| State | Political affiliation | Population | Median rent | Median renter income | Share of cost-burdened renters |
|---|---|---|---|---|---|
| Florida | Republican | 19,893,297 | $1,003 | $33,949 | 57.9% |
| Hawaii | Democrat | 1,419,561 | $1,448 | $51,145 | 57.5% |
| California | Democrat | 38,802,500 | $1,268 | $42,305 | 56.8% |
| Oregon | Democrat | 3,970,239 | $924 | $32,847 | 55.1% |
| New York | Democrat | 19,746,227 | $1,148 | $37,836 | 54.7% |
| Connecticut | Democrat | 3,596,677 | $1,076 | $36,177 | 53.6% |
| Rhode Island | Democrat | 1,055,173 | $934 | $30,718 | 53.1% |
| Louisiana | Republican | 4,649,676 | $801 | $27,206 | 53.1% |
| New Jersey | Democrat | 8,938,175 | $1,202 | $42,840 | 52.9% |
| Michigan | Democrat | 9,909,877 | $788 | $27,978 | 52.3% |
Share this Article


