Renting in the United States - 2017 Year in Review

After more than a decade of declines, the U.S. homeownership rate appears to have stopped falling and even increased slightly in 2017
Rental affordability improved as renter income growth outpaced the growth of rents, but in addition to existing renters’ income gains, this trend also appears to be driven by an inflow of high-income households into the renter pool
The large number of new multifamily units completed in 2017 is beginning to soften rent growth, a trend expected to continue into 2018
Despite the increase in the overall rental stock, the shortage of rentals affordable to lower-income renters persists
Over the past year, the Apartment List Rentonomics team published research on issues relevant to renters, journalists and policymakers. We explored a wide-range of topics, including the rent impact of Amazon HQ2, the best metros for millennials and a comparison of government housing expenditures for renters versus homeowners. We also revamped our rent report methodology to ensure we provide the most accurate rent estimates available. To conclude the year, our team analyzed the most important trends in the housing market in 2017 and predicted their impacts in 2018.
U.S. Homeownership Rate Bottomed Out and Increased Slightly in 2017
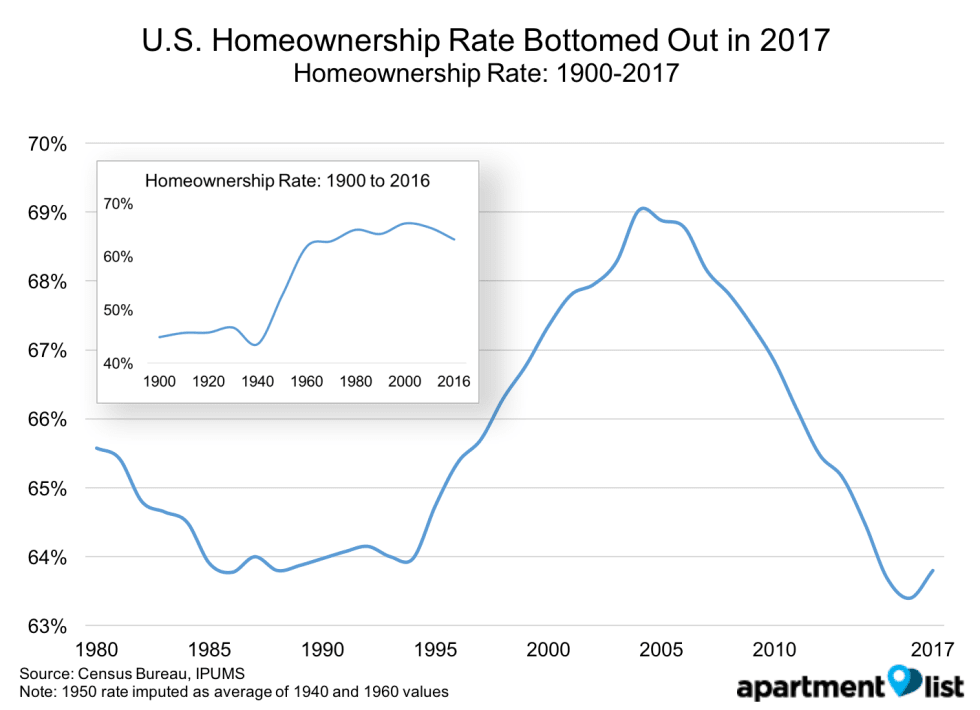
After years of decreases from the 2004 high of 69.2 percent, the homeownership rate appeared to have bottomed out, with a slight increase in 2017. In the second quarter of 2016, the homeownership rate hit 62.9 percent. This is the lowest homeownership rate since 1965, but still significantly higher than at the first half of the 20th century when the homeownership rate was well under 50 percent. The homeownership rate increased to 63.9 percent in the third quarter of 2017, the highest rate since 2014. The homeownership rate is expected to stabilize next year, or potentially increase slightly, as more millennials purchase homes. The lack of supply of homes for sale and, in particular, starter homes for first-time buyers is likely to prevent large increases in the homeownership rate over the next couple of years.
From 2005 to 2016, the number of renter households increased by 19.2 percent from under 37 million to nearly 44 million. In comparison, the number of owner households increased 0.9 percent from 74 million to 75 million. Despite a predicted decrease in the share of renters due to increasing homeownership rates, the overall number of renter households will likely continue to grow as new millennial households enter the rental market.
Overall Rental Affordability Improvements Driven by Increase In Share of High-Income Renters

The share of cost-burdened renters modestly decreased from 50.6 percent in 2015 to 49.7 percent in 2016, reaching the lowest level since 2008, before the Great Recession. The decrease is driven by renter income growth outpacing rent growth over the past five years. Unfortunately, the increase in renter incomes is at least partially the result of a change in the composition of the renter population, whereby high-income renters remain in the pool for longer as they delay homeownership, and lower-income renters exit a rental market by doubling up with family or moving to cheaper areas. From 2005 to 2016, the share of high-income renters, defined as those earning over 120 percent of the Area Median Income (AMI), increased by 4.2 percentage points, and the share of low-income renters decreased by roughly the same amount. This figure is even starker in some metros, including San Francisco, Riverside and Denver, where the share of high-income renters increased by 6.6 percent, 6.2 percent and 5.7 percent, respectively.
According to research from the Harvard Joint Center for Housing Studies, the share of high-income households, defined as those earning over $100,000 per year, renting rather than owning homes, increased from 12 percent in 2005 to 18 percent in 2016. Future increases in the homeownership rate will likely be driven by high-income renters purchasing homes, which may hurt overall affordability figures.
| Metro | Population | Change in Share of Low-Income Renters | Change in Share of Middle-Income Renters | Change in Share of High-Income Renters |
|---|---|---|---|---|
| New York, NY | 8175133 | -2.2% | -0.3% | 2.5% |
| Los Angeles, CA | 3792621 | -2.0% | -0.1% | 2.1% |
| Chicago, IL | 2695598 | -5.3% | 0.6% | 4.7% |
| Houston, TX | 2099451 | -4.1% | 0.9% | 3.2% |
| Philadelphia, PA | 1526006 | -2.2% | 0.0% | 2.2% |
| Phoenix, AZ | 1445632 | -5.3% | -0.1% | 5.4% |
| San Antonio, TX | 1327407 | -5.9% | 1.8% | 4.0% |
| San Diego, CA | 1307402 | -4.0% | -0.6% | 4.5% |
| Dallas, TX | 1197816 | -4.9% | 1.7% | 3.3% |
| Honolulu, HI | 956377 | -2.5% | 0.6% | 1.9% |
Increase in Multifamily Supply Softening Rent Prices
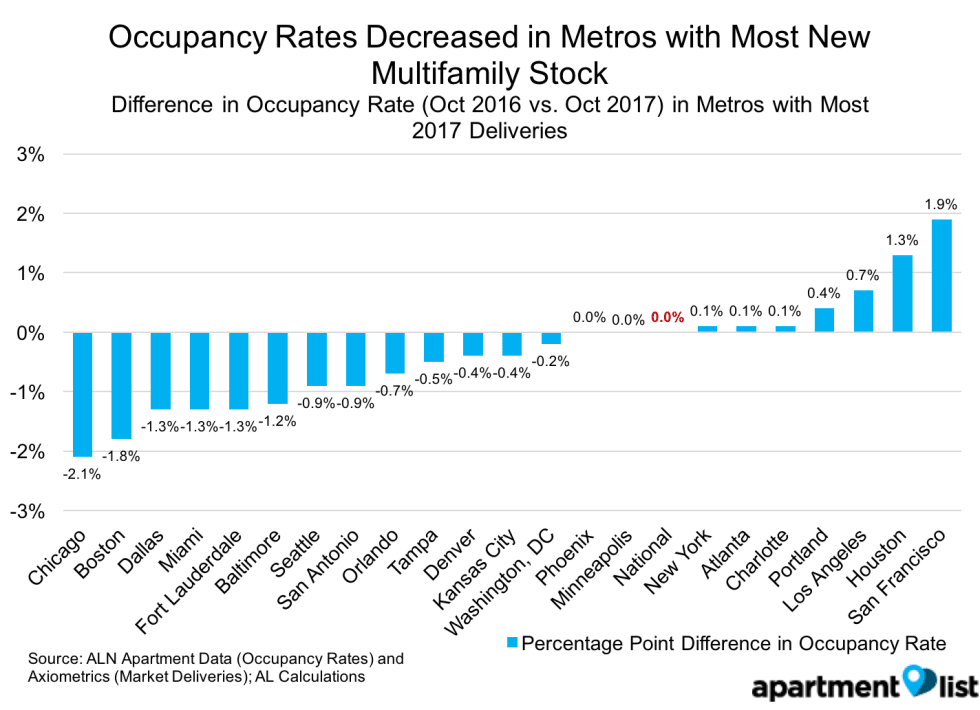
In the markets with the most new multifamily construction, occupancy rates have dropped, while at the national level, occupancy has remained steady. For example, in Dallas, there are a projected 22,851 new deliveries in 2017, up from 15,459 in 2016. With the large increase in the rental stock, overall occupancy rates have fallen from 92.3 percent in October 2016 to 91 percent in October 2017. Even in rental markets with tight supply, such as Denver and Seattle, occupancy rates fell by 0.4 percentage points and 0.9 percentage points, respectively, as new multifamily properties entered the market.
On the other hand, the West Coast metros of Los Angeles, San Francisco and Portland saw occupancy rates rise despite the high volume of multifamily construction. These metros are experiencing a severe undersupply of housing -- from 2010 to 2015, Los Angeles, San Francisco and Portland added 4.7, 6.8 and 2.7 new jobs per building permit, respectively, leading to significant pent-up demand for rentals. Houston also saw a significant increase in its occupancy rate, as the destruction of housing in Hurricane Harvey led to a surge in demand for the city’s available rental stock.
Rent growth was negative in the fall of 2017, a time of year when rent growth was flat the previous two years. This slow down was not due to a lack of demand, but rather caused by a flood of multifamily units entering the market. Developers plan to introduce more than 100,000 new apartments per quarter from mid-2017 through mid-2018, compared to roughly 80,000 new units per quarter over the last year. The market is on track to deliver 250,000 new units in Reis’s top 82 markets in 2017, the highest level of growth since the late 1980s. Most of these deliveries are for high-end, class-A properties that target higher-income renters. Many of these properties are seeing increases in vacancies and, thus, are offering concessions or lower rent to attract renters. While much of this construction is aimed at the upper end of the market, it has the potential to alleviate pressure at the mid- or low-end of the market if higher-income renters move into these newer class-A apartments rather than the existing mid-priced stock.
Despite Overall Increase in Rental Stock, Shortage of More Affordable Rentals Persists
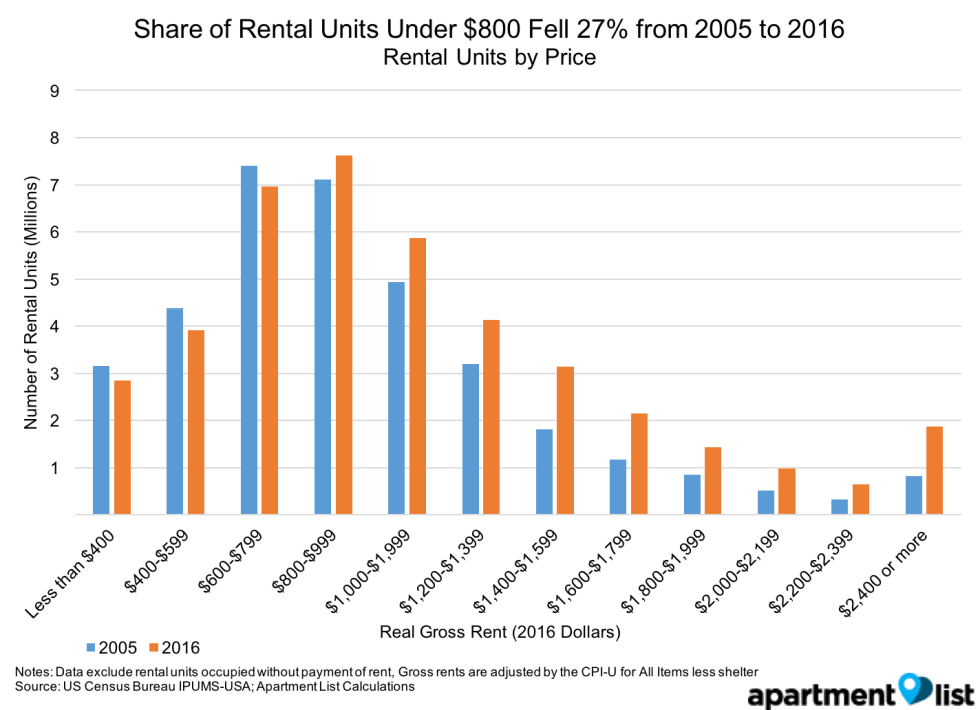
The rental stock decreased at the lower end of the market, while increasing at the higher end. As the chart above shows, from 2005 to 2016, the number of occupied rental units priced under $800 fell by 1.2 million units, while the overall stock of units rented increased by 5.9 million units. The share of occupied rentals under $800 fell from 41.9 percent to 33.1 percent. Over the same period, the share of rentals costing more than $2,000 per month increased from 4.7 percent to 8.4 percent. As the rental stock at the lower end of the market decreased, very few apartments remain affordable for the poorest households. From 2010 to 2016, the number of apartments priced affordably for very low-income families, defined as those earning less than 50 percent of the Area Median Income, fell from 11.2 percent to 4.3 percent.
Remarkably, one in four renters is now severely cost-burdened, spending over 50 percent of their income on rent. Rental affordability remains a challenge in both expensive and more affordable metros. For example, in both the New Orleans and Los Angeles metros, about 31 percent of renters are severely cost-burdened. In addition, of the largest 100 U.S. metros, only six had rates of severely cost-burden renters under 20 percent. With the majority of projected new construction at the higher end of the market, the lack of affordable rentals is expected to persist in 2018.
Conclusion
After years of decreases, the homeownership rate stopped falling and increased slightly in 2017. While the homeownership rate remains far below its 2004 high, the homeownership rate is expected to remain relatively stable in 2018. The homeownership rate remains constrained by a shortage of homes on the market and a particularly severe shortage of more affordable starter homes. In contrast, the multifamily sector saw large increases in supply, which helped soften rent growth in some markets.
Overall, rental affordability improved in 2016, with growth in renter incomes outpacing growth in rent prices, causing cost burden rates to fall to their lowest rate since before the Great Recession. Unfortunately, much of this improvement in affordability appears to be caused by a change in the composition of the renter population. The share of high-income renters increased, as renter households delayed homeownership, and the share of low-income renters decreased as poor renters moved to more affordable metros or were forced to double up with family. While the large number of 2017 multifamily deliveries expanded the rental supply, the shortage of more affordable apartments at the lower end of the market worsened. While affordability improved for the overall renter population, affordability remains a major concern for lower-income renters
Share this Article
