Housing Shortage: Where Is The Undersupply of New Construction Worst?

As America’s cities continue to grow and add jobs, it’s crucial that sufficient new housing is built to meet the demand created by that growth. Analyzing data on building permits and employment, Apartment List found that only 10 of the nation’s 50 largest metros have produced enough new housing to keep pace with job growth in recent years. San Francisco, for example, added 3.0 jobs for every new housing unit permitted from 2005 to 2010, with an even more severe undersupply of 6.8 jobs per unit in the post-recession period from 2010 to 2015. Even many cities that lost a significant number of jobs during the recession have not been producing enough new housing during the recovery.
We also found that in many metros, job growth tends to be centered in the county containing the core city, while a greater share of housing units are added to the surrounding suburbs, leading to heightened levels of undersupply in the core cities. For example, San Francisco County added 6.2 jobs for each permitted unit from 2005 to 2015, while the counties that make up the remainder of the San Francisco metro added one unit for every 1.8 new jobs. Contra Costa County -- where residents face long commute times to San Francisco -- has permitted the most new housing for each job added.
The creation of new jobs stokes the demand for housing, and when that increased demand is not met with a corresponding increase in supply, prices will respond. We find a strong correlation between the number of jobs per permit and rent growth from 2005 to 2015. Over that 10-year period, San Jose had the biggest undersupply of new construction of the 50 largest metros and also experienced the fastest rent growth at 57 percent.
Introduction
The number of households in the U.S. grew by 11.2 million over a 10-year period between 2005 and 2015, while only about 9.9 million new housing units were constructed over that same period, leading to a tightening housing market. This mismatch has been even more severe in many of the country’s largest metros, with some of the areas that have seen the strongest job growth also experiencing a severe shortage of homes for sale and swiftly rising rents.
Apartment List dug into U.S. Census data on building permits and Bureau of Labor Statistics (BLS) data on employment for metros and counties across the nation. To determine whether or not a given metro is constructing enough new units, we divided the number of new jobs added by the number of new housing units authorized in building permits. A higher value of this jobs per permit ratio means a more undersupplied market. We calculated this metric over three periods: 2005 to 2010, 2010 to 2015 and the full 10-year period from 2005 to 2015.
After the housing-bubble collapse at the end of the last decade caused real estate values to plummet, construction screeched to a halt across the country, with the number of new housing units permitted to be constructed dropping to the lowest level on record in May 2009. Since then, the housing market and the overall economy have recovered, but new construction continues to lag. The number of companies building homes dropped by 50 percent from 2007 to 2012, and the construction industry is currently facing a serious labor shortage. The resulting lack of new construction is contributing to rising rents, which are creating an affordability crisis in many parts of the country.
The problem is particularly acute in many of the nation’s largest cities, including San Francisco, Boston and New York. As the most desirable jobs cluster in these metros, restrictive zoning and bureaucratic hurdles slow the pace of new construction. With supply failing to increase in line with demand, rents have been increasing to levels that are only affordable to those with the highest-paying jobs.
Bay Area housing market is nation’s most undersupplied
Of the nation’s 50 largest metros, we identified the 10 metros that had the most undersupplied markets from 2005 to 2015. 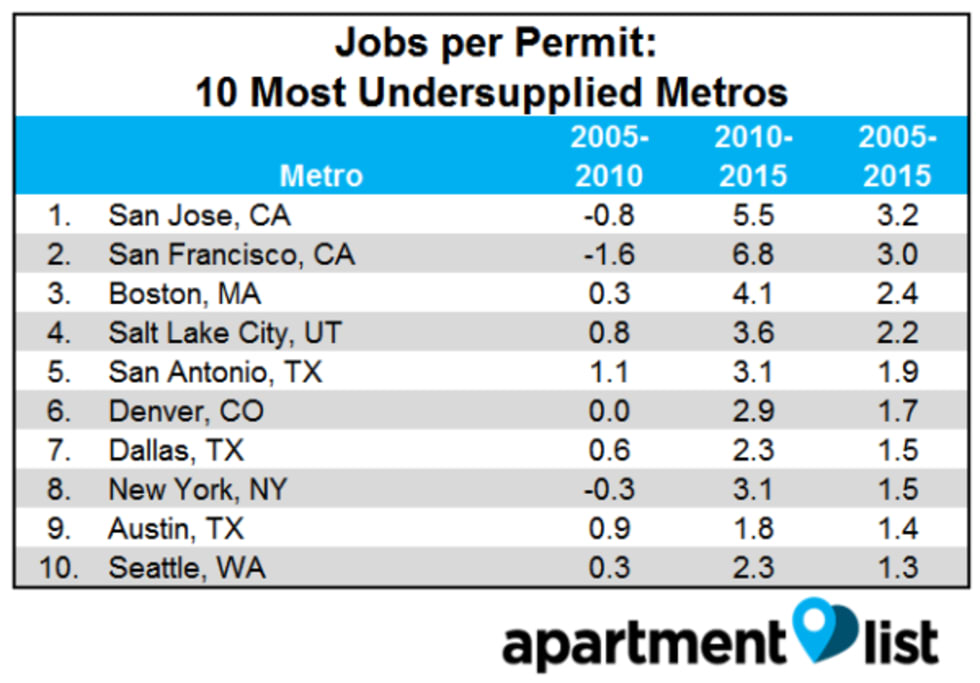 In order to keep pace with demand, a city should add one new unit for every one to two new jobs. While many metros maintained this pace over the 10-year period from 2005 to 2015, it’s important to note that this period included the entirety of the Great Recession, during which time most metros lost significant numbers of jobs, skewing the results. If we look just at the post-recession five-year period from 2010 to 2015, we see that as jobs have rebounded in recent years, new construction has not kept pace.
- San Jose, for example, added 3.2 new jobs for every permitted housing unit from 2005 to 2015, indicating a shortage of new housing. Note, however, that the metro lost jobs from 2005 to 2010, and in the more recent period from 2010 to 2015, 5.5 jobs were added for each permit, indicating an even more serious housing shortage.
- San Francisco was even more undersupplied from 2010 to 2015, with 6.8 new jobs for just one new housing unit.
- Three fast-growing Texas metros -- San Antonio, Dallas and Austin -- make the top 10. Of the three, San Antonio shows the biggest shortage, with 3.1 jobs added for every newly permitted unit from 2010-2015.
Metros with biggest job losses show oversupply, but that may be changing
On the other hand, there are some metros that seem to have been producing more than enough new housing to keep pace with job growth. Apartment List evaluated the 10 most oversupplied metros from 2005 to 2015.
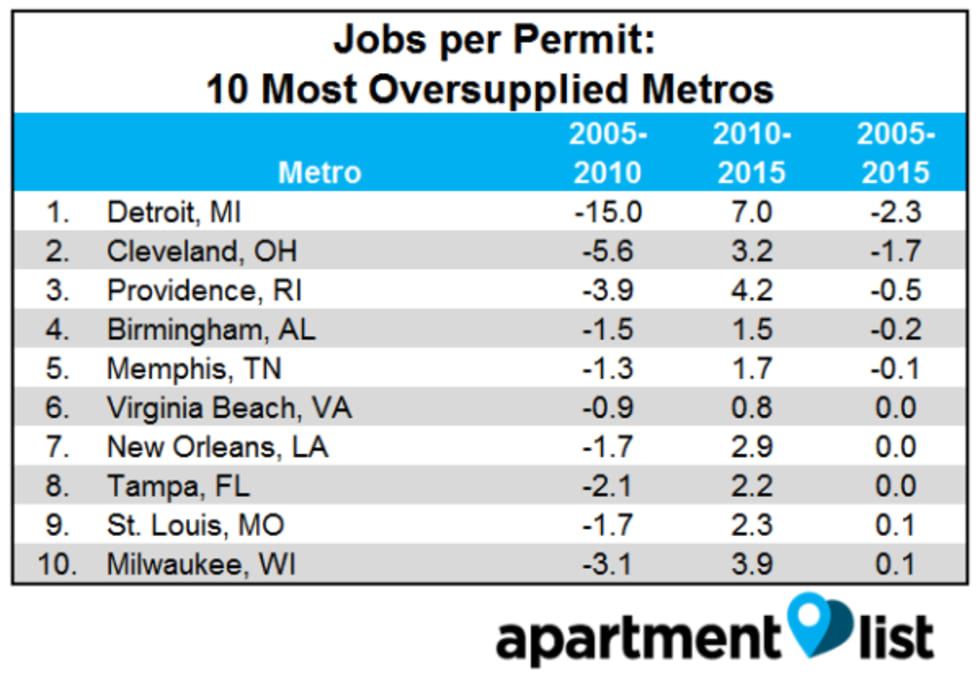
The first five metros on this list -- Detroit, Cleveland, Providence, RI, Birmingham, AL, and Memphis -- logged negative jobs per permit from 2005 to 2015, indicating that these metros lost jobs over that 10-year period. However, these job losses all occurred during the recession, and none of the 50 largest metros in the country lost jobs during the five-year period from 2010 to 2015.
Looking at this more recent period, we see that even many of the cities that were hit hardest by the recession are not producing enough new housing as jobs begin to return.
- Detroit, for example, lost over 15 percent of its jobs from 2005 to 2010. However, the city has been steadily adding jobs in more recent years, and while new construction has begun to increase, as well, the city added seven jobs for every new unit permitted from 2010 to 2015. Note that Detroit’s rental vacancy rate peaked at 23.6 percent in Q1 of 2017, but as of 2016 Q4, that number had fallen to 7.2 percent.
- Providence, RI lost 3.9 jobs for every new housing unit from 2005 to 2010, but from 2010 to 2015 the situation reversed, with the city permitting just one new unit for every 4.2 jobs.
In the post-recession period, most large metros are undersupplied.
When we focus on the post-recession period from 2010 to 2015, only 10 of the 50 largest metros added fewer than two jobs per permit. The following map shows jobs per permit from 2010 to 2015 for the nation’s 100 largest metros. Cities that added fewer than two jobs per unit, indicating sufficient supply, are depicted in green, while undersupplied markets are shaded red.
In coastal metros, undersupply is worst in the core city
The data analyzed at the metro level consists of much more than just the city proper. A more nuanced picture came to view when Apartment List took a look at more granular county level data.
For the 50 largest metros, we identified the county containing the metro’s core city and compared jobs and permit data within this “core” county to data from other counties in the metro. Overall, the core counties account for 57 percent of new jobs, but only 49 percent of newly permitted units, indicating that while jobs tend to cluster in core cities, a greater share of new housing is produced in outlying suburbs. This dynamic varies greatly by metro, however.
Apartment List analyzed the number of jobs per permit from 2005 to 2015 across core and secondary counties for the 10 metros with the most undersupplied core counties.
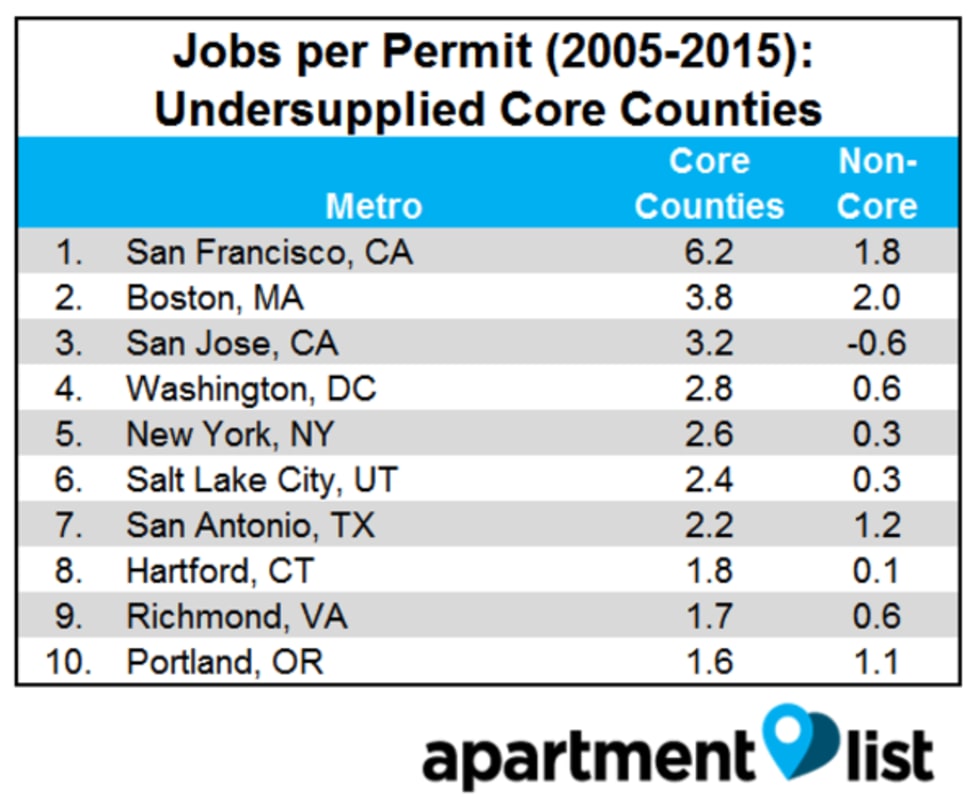
The cities at the top of the list tended to be densely populated coastal cities, where it is often more difficult to build new housing.
- For example, San Francisco County accounted for 55 percent of job growth in the metro from 2005-2015, but just 27 percent of building permits. This meant that, while the metro’s outlying counties added one new unit for every 1.8 jobs, the core city was only adding one new unit for every 6.2 new jobs.
- In the more recent period from 2010-2015, every county in the San Francisco metro has experienced an undersupply of new housing, with San Francisco County adding 8.2 jobs per permit. The county that came closest to meeting demand over that period was Contra Costa, with 3.5 jobs per permit. Of the five counties that make up the San Francisco metro, residents in Contra Costa County face some of the longest commute times overall, speaking to the importance of developing new housing in areas that are adequately served by efficient public transit.
- A similar trend was seen in Boston, D.C. and New York. In each of these cities, jobs per permit was significantly higher in the county containing the core city. In the Boston metro specifically, the three counties furthest from the metro core -- Strafford, Rockingham and Plymouth -- added the most housing per new job.
- In San Antonio, the core county accounted for 81 percent of new jobs, but only 69 percent of newly permitted units.
As these regions continue to grow, more of their residents will be forced to live in outlying suburbs, while facing long commutes to jobs in the core cities.
In Midwest, a greater share of jobs added outside core cities
On the flip side, there were some places where there was enough new construction in the core of the metro to keep pace with the jobs being added. Of the 50 largest metros, 23 added more jobs per unit in their secondary counties than their core counties. Many of these are Midwestern metros -- such as Detroit, Cleveland and Indianapolis -- which have been adding a greater share of jobs outside the core county. In cities where the core county did a better job of supplying new housing, the core accounted for only 12 percent of new jobs, while in the cities with more undersupplied cores, 70 percent of new jobs were located in the core.
- In Kansas City, for example, the core county accounted for just 11 percent of new jobs, but made up 44 percent of new construction, so that jobs per permit from 2005 to 2015 was 0.2 for the core county and 1.4 for the secondary counties.
- In Chicago and Pittsburgh, the number of jobs added for each permitted unit was also lower in the core county. Note that each of these metros saw significant job growth outside of the core county -- the secondary counties in Chicago and Pittsburgh accounted for 80 percent and 62 percent of new jobs, respectively.
Lack of residential construction drives rent hikes
The impact of the lack of new housing in many metros across the country is readily apparent in swiftly rising rents. We identified this relationship by plotting the number of new jobs per permit against median rent growth from 2005 to 2015.
- San Jose had the highest number of jobs per permit and also experienced rent growth of 57 percent from 2005 to 2015, the fastest of the 50 largest metros.
- Meanwhile, Charlotte added roughly the same number of jobs as San Jose, but issued permits for more than three times as many new units and saw rents rise by a more modest (though still substantial) 30 percent.
- Denver added 2.9 new jobs for every new housing unit permitted from 2005 to 2015 and saw rents rise by 52 percent.
- Atlanta added 176,000 jobs from 2005 to 2015, only 25,000 less than Denver; however, Atlanta permitted twice as many new units and experienced substantially lower rent growth of 25 percent.
Conclusion and Recommendations
As locals economies grow, it is imperative that they build enough new housing to keep pace. Cities that add jobs without also increasing their housing stocks quickly become unaffordable for all but the most well-off residents. In recent years, the majority of the nation’s biggest metros have not been building enough new housing, and that situation is compounded by the fact that in many of these metros, jobs are being added to the core cities, while the housing that is produced is being built in outlying suburbs. As demand continues to rise, supply must respond accordingly or the current affordability crisis being experienced in many parts of the country will only be exacerbated.
| Metro | Jobs per Permit (2005-2010) | Jobs per Permit (2010-2015) | Jobs per Permit (2005-2015) | Rent Growth (2005-2015) | Jobs per Permit - Core County (2005-2015) | Jobs per Permit - Secondary County (2005-2015) |
|---|---|---|---|---|---|---|
| New York, NY | -0.3 | 3.1 | 1.5 | 38% | 2.6 | 0.3 |
| Los Angeles, CA | -3.9 | 4.7 | 0.9 | 39% | 1.1 | 0.5 |
| Chicago, IL | -2.0 | 5.6 | 0.7 | 26% | 0.3 | 1.0 |
| Dallas, TX | 0.6 | 2.3 | 1.5 | 34% | 1.5 | 1.5 |
| Houston, TX | 0.8 | 1.7 | 1.2 | 39% | 1.4 | 0.9 |
| Washington, DC | 0.3 | 1.4 | 0.9 | 45% | 2.8 | 0.6 |
| Philadelphia, PA | -1.7 | 2.0 | 0.1 | 32% | 0.8 | 0.0 |
| Miami, FL | -2.4 | 3.7 | 0.9 | 38% | 1.1 | 0.7 |
| Atlanta, GA | -0.7 | 2.7 | 0.7 | 25% | 0.7 | 0.7 |
| Boston, MA | 0.3 | 4.1 | 2.4 | 29% | 3.8 | 2.0 |
Share this Article
