Imbalance in Housing Aid
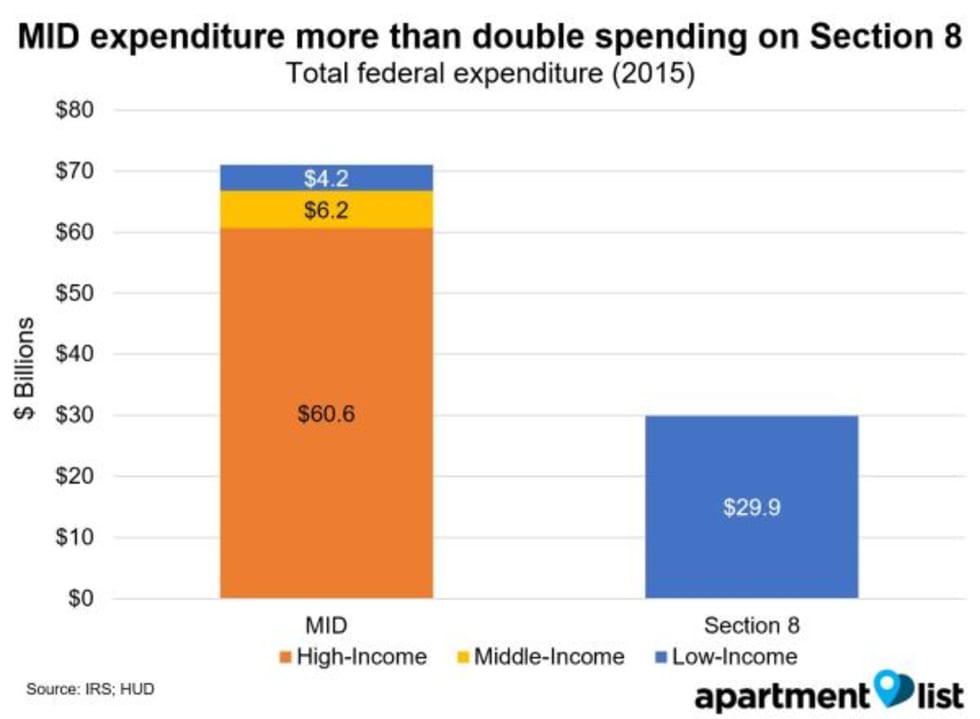
With the tax reform debate now fully underway, Apartment List examined the popular mortgage interest deduction (MID) and compared federal expenditure on the MID to spending on Section 8 rental assistance programs. In 2015, the MID cost the federal government $71 billion, more than double the $29.9 billion funding for Section 8. Additionally, the MID is a highly regressive benefit, with 85 percent of expenditure going to high-income households.
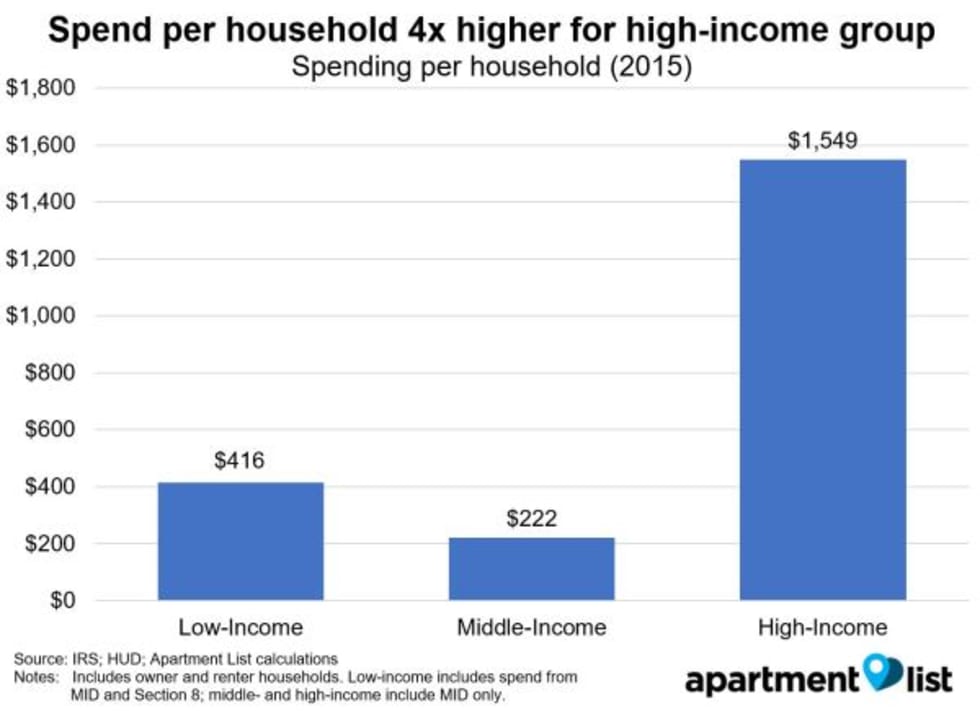
While more than half of high-income households claim the MID, only 11 percent of low-income households receive assistance with their housing costs. This results in $1,549 in government spending per household for high-income households, nearly four times the $416 spent per low-income household. Geographically, expensive coastal areas receive the most expenditure per household, led by San Francisco and San Jose at the metro level. Given the failure to allocate funds to those in need, we recommend reforming the MID to provide more benefit to low-income and middle-income homeowners, while reinvesting the savings in Section 8 programs to benefit low-income renters.
Introduction
Late last month, the Trump administration released plans for a comprehensive overhaul of the federal tax code. As the reforms gather steam, a particular point of interest for the housing market is the impact of the proposed new legislation on the mortgage interest deduction (MID), which allows homeowners to claim a tax deduction equal to the amount of interest they paid on their home loan.
While administration officials, lawmakers, industry executives and housing experts fiercely debate the future of the home mortgage deduction, lost in the argument is the fact that the political battle centers on issues relevant primarily to wealthier homeowners, while disregarding the unmet needs of lower income renters. The debate overlooks remedies for the deeply underfunded Section 8 rent subsidy program that helps some of the country’s poorest Americans.
The mortgage interest deduction has long been a benefit enjoyed mostly by high-income households, living in more expensive homes, with a greater amount of interest to deduct and higher marginal tax rates. This dynamic has made the MID a “regressive” benefit to tax experts.
Additionally, the MID is available only to homeowners, though renters are far more likely to face issues with housing costs. Nationwide, 52 percent of renter households are cost burdened, spending more than 30 percent of their income on housing, compared to just 26 percent of owner households whose housing costs exceed that threshold, according to data from Census. The problem is particularly acute for low-income renters, 77 percent of whom are cost burdened.
Low-income renters receive help from the Section 8 federal rental assistance program, which is much more effective than the MID in allocating funds to those in need, but it suffers from underfunding. Federal expenditure on the MID totaled $71 billion in 2015, more than double the $29.9 billion that went to Section 8 that year. Thus, many households who qualify for Section 8 assistance are unable to access benefits, facing exceedingly long waitlists and difficulty finding landlords who accept the vouchers.
America would be well served if policymakers in the tax reform debate consider ways to reform the MID to reach less-wealthy Americans, while using the savings to boost funding for the country’s Section 8 program, easing long waitlists and increasing benefits for some of the country’s most vulnerable families.
History of Programs
The history of U.S. tax policy on home mortgages starts in the early 20th century. In 1913, Congress passed the 16th Amendment, which established the modern federal income tax and allowed for the deduction of all interest. At the time, Americans rarely purchased their homes with mortgages, and Congress likely intended the interest deduction to apply primarily to interest as a business expense. It wasn’t until the mortgage industry expanded after World War II that homeowners started to widely take advantage of the interest deduction. Decades later, when Congress passed the Tax Reform Act of 1986, a Reagan administration initiative, the new legislation largely eliminated tax deductions on interest from personal loans, but kept the MID in place, with the justification that it was an important tool for encouraging homeownership. Today, the MID represents the single largest federal expenditure on housing assistance.
While the MID only benefits homeowners, federal housing assistance for renters is provided primarily through Section 8 programs. The first federal programs to provide housing subsidies for low-income families began during the Great Depression with the Housing Act of 1937. Legislators amended this act repeatedly over time, including with the Housing and Community Development Act of 1974, which created the modern Section 8 program. Section 8 functions as a voucher program, in which low-income families lease a unit in the private market -- referred to as “tenant-based” -- or within a specified complex, referred to as “project-based.” Voucher recipients pay a portion of their income toward rent (usually 30 percent), with the voucher covering the remaining cost. While any low-income family can apply for Section 8 assistance, waiting lists are usually long and in many cities, they have been closed for years. Additionally, even those who receive Section 8 vouchers may have difficulty finding landlords who will accept them. Consequently, only a small share of low-income Americans actually benefit from Section 8 programs.
Data and Methodology
In order to better understand how the federal government allocates its housing assistance, Apartment List dug into two sources of information: the IRS Statistics of Income database, which contains information on the households claiming the MID, and HUD data, which documents federal spending on Section 8 programs. We looked at data at the county and metro levels and broke down how the government allocated spending to low-income, middle-income and high-income households. For our analysis, we classify low-income households as those earning less than 80 percent of the median income in the area where they live, the threshold defined by HUD. We classify households earning between 80 percent and 120 percent of area median income (AMI) as middle-income. Households earning above 120 percent of AMI are considered high-income.1 We calculated income thresholds at the county level.2
This analysis only considers expenditure going to the MID and Section 8 programs. Federal housing expenditure does include programs other than these two, such as the real estate tax deduction for owners and the low-income housing tax credit for renters. That said, the MID and Section 8 are the largest programs, and the issues we outline here generally apply to other forms of housing expenditure as well.
Only one-third of combined spending on MID and Section 8 goes to low-income households
We find that although renter households are far more likely to need assistance, federal housing benefits go disproportionately to homeowners. In fact, the amount spent on the MID is well over double the amount that goes to Section 8. In 2015, the most recent year for which data is available, MID expenditure was over $71 billion, compared to just under $30 billion spent on Section 8.
Even more concerning, the vast majority of MID spending goes to high-income households. Although more than half of low-income homeowners are cost-burdened, only 6 percent of MID expenditure goes to low-income households. Meanwhile, 85 percent of MID benefits go to high-income households, despite the fact that such households are significantly less likely to be burdened by their housing costs.
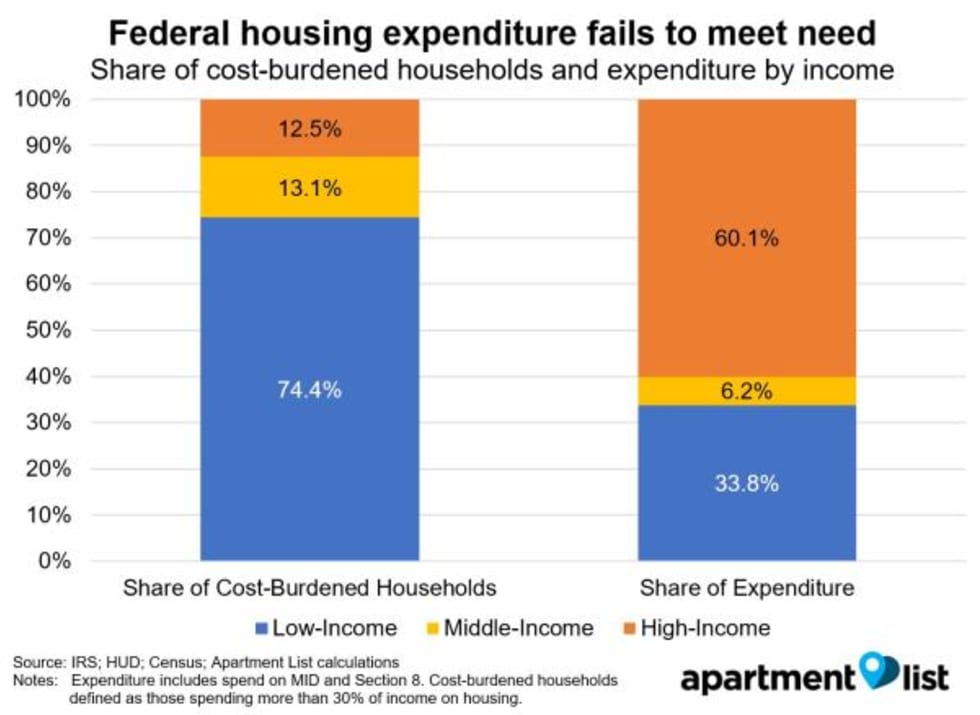
Of all cost-burdened households, 74.4 percent are low-income, but low-income households receive just 33.8 percent of combined spending on the MID and Section 8. Meanwhile, high-income earners make up just 12.5 percent of cost-burdened households but receive 60.1% of federal housing assistance.
This failure to allocate spending where it is most needed is the result of the regressive distribution of MID benefits, which is due to a couple of factors. Firstly, high-income households generally purchase more expensive homes and are more likely to own second homes. Therefore, they have a greater amount of mortgage interest to deduct. Secondly, households that earn more have a higher marginal tax rate and, therefore, receive a greater benefit from the deduction. Finally, middle-income and low-income households are more likely to take the standard deduction rather than itemizing their tax returns, in which case they see no benefit from the MID.
Because MID expenditure significantly outweighs funding for Section 8 and goes primarily to high-income households, only 34 percent of total federal housing expenditure goes to low-income households, while 60 percent goes to high-income households.
Only 11 percent of low-income households receive MID or Section 8 benefits
Because MID expenditure goes primarily to high-income households and significantly outweighs Section spending 8, high-income households are far more likely to benefit from federal housing assistance.
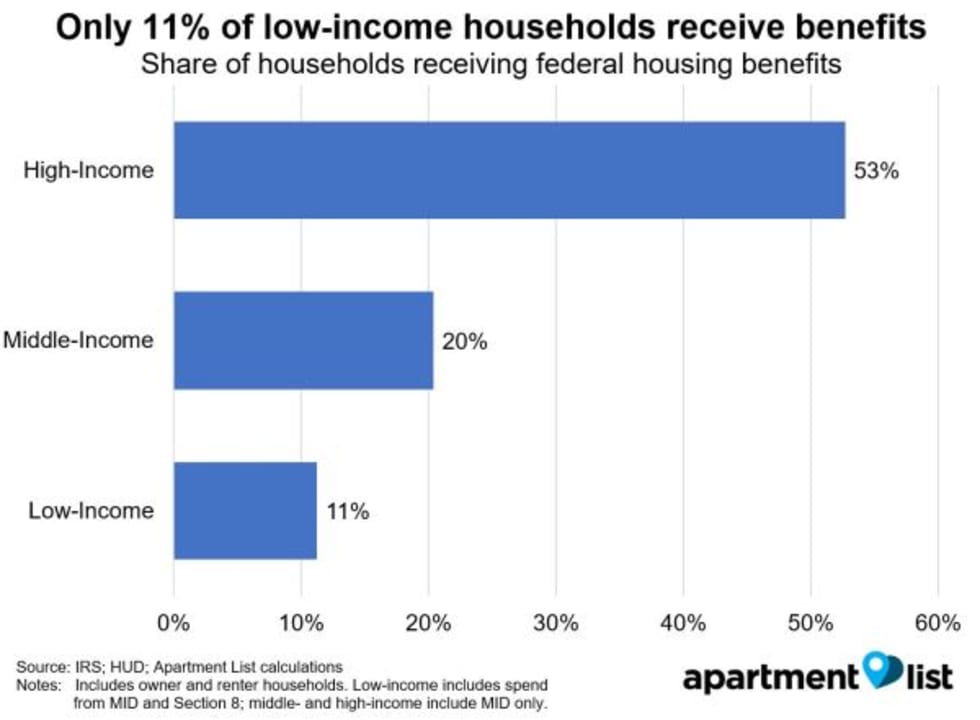
We compared the number of households who actually receive MID or Section 8 benefits at each income level to the total number of households that fall into each income bucket, and we found that more than half of high-income households claim the MID. Meanwhile, just 20 percent of middle-income households claim the MID, and a mere 11 percent of low-income households receive Section 8 assistance or claim the MID. While a commonly cited figure says that one in four low-income renters receive housing assistance, our analysis shows that the situation is even worse if considering low-income owners as well, very few of whom benefit from the MID. This fact leads to significant disparities in spending per household.
When considering just those households that actually receive assistance, we calculate that low-income renters who benefit from Section 8 programs receive an average annual subsidy of $9,073. The average benefit for households that claim the MID is $706 for low-income households, $1,087 for middle-income households and $2,940 for high-income households.
However, these figures are misleading due to the discrepancies in the shares of households receiving assistance. Because only a small fraction of low-income households benefit from Section 8 or the MID, average spending for all low-income households is just $416. Meanwhile, the average MID benefit for all high-income households is nearly four times that amount, at $1,549.
Housing benefits focused in expensive coastal states
The allocation of federal housing subsidies also varies notably by location. We analyzed total expenditure per household -- including both MID and Section 8 -- at the county, metro and state levels and found large disparities in the amount of federal dollars spent per household, with the highest levels of expenditure generally going to expensive coastal areas.
- At the state level, Washington, D.C., has the highest spending per household by a wide margin at $1,800
- Massachusetts, Maryland, Connecticut and California all also have per household spending above $1,000
- South Dakota households receive the least benefit, with spending of just $350 per household
- There are 23 states, primarily throughout the Midwest and South, which receive less than $500 per household
- County-level data show areas of higher spending, generally corresponding to urban centers, even in states with low spending overall
The trend is related to the same factor that explained the discrepancy in MID expenditure between high-income and low-income households, namely, higher home values correspond to a greater benefit from the MID. Additionally, in places with expensive rental markets, there is a greater dollar value of the benefits provided by Section 8 vouchers.
At the metro level, residents of San Jose receive the highest level of housing subsidy per household at $1,573. The following table shows spend per household for the 50 largest metros, sorted from most to least:
| Metro | Low-Income | Middle-Income | High-Income | Overall |
|---|---|---|---|---|
| San Jose, CA | $724 | $1,230 | $3,299 | $1,573 |
| San Francisco, CA | $843 | $585 | $3,218 | $1,537 |
| Bridgeport, CT | $659 | $1,282 | $3,525 | $1,480 |
| Washington, DC | $580 | $1,350 | $3,290 | $1,353 |
| Boston, MA | $1,006 | $371 | $2,405 | $1,322 |
| Oxnard, CA | $400 | $803 | $3,488 | $1,168 |
| Baltimore, MD | $672 | $786 | $2,411 | $1,133 |
| San Diego, CA | $452 | $692 | $2,811 | $1,071 |
| Seattle, WA | $464 | $570 | $2,416 | $1,058 |
| New York, NY | $768 | $339 | $2,016 | $1,038 |
The cities that top the list are mostly coastal hubs with strong economies and high housing costs.
- In addition to San Jose, three other California metros -- San Francisco, San Diego and Oxnard -- make the top 10
- Of the 10 metros with the highest levels of spending per household, Section 8 spending as a share of total expenditure is lower than the national average for all except Boston and New York
- Orlando residents receive the lowest level of benefits per household at $410
- Six of the ten metros with the lowest levels of spending are located in Florida or Texas
High-income households receive much larger spending per recipient in all major metros
As described above, because of the small share of low-income households that receive assistance, spending per household is much greater for the high-income bracket at the national level. This holds true at the metro level as well, though with great variation in the severity of the discrepancy.
In Raleigh, for example, high-income households receive an average MID benefit of $1,996, while spending on Section 8 and MID benefits for low-income households amount to just $213 - the difference between these values is a factor of 9.4. Other metros with severe discrepancies in funding between high- and low- income households include Austin, Orlando and Phoenix.
Meanwhile, in New Orleans, spending per household is $1,143 for the high-income group, which is just 1.3 times the $867 spent per low-income household. New Orleans is the only metro in which spending per high-income household is less than double the amount per low-income household, but other metros that do relatively well on this measure include Pittsburgh, Providence, R.I., and Cleveland.
None of 25 largest metros allocate more than half of housing benefits to low-income households
The disparities between high-income and low-income benefits on a per household level also hold true when looking at total spending. We analyzed the share of total federal housing expenditure going to each income group for the nation’s 25 largest metros.
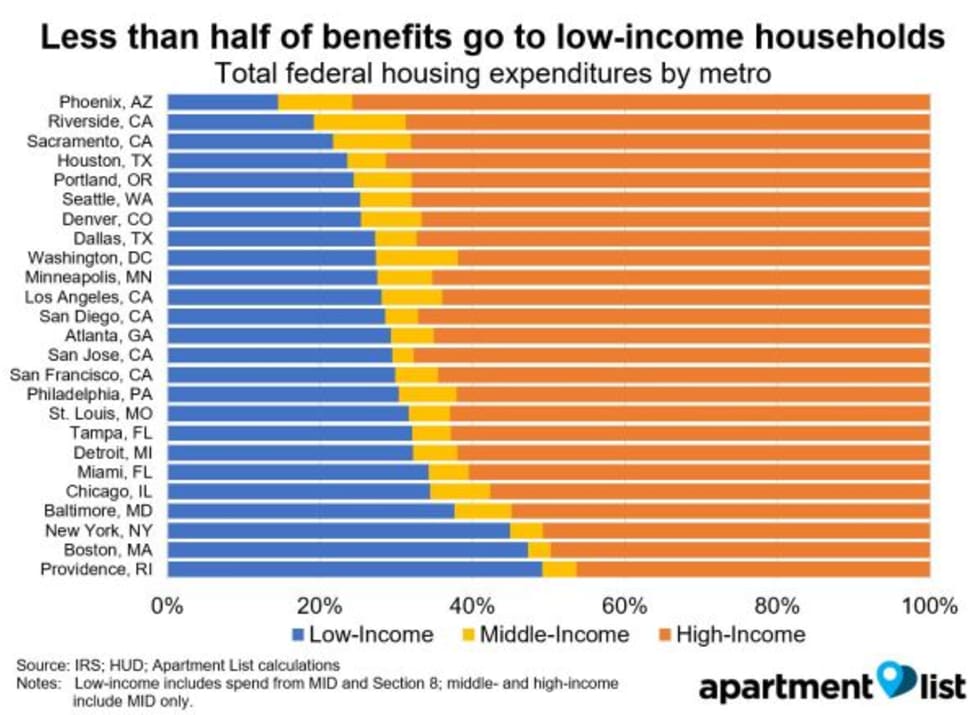
Of the metros shown, none spends more than half of federal housing expenditure on low-income households. Providence comes closest at 49 percent, followed by Boston and New York. The cities that do best on this measure tend to have well-funded Section 8 programs, with an above average share of low-income households receiving assistance.
At the other end of the spectrum, low-income households receive only 13 percent of spending in Phoenix. Overall, 20 of the 25 largest metros allocate less than a third of total spending to low-income households.
MID needs reform, with savings reallocated to Section 8
The federal expenditure on housing assistance is currently doing a poor job of allocating money to households that need it most. Section 8 rental assistance programs are limited to low-income households and have proven to be effective, but the amount spent on those programs is dwarfed by the benefits received by homeowners through the mortgage interest deduction. In addition to providing undue preference to homeowners, the MID is a regressive benefit that goes mainly to high-income households and its effectiveness at its stated goal of promoting homeownership is questionable.
The initial version of the Trump tax plan keeps the MID in place, but by doubling the standard deduction, reduces the number of households that will benefit from claiming the deduction. This would reduce the total amount of expenditure on the MID, but would actually make the benefit even more regressive.
A more sensible plan would involve two reforms:
- Converting the deduction to a tax credit, allowing more low-income and middle-income homeowners to take advantage of the benefit
- Lowering the maximum amount of mortgage eligible for tax benefits, which would reduce the benefit to high-income households
Importantly, the money saved by reforming the MID should then be reinvested in additional funding for programs that assist low-income renters, which are currently only able to serve a small fraction of those who are eligible. These include the Section 8 programs discussed in this article, as well as public housing programs, the National Housing Trust Fund and a proposed renter tax credit. Millions of households across the nation struggle with their housing costs, and it is time to restructure the way the federal government provides housing subsidies to make sure that the spending goes to those in need, ultimately uplifting all of America.
- IRS data is aggregated based on bucketed AGI groups; AGI buckets are mapped to local AMI thresholds -- which are calculated from Census ACS data on median rents by county -- based on the average salaries and wages claimed in each bucket, with buckets apportioned as needed assuming an even distribution of incomes within buckets.↩
- Data is available for all counties in the U.S., as well as over 900 CBSAs.↩
Share this Article
