It’s Asian American and Pacific Islander (AAPI) Heritage Month!
Historically, AAPI Heritage was celebrated in the first ten days of May. Early May marks two significant anniversaries for the Asian American population in the U.S., including May 7, 1843, the date of the arrival of the first Japanese immigrants to the U.S., and May 10, 1869, the completion of the transcontinental railroad. In 1992, Congress and President George H. W. Bush expanded AAPI Heritage from a 10-day celebration to an entire month.
In observation of this holiday, we created this report to uncover the top emerging for Asian professionals across the country. In this report, “Asian” refers to descendants of East Asia, Southeast Asia, India Subcontinent and Pacific Islands; this is in alignment with how the U.S. Census defines those who identify as Asian and/or Pacific Islander. “Asian Professionals” refers to those Asian descendants who graduated from college and are part of the workforce.
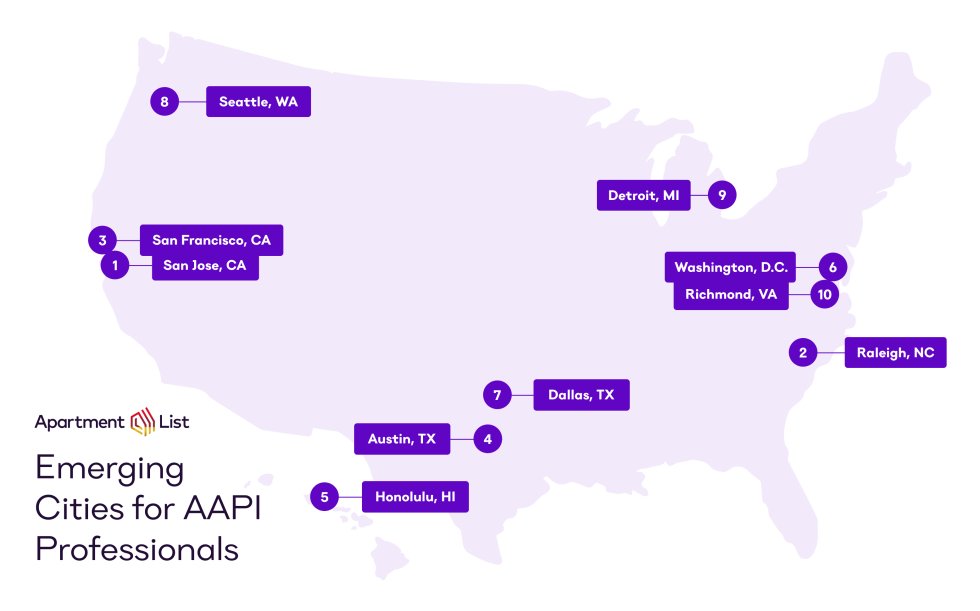
Here are the top emerging cities overall for Asian professionals:
San Jose, CA
Raleigh, NC
San Francisco, CA
Austin, TX
Honolulu, HI
Washington, DC
Dallas, TX
Seattle, WA
Detroit, MI
Richmond, VA
Ready to learn more about how we chose these cities and what each of them has to offer? Keep reading to find out about our ranking methodology and the outstanding scores of our top five cities.
Emerging Cities for Asian Professionals
How We Ranked the Top Emerging Cities for AAPI Professionals
To identify the top U.S. cities for Asian professionals, we analyzed data in four categories: Community & Representation, Economic Opportunity, Housing Opportunity, and Business Environment. The specific metrics within these categories were selected after surveying members of our API@A-List ERG about what makes a city great for them.
The Community & Representation score identifies regions that have a sizable (and growing) Asian community. This score considers the share of a city’s population who is Asian and to what extent that community has grown over the past decade.
The Economic Opportunity score identifies strong job markets that offer competitive wages for Asian professionals. This score considers the median income among Asian households, how that income compares to that of non-Asian workers, and Asian college graduation rates.
The Housing Opportunity score evaluates affordability for renters within each local housing market. This score considers median rent and rent burden: the share of renters who spend at least 30% of their income on rent.
The Business Environment score measures the percentage of local businesses that are Asian-owned, and whether that rate is proportional to the overall share of the population that is Asian.
These four scores, and the individual statistics that comprise them, are weighted and summed to arrive at a final composite score between 0-100. Higher scores indicate places that offer better economic outcomes and better community representation for Asian workers. We acknowledge that this ranking will capture some, but not all of the socio-economic inequalities that exist between races and locations throughout the United States.
For a more detailed look at the numbers behind the rankings, see the data section below.
Key Findings
We analyzed 50+ cities to determine the top emerging cities:
Historically, California is the best state for AAPI professionals with two cities (San Jose and San Francisco) making the list.
California rose to the top with culture and economic opportunity. San Jose came in first for economy and second for community, while San Francisco came in fourth for community and third for economy.
Texas is another stand-out state! In addition to Austin making our top 5 list, Dallas came in at number 7, both for earning moderate to strong scores in most categories.
Top-ranking cities are also tech hubs. According to the EEOC, AAPI workers make up nearly 20% of people in the tech industry. It's not surprising, then, to see tech hubs like San Francisco and Austin represented on our list.
With a final score of 64.1, San Jose took the lead thanks to its established and prosperous AAPI community, ultimately ranking second for community & representation and number one for economic opportunity. 43% of people in San Jose are members of the AAPI community, which has grown 27% in the last decade.
In addition to a strong culture, the AAPI median household income in San Jose is very high at more than $185,000. Also impressive, this northern California city has one of the lowest rent burden scores for AAPI renters on our list at 35%. These factors all contribute attracting AAPI professionals to San Jose. However, the cost of living in San Jose is high, and the availability of housing is low. Indeed, San Jose’s came in twenty-first for housing opportunity in our research.
At least 39% of businesses in San Jose are Asian-owned. You can grab a Green Thai Tea and Rose Water Macaron at 7 Leaves Cafe, pick up the latest collectibles at Zonkey Toys, or eat your heart out at Tai Pan Dim Sum Bakery. Yelp also maintains a list of AAPI-owned businesses in the city.
City
Community & Representation
Housing Opportunity
Economic Opportunity
Business Environment
San Jose, CA
2
58
1
9
2. Raleigh, NC
With a final score of 57.4, Raleigh is the second best city for AAPI professionals. Raleigh performed extremely well in the economic opportunity category, where it came in second. The Asian household median income in Raleigh is high at more than $138,971. This economic strength is also evident in the development of the Triangle area, which is filled with numerous Asian American-owned businesses. 7% of businesses in Raleigh are AAPI-owned.
Raleigh also has one the fastest growing AAPI populations on our list, expanding at a rate of more than 73% in the last ten years. That growth propelled Raleigh to the #6 position on our chart for community & representation. This is part of a larger trend attracting the AAPI population to the Southeast, likely influenced to a great degree by the lower cost of living as well as job opportunities.
Raleigh also came in #7 for housing opportunities, and the city boasts one of the lowest rent burden scores on the list at 29%. Raleigh’s lowest ranking is for its business environment, which ranks #33.
If you visit the Triangle area, you can grab Korean BBQ at Honey Pig, find some of the best ingredients from around the world at Patel Brothers, or pick up some ornate jewelry from Rose May Jewelry. All Asian American-owned businesses are found within the popular Triangle area.
You can find an extensive list of these businesses in Raleigh Magazine. In addition to welcoming Asian Americans, we also ranked Raleigh as the best city for working women in 2022.
City
Community & Representation
Housing Opportunity
Economic Opportunity
Business Environment
Raleigh, NC
6
7
7
33
3. San Francisco, CA
San Francisco is the second California city on our list, and it takes third place overall. With a final score of 54.0, San Francisco boasts a historically significant and prosperous AAPI community. Many early AAPI immigrants established businesses in San Francisco, fostering a culture of entrepreneurship that continues to attract and empower AAPI communities to this day. It came in #3 for economic opportunity, with a very high AAPI median income at over $152,409. 29% of businesses in San Francisco are AAPI-owned, putting it in twelfth place for business environment.
In addition, 32% of the population is part of the AAPI community, and it took fourth place overall for community & representation. San Francisco’s lowest ranking is for its housing opportunity, which ranks #51. It also has a slightly high AAPI rent burden compared to other cities at 39%.
If you find yourself in town, you can dine on some vegan sushi at Shizen Vegan Sushi Bar and Izakaya, grab a beer at Dokkaebier Brewery, or pick up Asian cooking essentials at the Wok Shop. A tourist website for Downtown San Francisco maintains a list of AAPI-owned businesses. San Francisco also appeared on our top ten list of the best cities for working women in 2022.
City
Community & Representation
Housing Opportunity
Economic Opportunity
Business Environment
San Francisco, CA
4
51
51
12
4. Austin, TX
Austin sits at number four with a final score of 51.5. It took third place for community and representation due to its impressive population growth. In the last decade, Austin’s AAPI population has grown over 81%, making Austin the fastest growing city on our list. 8% of the population is part of the AAPI community.
Many link Austin’s AAPI population growth to the rising popularity of tech jobs in the area as well as the presence of UT Austin, which attracts experts from all over the world. Indeed, Austin came in fifth place for economic opportunity, and the AAPI median household income is around $122,834. It also ranked #22 for housing, and its lowest ranking is for business environment (#32). However, 8% of businesses in Austin are Asian-owned, making the number of AAPI business owners proportional to the overall population.
Austin also ranked #3 of the best cities for working women and #9 of the best cities for black professionals in 2022. If you visit the area, you can dine on some farm-to-table Thai at Dee Dee, shop around for antiques at Lotus Gallery, or stop by for a quick massage at U-RELAX. DO512 maintains a list of AAPI-owned businesses in the area.
City
Community & Representation
Housing Opportunity
Economic Opportunity
Business Environment
Austin, TX
3
22
22
32
5. Honolulu, HI
Moving further west across the Pacific Ocean, you’ll arrive at the last destination on our list, Honolulu, Hawaii. With a total score of 50.7, Honolulu took the top position for community & representation and came in at #8 for business representation. Honolulu has the highest Asian population in the U.S. at 75%. A whopping 60% of businesses in Honolulu are AAPI-owned, though that still leaves the AAPI population underrepresented by 15%.
Honolulu’s lowest rankings were for economic opportunity (#41) and housing (#56). The AAPI median household income is $100,530, which is much lower than the other cities in our top five. Rent burden in Honolulu is high, however, at 50%, and median rent sits at $2,000 a month.
If you're looking for AAPI owned businesses in Honolulu, you can find a list on Yelp. Consider dining on some signature Korean dishes at O’Kims, enjoy premium katsu at Nana Ai Katsu, or grab a dozen of the famous Cream Puffs from Liliha Bakery.
City
Community & Representation
Housing Opportunity
Economic Opportunity
Business Environment
Honolulu, HI
1
56
56
8
Emerging Cities for Asian Professionals Data
Use the table below to compare the cities and their respective scores. Below the Rankings table, you will find more granular information about the data and how our scores were calculated.
Emerging Cities for Asian Professionals Rankings
Ranking
City
Final Score
1
San Jose, CA
64.1
2
Raleigh, NC
57.4
3
San Francisco, CA
54.0
4
Austin, TX
51.5
5
Honolulu, HI
50.7
6
Washington, DC
49.9
7
Dallas, TX
47.5
8
Seattle, WA
47.2
9
Detroit, MI
46.9
10
Richmond, VA
46.0
1-10 of 59
Emerging Cities for Asian Professionals by Weighted Factor
Ranking
City
Community & Representation
Housing Opportunity
Economic Opportunity
Business Environment
01
San Jose, CA
2
58
1
9
02
Raleigh, NC
6
7
7
33
03
San Francisco, CA
4
51
51
12
04
Austin, TX
3
22
22
32
05
Honolulu, HI
1
56
56
8
06
Washington, DC
24
42
42
15
07
Dallas, TX
7
19
19
18
08
Seattle, WA
5
39
39
36
09
Detroit, MI
30
3
3
39
10
Richmond, VA
31
9
9
27
1-10 of 59
A total of 59 locations were included in this analysis. For individual factors (e.g., median income, population growth) and data notes, please view the complete data. Each factor was converted into a normalized score from 0 to 100 according to the distribution of values across locations. Normalized scores were then weighted and summed to give every location a final composite score between 0 and 100. A score of 100 would mean a location ranked first in every individual factor in the analysis.
API@A-List Collaboration
We wrote this report in collaboration with the Apartment List Asian ERG, also known as, "API@A-List". Pictured above are a few of those employees who helped us with this report!
Employee Resource Groups (ERGs) at Apartment List are meant to serve as a safe space for Apartment List employees. They meet frequently to chat about their shared experiences, plan company-wide events, and form allyship across the company. Apartment List has 5 different ERGs that each represent a different identity group: Black, Asian, Latinx, Women, and LGBTQ+.
Apartment List is a technology-driven rental marketplace with nearly 6 million units on the platform, reaching millions of renters on their path to find their next home each month. Apartment List was founded with the mission to deliver every renter a home they love and the value they deserve. Read More
The Asian Pacific Islander Employee Resource Group is focused on four main pillars; Belonging, Career Development, Community, and Education. We strive to provide a safe space for Asians and Pacific Islanders and their allies to share their stories, learn about cultures, and be supported in all personal and professional endeavors. Read More