The Number of "Super Commuters" Has Fallen to the Lowest Level in Over a Decade
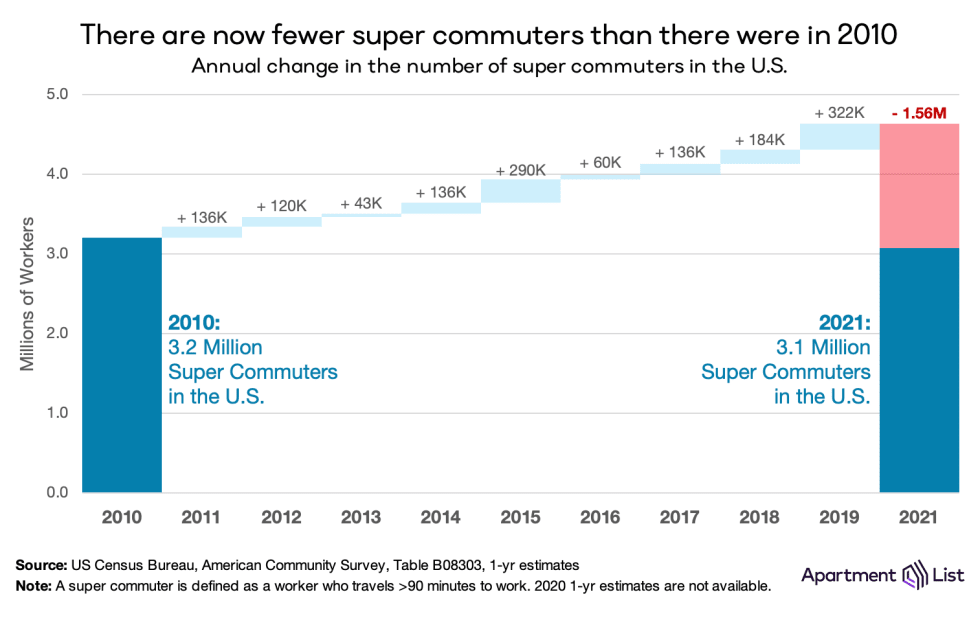
- After increasing from 3.2 million in 2010 to 4.6 million in 2019, the number of “super commuters” who travel 90 minutes or more each way to work has fallen back to 3.1 million as of 2021, driven by the widespread adoption of remote work. 2 percent of the U.S. workforce are super commuters, down from 3 percent in 2019.
- Despite the improvements, there remain significant populations of super commuters in and around the nation’s most expensive markets, especially the San Francisco Bay Area and the region surrounding New York City. Stockton, CA – on the outskirts of the Bay Area – has the nation’s highest super commuting rate at 7.4 percent.
- Super commuting has historically been most common among high earners, but that gap is closing. The super commuting rate for six-figure earners fell from 4.4 percent in 2019 to 2.2 percent in 2021, while the rate for workers earning less than $25K fell from 2.1 percent to 1.7 percent.
- Workers who rely on public transit to get to work are more than three times as likely to be super commuters as those who commute by car; 6.8 percent of all transit riders were super commuters in 2021, compared to 2.1 percent of drivers.
Introduction
As housing affordability rapidly worsened over the course of the 2010s, workers in many of the nation’s hottest markets gradually began to move further and further from the urban core in search of more affordable housing. This led to a rapid surge in the population of “super commuters” – workers who travel 90 minutes or more each way to work. But as the remote work revolution has taken hold, many of these long-distance commuters are now staying home, and the number of super commuters has plummeted, erasing a full decade of expansion. The underlying affordability crisis has not gone away, but changes in the ways we work are significantly altering the role of job location in housing choice. In this report, we dive into the latest data to better understand the rapid evolution in super commuting trends.
Remote works wipes out a decade of super commuter growth
In the decade preceding the pandemic, the total number of super commuters in the U.S. skyrocketed from 3.2 million in 2010 to 4.6 million in 2019. That translates to an increase of 45 percent, which was triple the increase in the overall national workforce over the same period (15 percent). But in recent years, the number of super commuters has plummeted, wiping out a full decade of growth and then some. As of 2021 – the most recent data currently available from the Census Bureau’s American Community Survey – the number of super commuters had fallen back to 3.1 million, 4 percent fewer than there were in 2010. In 2019, super commuters comprised 3 percent of the American workforce, but as of 2021, that figure has fallen by one-third to 2 percent.
This transformation in commuting patterns has an obvious source – the widespread adoption of remote work. The number of remote workers more than tripled from 2019 to 2021. In 2019, just 5.7 percent of Americans worked primarily from home, but by 2021, that share jumped to 17.9 percent. With so many more workers logging on from home, there have been declines not just in super commuting, but in commutes of all lengths. Even still, super commuters have seen the sharpest dropoff. From 2019 to 2021, the number of workers commuting 30 minutes or less each way fell by 8 percent, while the number of super commuters traveling 90 minutes or more declined by 35 percent.
It’s important to note though, that the Census data that we rely on for the analysis in this report does not allow us to accurately identify hybrid workers who split time between home and the office. Rather, workers are classified based on their “typical” working arrangements. Other sources have shown that hybrid work arrangements are significantly more prevalent than fully remote arrangements.1 It is therefore likely that some workers we identify as remote are actually commuting to an office part of the time, while some workers who we identify as commuters sometimes work from home. In other words, there is very likely a sizeable population of “part-time super commuters” who we are not able to cleanly identify in this report. In fact, hybrid work arrangements likely make the prospect of moving further from the office more appealing for many workers; a super commute is more bearable when only required two days per week rather than five.
CA and NY are still the epicenters of super commuting, even with improvements
The reduction in super commuting is not confined to specific markets, but is rather taking place across the U.S. This can be seen clearly in the map below, which visualizes changes in the population of super commuters at the county level from 2010 to 2021. The size of the marker for a given county corresponds to the the number of super commuters in that county in the given year, while the shading of the markers corresponds to the super commuting rate (i.e. the share of the county’s total workforce that are super commuters).
(Click here for an interactive version of this map)
The expansion and darkening of the bubbles from 2010 to 2019 shows the previous decade’s surge in super commuting, especially in the nation’s large coastal markets. But then the shrinking and lightening of the bubbles from 2019 to 2021 shows how super commuting has rapidly fallen back to 2010 levels, or even lower. This is true in terms of both the number of super commuters and the share of the workforce that they comprise. Despite this widespread improvement, there remain significant populations of super commuters in and around many of the nation’s priciest housing markets. The following table shows the top 10 metros (among the 100 largest) with the highest rates of super commuting:
| Rank | Metro | Super Commuter Rate (2021) | Super Commuter Rate (2019) | Number Super Commuters (2021) | Number Super Commuters (2019) | Change in Super Commuters (2019-2021) |
|---|---|---|---|---|---|---|
| 1 | Stockton, CA | 7.4% | 10.8% | 24,547 | 35,224 | -30% |
| 2 | Riverside, CA | 5.3% | 6.8% | 105,040 | 138,727 | -24% |
| 3 | Poughkeepsie, NY | 5.2% | 7.9% | 17,252 | 26,313 | -34% |
| 4 | New York, NY | 4.1% | 6.8% | 381,772 | 658,299 | -42% |
| 5 | Bridgeport, CT | 3.2% | 7.0% | 15,932 | 33,427 | -52% |
| 6 | Bakersfield, CA | 2.9% | 3.0% | 10,160 | 10,587 | -4% |
| 7 | Sacramento, CA | 2.7% | 3.4% | 30,297 | 38,576 | -21% |
| 8 | Allentown, PA | 2.7% | 4.2% | 11,168 | 17,495 | -36% |
| 9 | Lakeland, FL | 2.5% | 3.4% | 8,166 | 10,642 | -23% |
| 10 | Winston-Salem, NC | 2.5% | 2.4% | 7,686 | 7,515 | 2% |
The rankings continue to be led by Stockton, CA, which sits on the periphery of the San Francisco Bay Area. Despite a 30 percent reduction in the metro’s super commuter population from 2019 to 2021, Stockton’s super commuting rate of 7.4% is still far higher than any other metro in the U.S., exemplifying the acute housing affordability crisis in the Bay Area. Sacramento, whose super commuters are also likely commuting to the Bay Area, also ranks among the top ten with a super commuting rate of 2.7 percent.
Notably, the San Francisco metro itself fell out of the top 10 between 2019 and 2021. The number of super commuters in the San Francisco metro fell by 67 percent from 2019 to 2021 – the nation’s second sharpest decline – bringing the metro’s super commuting rate from number six highest at 5.1 percent in 2019 down to number 26 highest in 2021 at 1.8 percent. The neighboring San Jose metro – home to Silicon Valley – was the only metro to see a sharper decline in the number of super commuters from 2019 to 2021 (72 percent), bringing its super commuter rate from number 13 highest at 3.6 percent in 2019 down to number 14 lowest at 1.1 percent. It seems that the widespread embrace of remote work by the tech industry drove a sharp dropoff in super commuting in the core Bay Area metros, but less so in the region’s outlying areas.
Outside the Bay Area, the Riverside metro, which borders Los Angeles, has the nation’s second highest rate of super commuting. The top five is rounded out by three markets in the New York City region. The New York City metro itself ranks number four with a super commuting rate of 4.1 percent. The neighboring Poughkeepsie metro comes in just ahead at number three with a super commuting rate of 5.2 percent, while the nearby Bridgeport, CT metro ranks fifth at 3.2 percent. Similar to the Bay Area, New York City remains an epicenter of super commuting even after significant reductions in recent years.
Super commuting falling fastest for high-income workers
Historically, super commuting has been most common among high earners. In 2019, 4.4 percent of workers earning $100K per year or more were super commuters, more than double the rate among those earning less than $25K annually (2.1 percent). But from 2019 to 2021, the rate of super commuting among those earning $100K-plus was cut in half, falling to 2.2 percent, while the super commuting rate among those earning under $25K declined much more modestly, falling to 1.7 percent. It’s still true that high-earners are more likely to be super commuters, but the gap has narrowed substantially. In other words, workers at the high end of the income distribution have been the biggest beneficiaries of recent reductions in super commuting.
This trend is even more pronounced in the nation’s priciest markets. In the San Francisco metro, for example, the rate of super commuting among six-figure earners fell from 6.7 percent in 2019 to 1.4 percent in 2021, and is now lower than the rate of super commuting among the metro’s workers earning less than $25K (2.2 percent). Similarly, in the New York City; Boston; Washington, D.C.; Los Angeles; and Seattle metros, super commuting is now more prevalent among the lowest earners than it is among the highest earners, a complete reversal of the pre-pandemic trend.
As with the overall decline in super commuting, these disparities by income are tied directly to the rise of remote work. From 2019 to 2021 the share of $100K-plus earners who work from home more than tripled from 10 percent to 35 percent, whereas those earning less than $25K saw a much smaller increase in the work from home rate, from 5 percent in 2019 to 10 percent in 2021. Whereas many high-paid knowledge sector jobs were able to easily transition to remote settings, low-wage workers are far more likely to work in service occupations that require being on-site. And to the extent that super commuting did decline among low-income workers, that decline is likely being at least partially driven by the erosion of service-sector jobs in the central business districts of large cities, as remote work has resulted in a sharp dropoff in the customer base for coffee shops, restaurants, and other small businesses in these areas.
It’s also important to note that even though the rate of super commuting is greatest among high-earners, the lower income brackets account for a greater number of super commuters. The greatest number of super commuters fall into the income bracket earning between $25K and $50K annually. Workers in that bracket account for 28 percent of all super commuters, while the lowest income bracket (less than $25K) is the second most common, making up 21 percent of the super commuter population. Six-figure earners, meanwhile, account for 18 percent of all super commuters.
Transit riders are still more likely than drivers to be super commuters
The prevalence of super commuting also varies significantly based on commute mode, with transit riders being far more likely to bear 90-plus minute commutes. As of 2021, workers who rely on public transit to get to work are more than three times as likely to be super commuters as those who commute by car; 6.8 percent of all transit riders were super commuters in 2021, compared to 2.1 percent of drivers. But similarly to the differences across income brackets, this super commuting gap has also narrowed in recent years. From 2019 to 2021, the number of transit-riding super commuters fell by 55 percent, while the number of car-driving super commuters declined at half that rate, falling by 27 percent.
The dropoff in transit-based super commuting was especially pronounced among high-income workers transitioning to remote work. The number of six figure earners who super commute via public transit fell by 71 percent from 2019 to 2021. Though less extreme, the number of low-income workers who super commute by transit also declined sharply by 48 percent. As noted above, most of these high-income workers likely transitioned to remote work, whereas many of the low-income workers may have simply lost their jobs.
The decline in transit-based super commuting mirrors an overall decline in transit ridership broadly. From 2019 to 2021, the overall number of workers who commute by transit fell by 34 percent, much sharper than the 12 percent decline in the number who commute by car. This trend has the worrying potential to create a doom loop in which lower transit ridership and reduced revenue lead to reduced service, which further dampens demand, gradually eroding the stability of transit systems. Over time, this could lead to super commuting rates rising again among those who continue to ride transit, as service is reduced and transit becomes less efficient.
The sharpest declines in super commuting are in the metros with the biggest increases in remote work
As described above, the recent decline of super commuting is strongly intertwined with the rise of remote work. This can also be seen in the geographic distribution of where super commuting has dropped off most substantially. The chart below plots the change in a metro’s super commuter population from 2019 to 2021 against the changes in its remote worker population over the same period.
The San Jose metro has seen by far the nation’s biggest increase in remote work, with the number of remote workers surging by 582 percent from 2019 to 2021. San Jose has also seen the sharpest decline in its super commuter population (72 percent). Similarly, the San Francisco, Boston, and Washington, D.C. metros have all had among the biggest increases in remote work and the biggest decreases in super commuting. Conversely, the Riverside metro had the second smallest increase in its remote worker population among the 50 largest metros (though “smallest” here is still a 128 percent jump), and has also had among the most modest declines in its super commuter population (24 percent).
Conclusion
The rise of remote work has led to a corresponding dropoff in commuting. And no commute category has dropped off faster than lengthy super commutes of 90 minutes or more. From 2019 to 2021, the number of super commuters in the U.S. fell by 1.5 million, erasing a full decade of expansion during which the super commuter population was growing at triple the rate of the overall workforce. But even as the burden of super commuting has been somewhat ameliorated, the underlying cause of the trend has not. Acute housing affordability crises are still driving workers away from the nation’s most expensive cities, but more of them are now working remotely rather than bearing arduous commutes to downtown offices. In fact, remote work has the potential to accelerate migration to the far flung exurbs of large metros.
- According to the latest Survey of Working Arrangements and Attitudes, 29 percent of workers were in hybrid arrangements as of April 2023, compared to 12 percent who worked entirely from home.↩
Share this Article
