Black homeownership rebounding but stagnant since the 1970s
The racial wealth gap in the United States has persisted since emancipation, and after narrowing for over a century following the end of slavery, it is widening again today. Homeownership plays a major role. Owning a home has long been considered a reliable path to economic security and generational wealth. But a legacy of institutional racism has created cultural, political, and financial barriers that have suppressed Black homeownership for generations, highlighting the housing market’s role in the nation’s enduring wealth gap. Below is an overview of the historical evolution of Black homeownership in the United States through present day. Despite recent improvements, the Black homeownership rate remains stubbornly low, reflecting the ongoing legacy of a troubling past.
Black homeownership is trending up, but has made little long-term progress
According to the latest data from the United States Census Bureau, the Black homeownership rate currently stands at 44 percent.1 Consistent with a broader nation-wide trend, Black homeownership has been rising for the past half-decade, up from a recent low of 40.8 percent in 2016. During the most recent five-year span, the number of Black homeowners increased by roughly 750,000, and the aggregate value of their owned homes has increased $700 million.
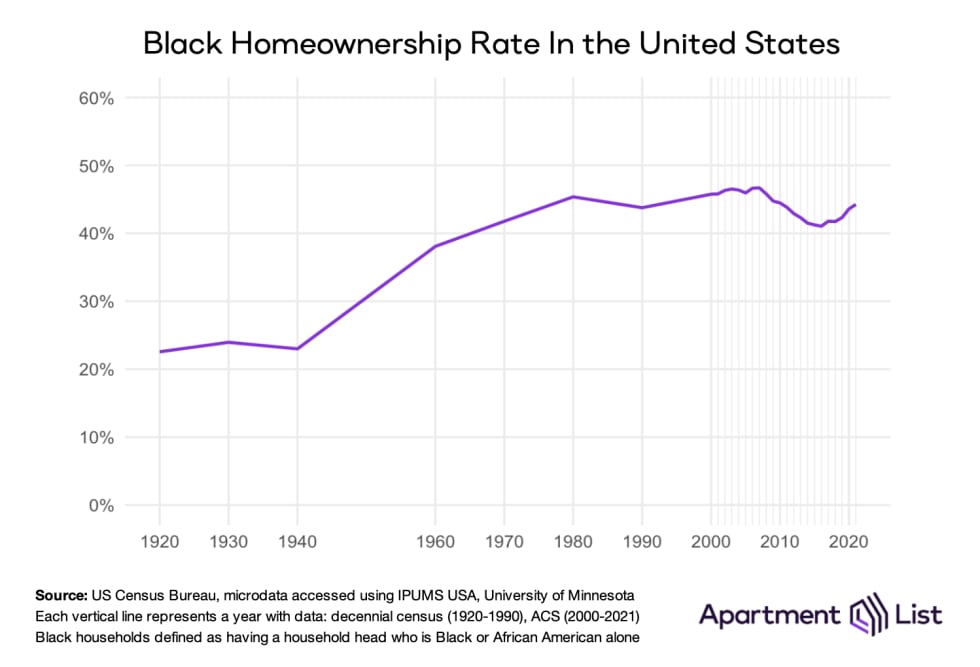
But in a broader historical context, Black homeownership remains low and has been mostly stagnant for several decades. According to decennial census data, the only period of significant improvement was 1940 to 1980, when the Black homeownership rate nearly doubled from 23 percent to 45 percent. This boost took place in spite of numerous racist policies that explicitly restricted Black access to homeownership. Racially restrictive covenants written into property deeds openly banned Black families from moving into white neighborhoods, and through the practice of redlining, the Federal Housing Authority refused to insure mortgages in Black neighborhoods. These were legal practices until the passage of the Fair Housing Act in 1968.2
Therefore, Black families were largely excluded from the post-war suburbanization boom. But white flight to the suburbs created vacancies in hollowed-out city centers, allowing more Black households to purchase homes. Black homeownership increased, but so too did segregation as Black homeowners concentrated in disinvested cities. The effects of this residential segregation persist today. Property values increased more slowly in Black neighborhoods than they did in booming white suburbs, meaning even as more Black families purchased homes, homeownership served as a less reliable source of wealth creation. Today, Black households own 8.0 percent of the nation’s homes, but these account for only 5.8 percent of the nation’s aggregate home value. And the median home equity for Black homeowners is half that of the median for white homeowners.
The Great Recession was also damaging to Black homeownership. Black and brown borrowers received a disproportionate share of subprime mortgages in the years leading up to the crash, and when the bubble burst, Black homeowners were 76 percent more likely than white homeowners to experience foreclosure. Black homeownership fell for nine consecutive years, and by 2015 the gap between Black and white homeownership was wider than it had been at any point going back to 1920. These losses have yet to be recuperated. Even after the modest rally that started in 2016, by 2021 Black households owned homes at the same rate that they did in the 1970s.
Black millennials are not keeping pace with earlier generations
Another way to visualize Black homeownership over time is to split the historical data by generation, and then normalize by age.3 This creates a “homeownership curve” describing what percentage of each generation owned homes at a given age. Despite reforms built into the Fair Housing Act, homeownership curves for generations that came after its passage do not surpass those of generations that faced overt, legal discrimination.
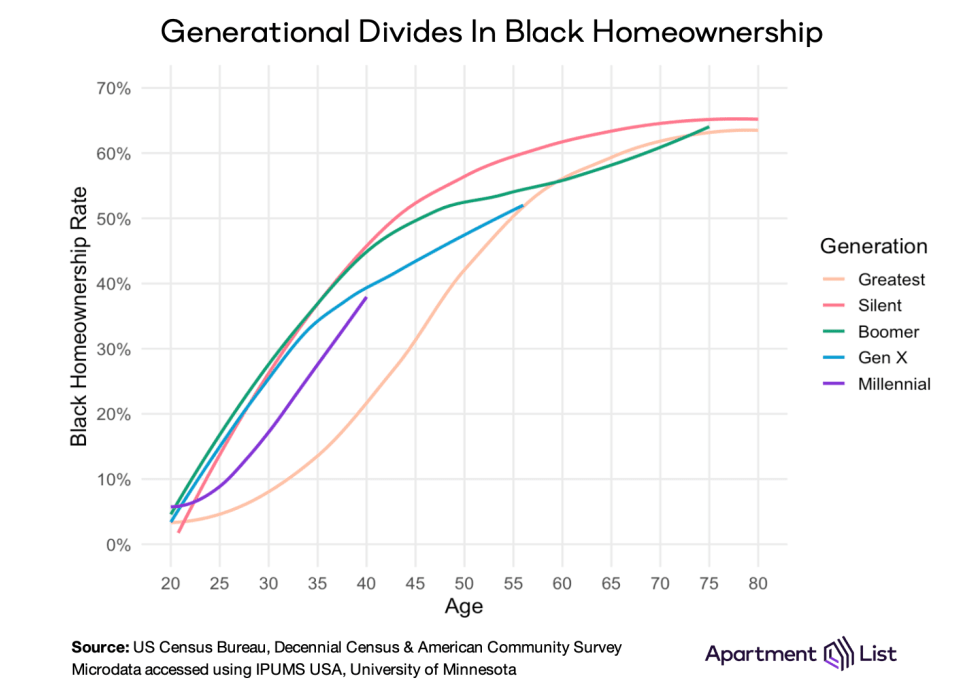
The Black homeownership rally that started after World War II was strongest for members of the greatest and silent generations, who purchased a majority of their homes in city centers as white households fled to the suburbs. For the greatest generation, the rally lasted from their 30s through their 70s; while fewer than 10 percent owned homes by age 30, over 60 percent owned them by age 70. The silent generation’s homeownership curve has a similar shape, but with the sharpest increases occurring at a younger age. Silents were in their teens through 50s during the post-war rally, and their homeownership rate would eventually plateau just above that of the greatest generation, around 66 percent.
But starting with baby boomers, every generation of Black Americans has attained homeownership at a slower pace than the generation that preceded them. The Great Recession was a major factor, causing a visible slump in each generation’s homeownership curve at ages that coincide with the market crash. For baby boomers, who were ages 44-62 in 2008, homeownership slowed abruptly after keeping pace with the silent generation for several decades. For generation X the recession hit in their 30s, and for the millennial generation the housing market crashed as soon as they reached adulthood. At age 30, just 17 percent of Black millennials owned homes, roughly 10 percentage points lower than the homeownership rates of earlier generations when they were the same age.
Today, Black homeownership varies greatly by geography
As of 2021, the Black homeownership rate is highest in states and metros across the Southeastern United States that have sizable Black populations.
In the Charleston, SC metropolitan area 58.1 percent of Black households own their homes, more than any other market in the country. Columbia, SC ranks second, while the Augusta, GA metro – which spans both Georgia and South Carolina – comes in third. Outside South Carolina, metros across Georgia, Alabama, Mississippi, and Louisiana can be found towards the top of this list. Atlanta and Washington, D.C. are the only two major urban metros (population >5 million) where more than half of Black households own their homes.
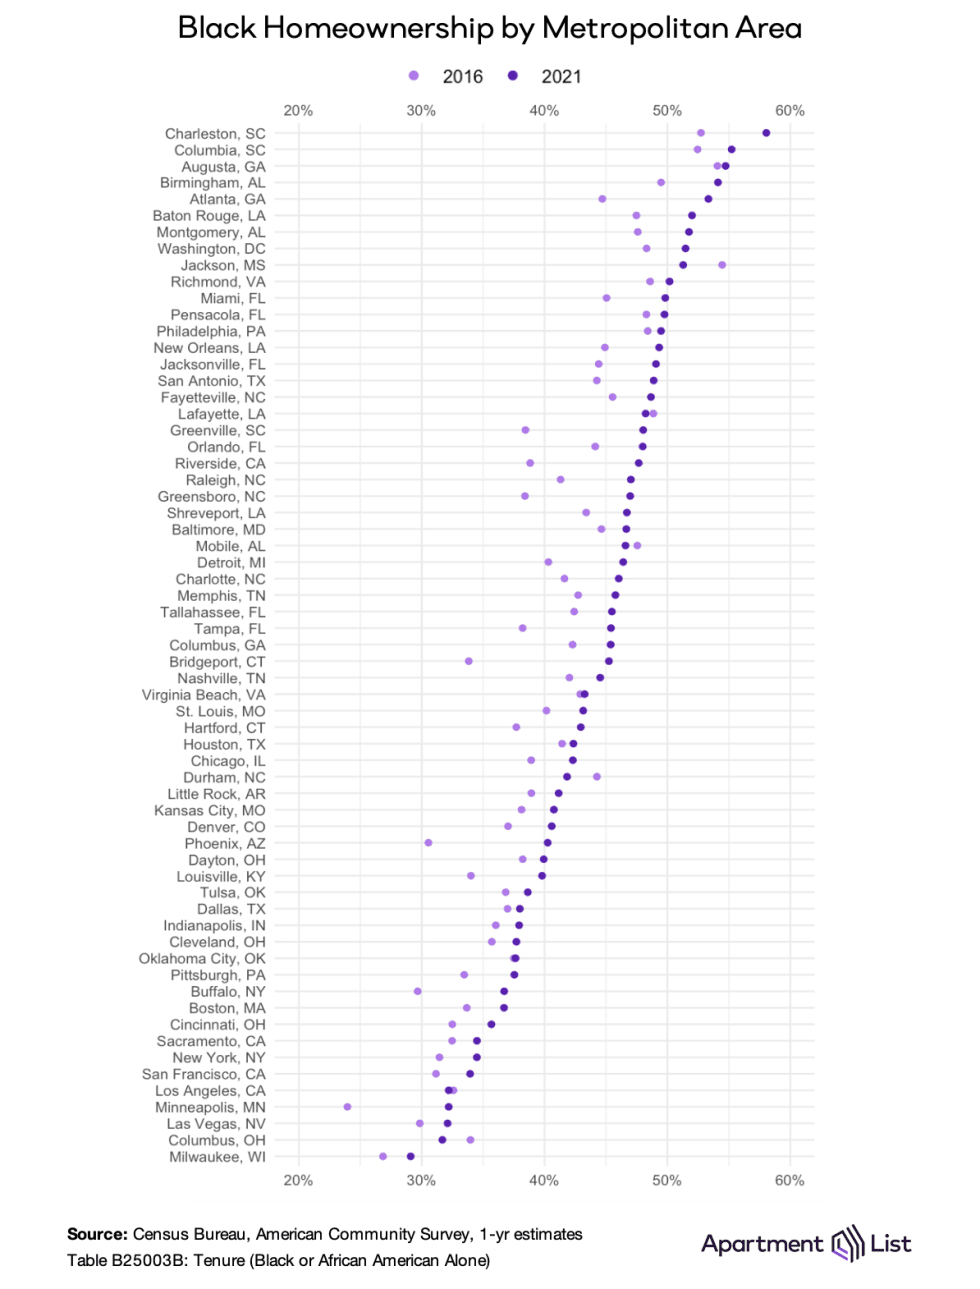
On the other end of the spectrum, Black homeownership is lowest in metros scattered across the Upper Midwest, Great Lakes, and California. In Milwaukee, fewer than 30 percent of Black households own their homes. Prohibitively high home prices also suppress Black homeownership in expensive metros like Los Angeles, San Francisco, New York, and Boston, which all rank in the bottom 10.
Since 2016, the Black homeownership rate has improved in 57 of the 63 metros analyzed. Large improvements can be found up and down the list, in metros where Black homeownership was relatively high to begin with (Atlanta: +8 percent since 2016, Greenville: +10 percent), as well as in markets with low 2016 levels (Phoenix: +9 percent, Minneapolis: +8 percent). But despite these improvements, white homeownership continues to exceed Black homeownership in each metro.
Conclusion
As racial divides in homeownership and wealth deepen, advocates have called for numerous reforms to encourage a more equitable financial future for Black and minority households. This includes: expanding access to small-dollar mortgages, adopting fairer credit scoring guidelines, increasing diversity in the appraisal profession, expanding wealth-generating assets for renters, and much more. Federal lawmakers have even proposed “baby-bond” legislation to support the economically-disadvantaged generation that has yet to be born. Ultimately, significant commitment from both public and private sources will be needed to address an issue that has persisted for generations.
- Source: Census Bureau, American Community Survey, 2021 1-yr estimates. Microdata accessed via IPUMS USA, University of Minnesota, www.ipums.org. Black households are defined by having a household head who is Black or African American alone.↩
- Despite the legal ban, there continues to be evidence of housing discrimination decades later.↩
- Generations are defined by birth year, consistent with the Pew Research Center. Greatest: 1901-1927. Silent: 1928-1945. Baby Boomer: 1946-1964. Generation X: 1965-1980. Millennial: 1981-1996.↩
Share this Article