Apartment List Renter Migration Report: 2023
Welcome to the latest Apartment List Renter Migration Report. Here we analyze data on millions of searches to see where our users are looking to move, shedding new light on the migration patterns of America’s renters. This report incorporates the search preferences of users who registered with Apartment List between January 1 and December 31, 2022.
In 2022 many renters considered long-distance moves
After 2021, a year characterized by rapid household formation and unrelenting rent inflation, 2022 was a bit of a roller coaster for the rental market. It started where 2021 left off, with prices continuing to rise and low vacancy rates leaving renters with few affordable housing options. But the market reversed quickly in the second half of the year, as inflation and a worsening economic outlook dampened housing demand and pushed rents down for five consecutive months. Full-year rent growth for 2022 came in just shy of 4 percent, not far off from pre-pandemic levels.
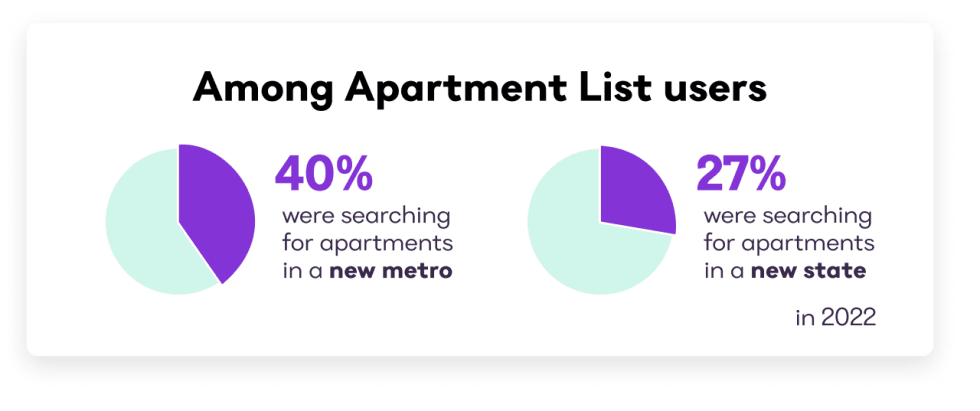
Amid this turbulent pandemic rental market, a large share of renters are considering long-distance moves. Among Apartment List users in 2022, 40 percent searched for apartments outside their home metro, and 27 percent searched in a new state altogether. Some of this reshuffling is undoubtedly attributable to the long-term adoption of remote work, which offers newfound flexibility to a segment of the workforce that also earns relatively high wages. Remote workers moved at higher rates in the past, and recent data suggest they will continue to do so in the near future.
Long-distance movers bring higher budgets with them
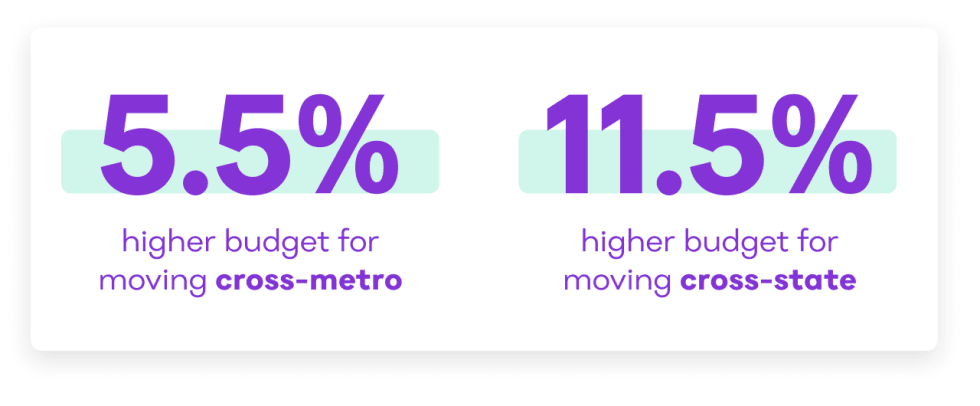
Long-distance movers tend to have larger budgets than the renters already living in the regions they are moving to. In 2022, the average budget among renters moving to a new metro was $1,669, 5.5 percent higher than that of renters searching within their current metro ($1,582). And for cross-state movers, we see an even greater budget premium of 11.5 percent. Long-distance moves are logistically difficult and expensive, and are therefore more common among high-earners.
This dynamic means that markets experiencing an influx of new renters are likely to face increased affordability challenges. This has been particularly true since the start of the pandemic, as remote work has enabled a surge in domestic migration. With new housing supply unable to keep pace with rising demand in the short term, a number of popular markets, primarily located in the Sun Belt, have seen rents rise by 30% or more since early 2020.
California is exporting high rents to nearby states
With affordability waning, a key migration trend during the pandemic has been the movement of renters away from the nation’s most-expensive markets and towards more-affordable ones. This is suggested not only by the budget data above, but also rent growth trends as well as official population estimates from the US Census Bureau.
At the forefront of this trend is California, which lost more than 500,000 residents from 2020 to 2022 according to the Census Bureau. Over that span, California had the second largest absolute population decline of any state in the country, and the fourth largest decline in percentage terms. Despite its massive economy and high wages, it also suffers from some of the nation’s highest housing costs, driving a significant number of the state’s residents to seek more affordable options.
Perhaps surprisingly, our search data implies that the Californians looking to leave the state, are not, in fact, its highest earners. The average budget of California renters who were searching for apartments in other states was $1,897 in 2022, which is 13 percent lower than the budget of those looking to remain in the state ($2,187). California was one of just five states where renters looking to move to a new state had lower budgets than those looking to remain in-state, and California had the widest gap among those five.
That said, the budgets of those renters leaving California were still 24% higher, on average, than the budgets of existing residents in the states they were moving to, the second largest such premium for any state. To demonstrate this more clearly, see the specific budget comparisons for the five states that California renters were most likely to be searching in:
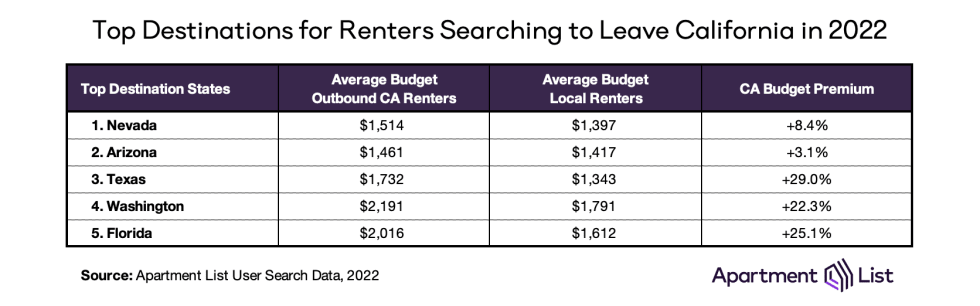
The most popular destinations were the neighboring states of Nevada and Arizona, which each accounted for 11 percent of out-of-state searches from California renters. Californians searching in Nevada had an average budget of $1,514, which was 8.4 percent higher than the average among renters already living in Nevada and looking to remain in the state. In Arizona, incoming Californians had a 3.1 percent budget premium over existing residents. Despite these premiums, the budgets of California renters looking to move to these states were much lower than the average among all Californians looking to leave the state, and also much closer to averages of in-state renters. It seems that lower-income Californians who are being priced out of the state are most likely to move to these more budget-friendly bordering states.
Meanwhile, the budgets of inbound Californians were much higher for the other states on this list, both in absolute and relative terms. In Texas, for example, renters searching from California had an average budget that was 29 percent higher than that of in-state renters. And California renters looking to move to Washington or Florida had average budgets of over $2,000, translating to premiums of over 20 percent compared to existing residents of those states. These longer-distance moves may reflect wealthier Californians moving to booming and increasingly pricey markets such as Austin and Miami.
These data demonstrate the ripple effects of California’s housing shortage and affordability crisis. As more renters leave, they may alleviate their personal housing cost burden, but are putting increased pressure on the markets they move to. In 48 of 50 states, the average apartment budget of inbound Californians was higher than that of local renters.
High-income New Yorkers seek out the sun
New York was the only state to experience a sharper population decline than California from 2020 to 2022. The state lost over 524,000 residents during that span, amounting to 2.6 percent of its population. New York had the largest population decline of any state from 2020 to 2022 in both absolute and percentage terms.
Similar to California, New York was also one of the few states where renters looking to leave the state had lower average budgets than those searching in-state ($1,905 vs $1,987). But again, outbound New Yorkers were still offering budgets higher than those of existing residents in the states they were searching in (by 14 percent, on average). And unlike California, the most common destinations for renters looking to leave New York were not bordering states:1
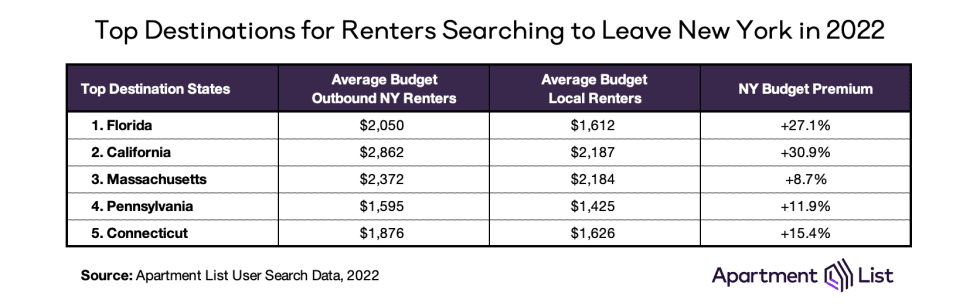
Thirteen percent of New York renters looking to leave the state were searching in Florida, and they had an average budget that was 27 percent higher than that of existing Florida renters looking to stay within the state. According to our estimates, Florida has had the second fastest rent growth of any state since the start of the pandemic (34.5 percent, trailing only New Mexico), and Tampa, Miami, Jacksonville, and Orlando all rank among the top 10 for fastest metro-level rent growth over that period. It seems that an influx of New Yorkers is a large part of that story.
After Florida, California was the second most popular destination for outbound New Yorkers. It may seem surprising that during a time of skyrocketing housing costs, renters would be looking to move to the epicenter of the affordability crisis, but this particular migration channel appears to be limited to wealthier New Yorkers. They had a substantial average budget of $2,862, which was 31 percent higher than that of Californians remaining in-state.
For more budget-conscious New Yorkers, Pennsylvania appears to be the prime destination. Renter looking to move from New York to Pennsylvania had an average budget of $1,595. This was still higher than the average among the state's existing renters, but by a somewhat smaller margin of 12 percent.
Conclusion
In 2022, 40 percent of Apartment List users were searching for their next home in a different metro from where they currently live, and 27 percent were searching in a new state entirely. Such long-distance moves tend to be more common among higher-income renters, with those searching in a new metro or state coming with higher budgets than the existing residents of the markets they’re searching in. We see renters searching out of the most expensive parts of the country, such as California and New York, and flocking to areas that were previously affordable, but where this spiking demand has begun to drive up prices. This dynamic is particularly relevant at a time when housing affordability has been rapidly worsening and remote work has enabled greater geographic flexibility.
Complete metro- and state-level migration data
For access to granular data, the tables below offer summaries for over 100 metropolitan areas and all 50 states + DC.
Metro-Level Migration Data
| Metro | Outbound Share (1) | Top Outbound Location (2) | Inbound Share (3) | Top Inbound Location (4) |
|---|---|---|---|---|
| Akron, OH | 44.3% | Cleveland, OH | 45.3% | Cleveland, OH |
| Albany, NY | 44.3% | New York, NY | 39.4% | New York, NY |
| Albuquerque, NM | 26.3% | Santa Fe, NM | 38.0% | Phoenix, AZ |
| Allentown, PA | 40.6% | Philadelphia, PA | 51.5% | Philadelphia, PA |
| Ann Arbor, MI | 57.7% | Detroit, MI | 49.8% | Detroit, MI |
| Asheville, NC | 39.2% | Greenville, SC | 56.3% | Charlotte, NC |
| Atlanta, GA | 39.0% | Savannah, GA | 29.0% | New York, NY |
| Augusta, GA | 38.2% | Atlanta, GA | 50.8% | Atlanta, GA |
| Austin, TX | 47.0% | San Antonio, TX | 43.4% | Houston, TX |
| Baltimore, MD | 52.3% | Washington, DC | 35.5% | Washington, DC |
Table notes:
- The share of searches from the metro (ie. outbound searches) that are destined for apartments outside the metro.
- Among outbound searches leaving the metro, the most popular destination.
- The share of searches into the metro (ie. inbound searches) that originated from users who lives outside the metro.
- Among inbound searches into the metro, the most popular source location.
State-Level Migration Data
| State | Outbound Share (1) | Top Outbound Location (2) | Inbound Share (3) | Top Inbound Location (4) |
|---|---|---|---|---|
| Alabama | 36.6% | Georgia | 29.0% | Georgia |
| Alaska | 26.6% | Washington | 52.9% | Washington |
| Arizona | 21.3% | California | 29.3% | California |
| Arkansas | 35.9% | Texas | 38.6% | Texas |
| California | 17.5% | Nevada | 16.7% | Texas |
| Colorado | 30.6% | Missouri | 34.7% | Texas |
| Connecticut | 31.1% | Massachusetts | 29.1% | New York |
| Delaware | 37.5% | Pennsylvania | 48.6% | Pennsylvania |
| District of Columbia | 62.0% | Maryland | 67.6% | Maryland |
| Florida | 18.3% | Texas | 24.1% | New York |
Table notes:
- The share of searches from the metro (ie. outbound searches) that are destined for apartments outside the metro.
- Among outbound searches leaving the metro, the most popular destination.
- The share of searches into the metro (ie. inbound searches) that originated from users who lives outside the metro.
- Among inbound searches into the metro, the most popular source location.
- For the purpose of this analysis, we exclude the searches of users remaining within the New York City metro, even if they cross state boundaries into New Jersey or Connecticut.↩
Share this Article

