The Persistent Effects of Residential Segregation

Significant patterns of residential segregation are present today in all of the nation’s large metropolitan areas. In many cases, segregated neighborhoods were initially created deliberately to keep black families out of white neighborhoods, and our nation’s black population is still the most highly segregated minority group.
Today, residential segregation is most extreme in the metros whose populations have grown the least since 1970, indicating the lasting impacts of de jure segregation in the U.S.
Those living in neighborhoods with concentrated minority populations struggle more to pay rent. In Census tracts with concentrated minority populations, the median renter income is an average of 28 percent below the metrowide median. However, median rents in these neighborhoods are only 12 percent below the metro median, leading to greater rent burdens in minority neighborhoods.
Metros with higher levels of residential segregation also tend to have larger gaps in homeownership rates between white and minority households, and this relationship holds for all minority groups. Black households, in addition to facing the highest rates of residential segregation, also tend to have lowest homeownership rates.
Overall rates of residential segregation have fallen since 2009, but only slightly. The metros with the fastest growing populations over that period have seen the smallest reductions -- or even small increases -- in their residential segregation indexes.
Download Complete Metro-Level Data
Introduction
America’s cities are growing increasingly diverse, a trend that is expected to continue for decades to come. However, despite the popular notion of our nation as a melting pot, minority populations are often concentrated in specific neighborhoods, while other neighborhoods remain primarily, and in some cases almost exclusively, white. This pattern is known as residential segregation.
In many cases, these housing patterns did not emerge naturally and, instead, represent the lasting impacts of policies -- both informal and institutionalized -- specifically aimed at marginalizing minorities, with the black population facing the worst of this discrimination. As a result of such practices, many minority neighborhoods remain economically disadvantaged, contributing to the intergenerational persistence of racial inequality in America.
Although this year represents the 50th anniversary of the Fair Housing Act, we still have a long way to go to ensure that equality of opportunity is not negatively impacted by the neighborhood in which a person is raised. In order to better understand this important issue, Apartment List analyzed data for Census tracts -- small geographic areas within cities, roughly comparable to neighborhoods -- to see how residential segregation is currently manifested in housing markets across the U.S. and how housing costs and homeownership rates vary within metros based on tract-level racial composition.
Even in metros with the lowest rates of segregation, clear patterns exist
In order to quantify the level of residential segregation within a given metro, we calculate a “segregation index” for each minority group. This index can be interpreted as the percentage of the minority group that would need to move to a different neighborhood in order for the distribution of minorities in each neighborhood to match that of the metro as a whole. For each metro, we calculate an overall segregation index for all minorities, as well as specific indexes for individual minority groups.1
To better visualize what patterns of residential segregation look like, the following maps show the white share of tract-level population across the Milwaukee metro -- the metro with the highest overall segregation index of the 50 largest metros -- and the Seattle metro, which has the second-lowest overall segregation index:
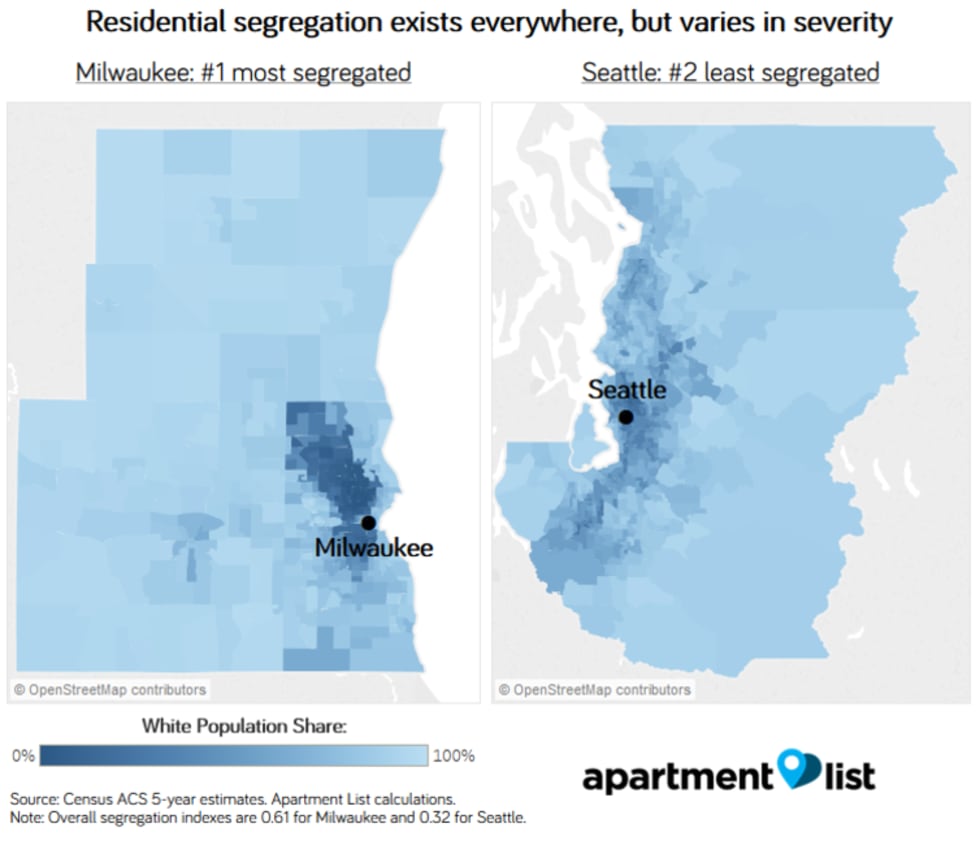
In Milwaukee, the severity of residential segregation is evidenced by the stark divide between the dark blue sections of the map, where minority populations are concentrated, and the light blue sections which are overwhelmingly white. In the Milwaukee metro as a whole, minorities make up 32 percent of the population, but rather than being evenly dispersed throughout the metro, 55.8 percent of Milwaukee’s minorities live in Census tracts that are less than 25 percent white. The issue is even more extreme for Milwaukee’s black population, 74.6 percent of whom live in concentrated minority tracts. Meanwhile, minorities are largely absent from many other parts of the metro
Compared to Milwaukee’s 0.61 overall segregation index, the Seattle metro has an overall index of 0.32, the second-lowest of the nation’s 50 largest metros. In comparison to Milwaukee, the map for Seattle contains a fuller spectrum of shades between the two extremes. That said, even here, there are still clearly discernible patterns of minority concentration.
Echoes of the past reverberate in today’s residential segregation patterns
Importantly, rates of residential segregation vary not only by geography but also across different minority groups. The chart below shows the average segregation indexes across the nation’s 250 largest metros for the three largest minority groups; use the drop-down filter to see figures for a specific metro:
The presence of residentially segregated neighborhoods affects all minority groups, but the issue is most extreme for black households. Black populations are the most segregated minority group in all of the nation’s 25 largest metros except for Phoenix, where the Hispanic segregation index is highest. Across the 250 largest metros, the average black segregation index is 25 percent higher than the average index for Hispanic Americans, the second most segregated minority.
The segregation of black communities is deeply rooted in our nation’s history. Exclusionary zoning and restrictive covenants openly barred black households from moving into white neighborhoods across the country until well into the second half of the 20th century. Redlining, another historic policy, reinforced racial boundaries and made it impossible to obtain a conventional mortgage in black neighborhoods, depriving these areas of the stability and wealth creation associated with homeownership. These policies and other related factors led to higher concentrations of poverty in minority neighborhoods, and the persistence of significant wealth gaps has served to reinforce patterns of residential segregation.
Our analysis shows that the legacy of these policies persists in today’s segregation patterns. We find that residential segregation is most extreme in metros that were well established before 1970. Meanwhile, minority populations tend to be more evenly distributed in areas that have experienced rapid growth in the decades since the passing of the Fair Housing Act.
The historical origins of segregation are reflected by the upward sloping trend in the chart above, which indicates that areas in which patterns of residential development were most established in 1970 display the highest levels of residential segregation in 2016, likely for the historical reasons described above.2
In contrast, areas whose residential development occurred largely after 1970 show the lowest rates of segregation, consistent with the persistent effects of historical policies. That said, no metro in the U.S. is devoid of residential segregation patterns, including those whose development is more recent, suggesting that historical policies are not the only factor bringing about segregation. Although explicit forms of residential segregation have been outlawed, there is still evidence that subtler discriminatory forces are at play, even today.
Looking at more recent trends, we find that levels of residential segregation have been declining since 2009, but only slightly. The black segregation index only fell by 2.4 percent from 0.61 in 2009 to 0.59 in 2016. The Hispanic segregation index fell by a similar amount, while the Asian index actually increased slightly. The dynamics of changes in residential segregation can play out in various ways:
- In metros such as San Francisco, Boston and New York -- which have become increasingly expensive as local economies have grown without sufficient increases in housing supply -- lower rates of residential segregation may be the result of gentrifying minority neighborhoods.
- Another group of cities, including Charlotte, Raleigh and Las Vegas, are experiencing rapid growth, but have simultaneously expanded their housing supplies. These cities are seeing slight increases in residential segregation, perhaps linked to the type of residents flowing to their newest suburbs.
- Meanwhile, many of the Midwestern “legacy cities” seeing the largest declines in segregation -- such as Detroit, Pittsburgh and Cleveland -- are struggling with stagnant local economies, indicating that declining rates of residential segregation may not always coincide with better economic opportunities for minorities.
Renters in minority neighborhoods are more burdened by housing costs
The consequences of residential segregation can be seen in the fact that minority neighborhoods differ from white neighborhoods within the same metro across a range of key economic indicators. The following chart analyzes neighborhoods with concentrated white and minority populations, looking at how the median renter incomes and median rents of each neighborhood type compare to the overall medians for their respective metros:
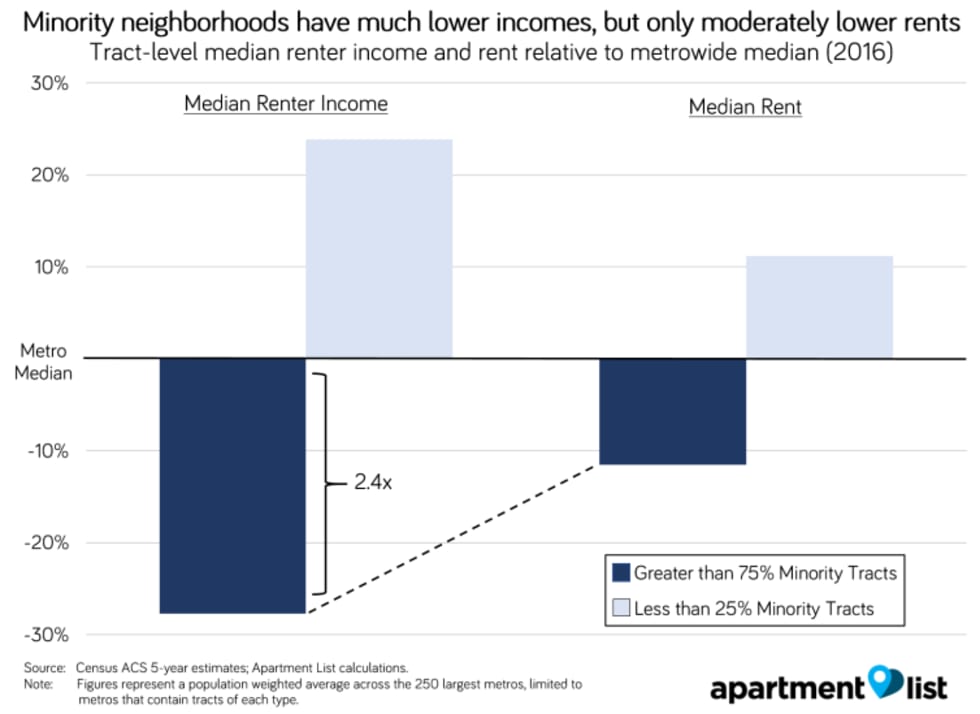
In tracts with concentrated minority populations, the median renter income is 28 percent lower than the metrowide median. Meanwhile, tracts with low minority shares have median renter incomes that are, on average, 24 percent above the metrowide median. Notably, the variation in rents across these neighborhood types is far more muted. In concentrated minority tracts, the median rent is 12 percent below the metrowide median on average, while in concentrated white tracts, it is 11 percent above the metrowide median.
This means that although renters in minority neighborhoods tend to have significantly lower incomes, they are not paying proportionally lower rents. As a result, residents of these neighborhoods incur a greater cost burden. In concentrated minority tracts, 60 percent of renters are cost burdened, meaning that they spend more than 30 percent of their income on rent. In concentrated white neighborhoods, 46 percent of renters are cost burdened, still a substantial share, but significantly less than in minority neighborhoods.3
One explanation for the disproportionate difference in rents and incomes between white and minority neighborhoods could relate to the fact that low-income renters -- who are overrepresented in concentrated minority neighborhoods for reasons described above -- tend to have lower credit scores, indicating a greater risk of rent payments. Property owners may be charging a premium to offset this risk, another piece of evidence lending credence to the observation that “it’s expensive to be poor.”
More segregated metros tend to have larger gaps between white and minority homeownership rates
For residents of minority neighborhoods, disproportionately high rents also keep homeownership further out of reach than for those living in more privileged white neighborhoods. Across the U.S., 72.4 percent of white households own homes, compared to 57.3 percent of Asian households, 48.4 percent of Hispanic households, and just 42.2 percent of black households. These gaps in homeownership rates vary by metro, and we find that higher levels of residential segregation are correlated with more severe homeownership rate gaps, as demonstrated by the downward slopes in the following chart:
Note that the three sets of markers tend to cluster in different areas of the chart:
- The orange markers representing the black populations in each metro are concentrated in the lower-right area of the chart, meaning that black households are the most segregated, and also have the largest gap in homeownership rates compared to white households.
- Hispanic populations (shown in grey) tend to be less segregated than black households, and in most metros, they also have higher homeownership rates.
- Asian households have homeownership rates that are closest to matching the white homeownership rates, as evidenced by the blue markers appearing closer to the top of the chart.
Importantly, all three sets of markers display the same downward sloping trend, indicating that higher levels of residential segregation are indicative of greater gaps in homeownership rates at the metro level for all minority groups. Low minority homeownership rates are one of the drivers of inequality in the U.S., given that building equity through homeownership is the primary form of wealth creation for many households. Since the wealth accumulated through housing is often passed down across generations, these effects can persist for great lengths of time.
Conclusion
Residential segregation was originally enforced with the explicit intention of denying America’s black population access to opportunity, and the effects of these policies are still evident in today’s housing markets. The high levels of residential segregation that we still observe make it clear that this historically-rooted problem is one that our society has not yet solved. This issue has broad implications, since the neighborhoods in which we grow up play an important role in our success as adults.
Moving to a neighborhood with greater access to opportunity has a significant effect on intergenerational mobility, particularly when the move occurs early in childhood. The importance of neighborhoods goes beyond economic factors. For example, residential segregation has been linked to adverse health outcomes for minorities. These outcomes are not inevitable. Research has shown that allowing people to move away from high-poverty communities into low-poverty communities leads to significantly improved rates of college attendance and higher adult incomes for children who were younger than 13 before the move.
One option for counteracting the negative effects of residential segregation is to expand benefits for low-income rental assistance and to allow recipients to use those benefits to move to high-opportunity neighborhoods. That said, cost-burden rates are high even among populations who may not qualify for government assistance, demonstrating a lack of affordable housing that affects many of our nation’s cities. Policies aimed at increasing the supply of affordable housing while also prioritizing the creation of more economically-mixed neighborhoods could go a long way toward addressing the persistent problem of residential segregation.
Download Complete Metro-Level Data
- We present data for black, Hispanic and Asian populations, the nation’s largest minority groups. All other minorities are categorized as “Other,” but because this group’s composition varies across metros, it offers limited insight and we do not present results for it here. Data for “Other” is available upon request.↩
- This relationship holds using the segregation indexes for all minorities but does the best job of explaining the black segregation index. For population weighted regressions of the 50 largest metros, with 2016 segregation indexes as the dependent variable and population growth since 1970 as the independent variable, R-squared values are 0.62 for the black segregation index, 0.14 for the Hispanic index, 0.29 for the Hispanic index, and 0.48 for the overall index. All models are significant at the 0.01 level. Full regression output is available upon request.↩
- Nationwide, 50 percent of all renters are cost burdened.↩
Share this Article
