The Racial Divide in Homeownership
The “American Dream” has long been tied up with the goal of owning a home. In addition to providing residential stability, homeownership is a primary driver of wealth creation for many Americans. That said, the fruits of homeownership are not shared equally across demographic groups. In a new report, Apartment List finds significant racial disparity in the homeownership rates among households headed by prime working age adults, aged 25 years to 54 years: 64.4 percent of white households are homeowners, compared to 54 percent of Asian households, 41.1 percent of Hispanic households, and just 32.7 percent of black households.
This racial divide underscores the increasing inequality that plagues the United States. By building equity, homeowners accumulate wealth, leading to the striking fact that the net worth of the average homeowner is 36 times more than that of the average renter. This makes it all the more troubling that minorities are less likely to own homes, particularly as their share of the population grows. The share of white households in the U.S. is currently 61.8 percent, down from 80.5 percent in 1980, and the Census Bureau projects that more than half of the American population will belong to a minority group by 2044.
To better understand this important issue, Apartment List dug into Census data1 from 1980 to 2015, looking at trends in owner and renter populations nationwide, broken down by race2, education and income. In order to control for differences in age distributions across races, we limited our analysis to households headed by adults between the ages of 25 and 54, considered prime years of employment.3
White households have a significant advantage in homeownership
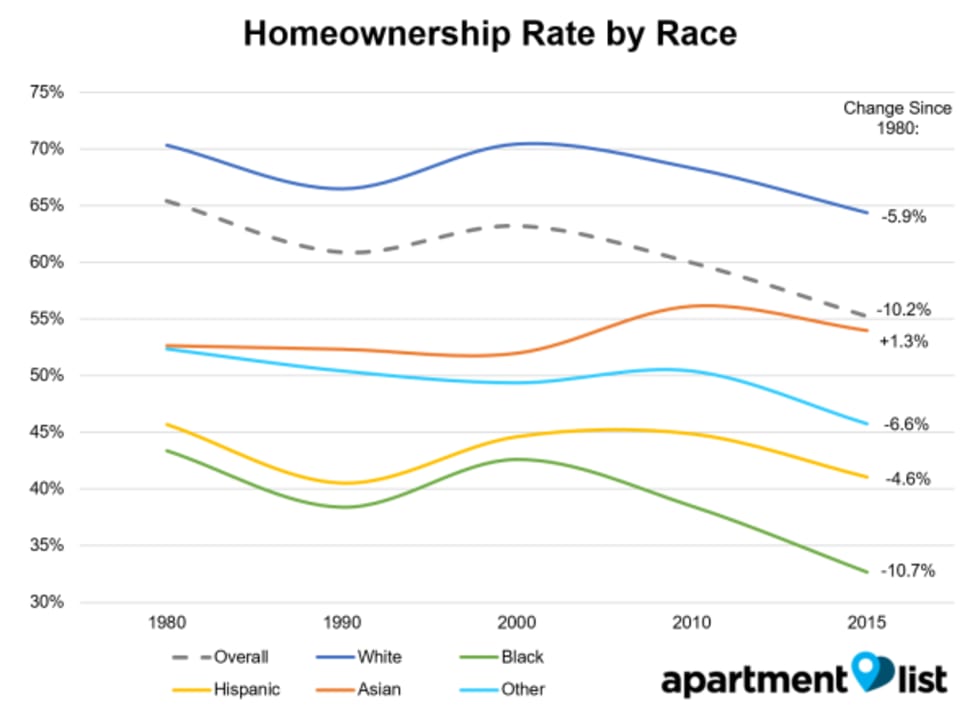
White households have long been overrepresented as homeowners. The white homeownership rate is significantly higher than that of any other race, a fact that has remained true for decades. Even after falling by 5.9 percent since 1980, the white homeownership rate in 2015 (64.4 percent) was still more than 10 percent higher than that of Asians (54 percent), the group with the second-highest rate of homeownership.
Notably, the black homeownership rate (32.7 percent) has fallen drastically since 2000 and is now just over half the rate for whites. As a result of this gap in homeownership rates, white households make up nearly three-quarters of owners but account for less than half of renter households.
College degrees increasingly necessary for homeownership
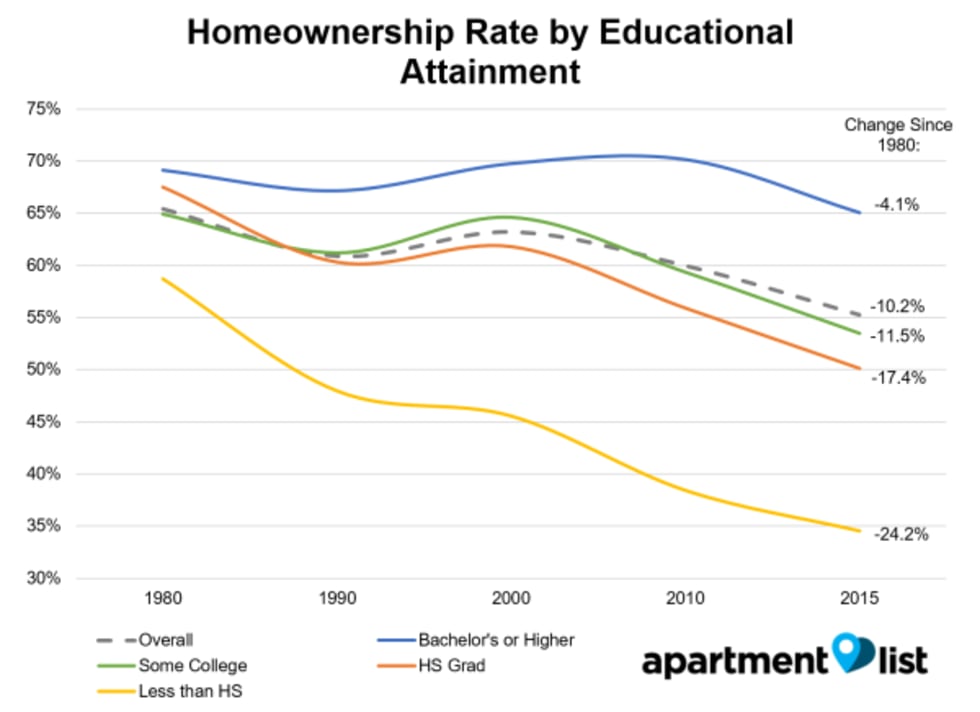
Homeownership used to be relatively achievable at all levels of educational attainment, but gaps based on education have widened. Since 1980, people with college degrees have seen homeownership rates fall by 4.1 percent to 65.1 percent in 2015 from 69.1 percent in 1980, while those without four-year degrees have seen double digit decreases over the same period. There is now a 15 percentage point gap between the homeownership rates for those with college degrees and those with a high school diploma.
This increased disparity in homeownership by education can be attributed to a changing economy, in which more well-paid jobs require a college education. There are fewer jobs available for those who did not attend college, and the jobs that do exist are now more concentrated in low-wage service industries.
The low homeownership rates among those without college degrees is particularly troubling in light of the discrepancies in educational attainment across races. We find that 42.2 percent of white householders have at least a bachelor’s degree, compared to just 25.1 percent of blacks and 18.2 percent of Hispanics. On the other hand, 65.8 percent of Asians have a four-year degree, making them the most educated group and explaining their increasing homeownership rate.
Discrepancies in homeownership rates by race persist, regardless of education or income
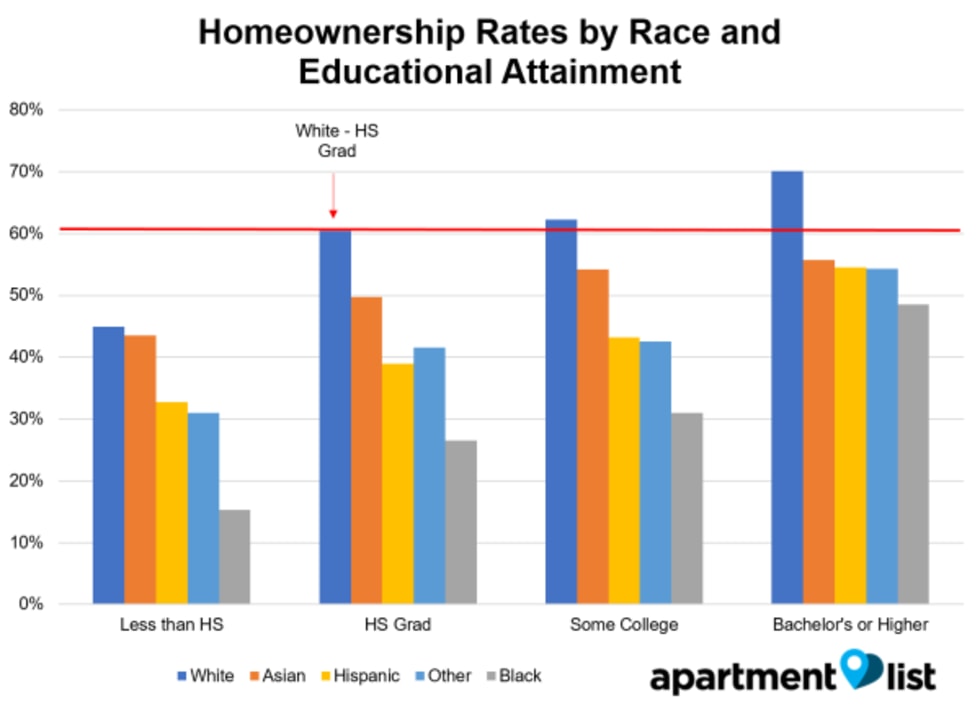
Although differences in educational attainment partially explain discrepancies in homeownership rates by race, the gaps persist even when we control for this factor. Homeownership rates for minorities with college degrees are lower than those for whites with only a high school diploma.
Black Americans have the lowest homeownership rates at all education levels, but the divide is starkest for the least-educated groups. The black homeownership rate for those who did not graduate high school is just 15.3 percent, while the rate for whites with that same education level is nearly three times as high, at 44.9 percent.
Over time, these gaps have narrowed slightly for those who did not attend college, but the opposite is true for those with college degrees. In 1980, the gap between the white homeownership rate and the average of the rates for minority groups was 23.1 percent for those with high school diplomas - that gap closed to 21.3 percent by 2015. Meanwhile, for those with college degrees, the gap widened by 2 percent from 14.9 percent in 1980 to 16.9 percent in 2015. A similar trend can be seen when the data are broken down by income. Whites have the highest homeownership rates at all income levels, with black and Hispanic households at a particular disadvantage. For example, white households earning less than $25,000 annually have a homeownership rate that is 2.4 times higher than the rate for blacks in that income bracket.
Diversity highest in California and Texas, and increasing everywhere
To better understand how these dynamics play out geographically, we break down the data on diversity and homeownership at the state and metro levels. We first look at how overall diversity varies across the nation. To measure the distribution of races in a geographic area, we calculate a “diversity index,” which measures the probability that two household heads chosen at random are of a different race from each other. A higher score indicates greater diversity.
At the state level, Hawaii ranks most diverse, followed by California and Texas. Overall, states across the South and on both coasts tend to be most diverse. By contrast, the least diverse areas are found in northern New England and across the Midwest and Rocky Mountain states.
At the metro level, seven of the 10 most diverse metros are located in just three states: California, Texas and Florida.
The ten most diverse metros identified in our analysis all have a share of white households below 50 percent, meaning that a majority of their populations belong to minority group. As of 2015, that is true in 15 of the 50 largest metros, up from just three metros--Los Angeles, San Antonio and Miami--in 2000.
From 2000 to 2015, the share of white households decreased in all of the 50 largest metros, while the share of Hispanic and Asian households increased in all 50 metros, and the share of black households increased in 41 metros.
Northeast and Midwest have largest gaps in homeownership rates by race
In order to measure how the gap in homeownership rates across races varies regionally, we calculate the “average homeownership race gap.” To arrive at this measure, we find the race with the highest homeownership rate, calculate the gap between that maximum rate and the rate for each remaining group and take an average of the gaps across all races. At the state level, the gaps are clearly worst in the northern part of the country, from east to west.
The largest gaps at the state level are found in South Dakota, North Dakota, Montana, Minnesota and Vermont. At the metro level, two areas in New York -- Buffalo and Rochester -- have the biggest gaps.
In Buffalo, the white homeownership rate is 67.8 percent, while the average homeownership rate across minority races is just 27.3 percent, a staggering gap of over 40 percentage points. With the exception of New Orleans and Memphis, these metros are all located in the Northeast, Rust Belt and Midwest and have a diversity index below the national average. For example, the national diversity index was 56.9 percent as of 2015, compared to 39.3 percent in Buffalo, 38.9 percent in Minneapolis and 27.1 percent in Pittsburgh.
Discrepancies in homeownership by race are seen across the nation, with blacks and Hispanics at a particular disadvantage. Of the largest 50 metros, blacks have the lowest homeownership rate in 42 metros, Hispanics in seven metros and “other” in one metro. Conversely, whites have the highest homeownership rates in 35 metros, Asians in 14 metros and “other” in one metro.
On the other end of the spectrum, Florida and California are each home to three metros among the ten with the smallest average race gaps.
However, even the smallest average gap is in the double digits, and gaps for black and Hispanic households are often much worse. Most of these metros are located in the South or in California, and seven of the ten metros have diversity indexes above national average. In particular, Miami, Washington, D.C., Las Vegas, San Jose and Los Angeles are also among the ten most diverse metros.
Homeownership gaps shrinking, but not for black households
Comparing data from 2000 and 2015, we found that the average homeownership race gap shrank in 31 of the 50 largest metros. However, looking at the average gap masks nuance in how gaps are changing for each race. To provide a more complete picture, the following chart plots the 2015 homeownership rate against the change in the homeownership gap for each minority race, across the 50 largest metros. A positive value on the horizontal axis indicates that the homeownership gap for the given race in the given metro has grown more severe over time, while a negative value indicates a narrowing gap:
Despite the average gaps closing, this increasing equality is not shared across all races. This data shows that black households are clearly faring worst - they generally have the lowest homeownership rates, and these gaps are widening in most metros. Hispanic households are doing slightly better, with generally higher homeownership rates, and gaps that are narrowing in just over half of the largest metros. Asian households have performed best, with higher homeownership rates than other races, and gaps closing in most metros.
At the national level, the gap in homeownership rates closed by 8 percent for Asian households, by 2.5 percent for Hispanic households and by 2.4 percent for households classified as “other.” However, the gap for black households has widened by 3.9 percent.
Higher diversity correlated with smaller homeownership gaps, but not necessarily higher homeownership rates
Looking across the 50 largest metros, we find a strong correlation between an area’s diversity index and its average homeownership race gap.
The above chart suggests that more diverse cities tend to have less severe discrepancies in homeownership rates across races.
This phenomenon seems to be partially attributable to the role of education. Of metros with a diversity index above the national average, more than two-thirds of metros are also above the national average for the share of minorities with college degrees. Similarly, of metros that are less diverse than the national average, three-quarters also have a below average share of minorities with college degrees. That said, it’s important to keep in mind that even the smallest gaps are still significant, with discrepancies in homeownership rates across races existing at all levels of educational attainment.
These trends suggests opportunities for minorities tend to be better in more diverse areas. While diversity at the metro level does not necessarily imply diverse neighborhoods, it’s been observed previously that diverse neighborhoods lead to improved outcomes for minority populations.
It’s important to note, however, that smaller gaps do not necessarily translate to higher homeownership rates. To account for this, the following chart plots an area’s homeownership gap against its overall homeownership rate. Horizontal and vertical lines represent the average rates across the 50 largest metros.
Metros in the lower right corner provide the best homeownership opportunities for all races, with above average homeownership rates and below average gaps across races. Metros meeting these criteria include Birmingham, Washington, D.C., Kansas City, and Austin.
Many metros with above average homeownership rates, however, also have above average gaps (upper right quadrant). This is particularly true of Midwest and Rust Belt cities such as Minneapolis, Pittsburgh and Rochester.
Metros in the lower right have lower than average discrepancies in homeownership by race, but low overall homeownership rates - these include a number of expensive California markets, including San Diego, Los Angeles and San Jose.
Conclusion
As the renter population in the United States continues to grow, it’s crucial to note that an outsized share of these households are occupied by minorities. Homeownership is crucial to residential stability and wealth creation. Yet, every minority race is at a double digit disadvantage in achieving homeownership when compared to white households. Gaps in homeownership rates exist regardless of educational attainment or income. We find that these gaps exist in all of the nation’s largest metros, but that they tend to be worst in Midwestern and Rust Belt metros with low diversity. We also find that homeownership gaps are generally worst for black and Hispanic households.
With these trends in mind, and with the country growing more diverse every day, it’s increasingly important to prioritize policies aimed at promoting homeownership among minority and low-income Americans to lessen inequality. For example, an emphasis on increasing diversity and integration at the neighborhood level has been shown to benefit poor and minority households. There is also a strong need for increased construction of affordable entry-level homes across the country.
As a step toward improved housing equality, lawmakers should also reconsider the mortgage interest tax deduction, which primarily benefits wealthy households. Recent research indicates that mortgage interest deductions may not even be effective in boosting homeownership. The gaps in homeownership rates across races serve as a striking reminder of how far the United States still has to come in achieving housing equality, and it’s crucial that we strive to work toward more effective and inclusive tools for boosting homeownership for all Americans.
| Metro | Diversity Index (2015) | Diversity Index (2000) | Change in Diversity Index (2000-2015) | Average Ownership Gap (2015) | Average Ownership Gap (2000) | Change in Average Ownership Gap (2000-2015) |
|---|---|---|---|---|---|---|
| New York, NY | 69.0% | 62.8% | 6.2% | 24.5% | 31.1% | -6.6% |
| Los Angeles, CA | 69.2% | 68.3% | 0.9% | 17.1% | 15.5% | 1.5% |
| Chicago, IL | 62.4% | 54.5% | 7.8% | 22.8% | 26.0% | -3.2% |
| Dallas, TX | 67.4% | 55.5% | 11.8% | 18.6% | 20.4% | -1.8% |
| Houston, TX | 69.8% | 63.7% | 6.2% | 18.0% | 19.5% | -1.5% |
| Washington, DC | 68.3% | 59.0% | 9.3% | 15.1% | 21.6% | -6.5% |
| Philadelphia, PA | 57.2% | 44.6% | 12.6% | 25.5% | 25.6% | -0.1% |
| Miami, FL | 65.8% | 65.7% | 0.1% | 13.0% | 17.1% | -4.0% |
| Atlanta, GA | 64.4% | 53.2% | 11.2% | 20.2% | 27.8% | -7.6% |
| Boston, MA | 47.5% | 31.9% | 15.5% | 27.2% | 32.8% | -5.6% |
- Data for 2010 and 2015 come from the American Community Survey. Data for 1980, 1990 and 2000 are based on decennial censuses.↩
- The Census survey includes questions on both race and ethnic origin, and Hispanics are able to identify as any race. For the purpose of this analysis, we classify non-overlapping groups in which respondents who identify as having Hispanic ethnic origin are labeled “Hispanic.” “Other” includes Native Americans and respondents who identify as more than one race.↩
- All analysis is performed at the household level, with race classification and age filters applied to the head of household.↩
Share this Article
