2019 Cost Burden Report: Half of Renter Households Struggle With Affordability

- Nationally, the share of renters who are cost-burdened increased slightly from 49.5 percent in 2017 to 49.7 percent in 2018. This represents the first time that the national cost burden rate has increased since 2014.
- The number of cost-burdened renter households jumped by 299,000 from 2017 to 2018, and is now 2.8 million higher than it was in 2008. Although the cost burden rate has fallen meaningfully from its 2011 peak, most of that improvement has been driven by an influx of high-income households to the rental market.
- The median rent grew faster than the median renter income for the first time since 2011. Although the gap between rent growth and renter income growth widened only slightly, high-income renters are likely also lending a more positive skew to these figures.
- The Miami metro has a cost burden rate of 62.7 percent, the highest of the nation’s 100 largest metros. In 19 of the nation’s 25 largest metros, a household earning the median renter income would be burdened by the median rent.
Download Complete National and Local Data
Introduction
In spite of a low unemployment rate and increasing wages, virtually half of American renter households struggle with their housing costs. According to the most commonly accepted measure of housing affordability, a household is considered to be “cost-burdened” if housing costs eat up more than 30 percent of household income. By that metric, 49.7 percent of American renter households were cost-burdened in 2018, according to newly-released data from the Census American Community Survey. This represents a slight increase in the cost burden rate over the previous year.
Although the rate is still well below its 2011 peak, that improvement has been primarily driven by compositional changes in the rental market, namely, an influx of high-income renter households. Housing costs have amplified growing economic inequality in recent years -- those at the low-end of the income distribution have seen their housing costs grow disproportionately fast, while the highest earners have actually seen their housing costs fall. In this report, we explore what the most recent data is telling us about the current state of the housing affordability crisis.
The number of cost-burdened renter households increased by 299K from 2017 to 2018
The primary point that jumps out in this year’s data is that the number and share of renter households that are cost-burdened increased for the first time since 2014. The national cost burden rate ticked up from 49.5 percent in 2017 to 49.7 percent in 2018. The share of moderately-burdened renters held steady at 24.9 percent, while the share of severely-burdened renters -- those who spend at least half of their income on rent -- grew from 24.7 percent to 24.8 percent.
These figures speak to the magnitude of the housing affordability crisis. Essentially half of renter households are spending more than the recommended amount on their housing costs, while nearly one in four spends at least half of their household income on rent.
While the uptick in the overall cost burden rate may seem slight, framing the data in terms of the change in the number of cost-burdened households paints a more stark picture. The chart below shows the change in the number of renter households since 2008, broken out by cost burden status.
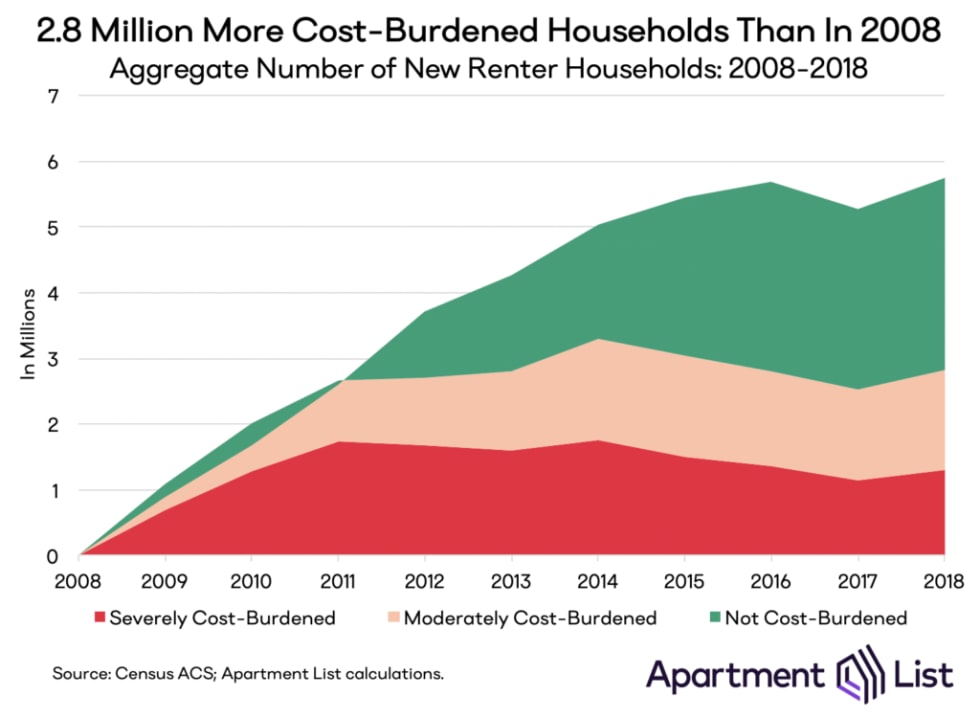
The number of cost-burdened renter households jumped by 299,000 from 2017 to 2018, and is now 2.8 million higher than it was in 2008. The cost burden rate peaked in 2011 at 53.4 percent, and has since fallen by 3.7 percent. However, the number of cost-burdened households is 0.8 percent higher than it was in 2011.
This disparity between the trends in the cost burden rate and the number of cost-burden households highlights an important nuance in this data -- recent improvements in the cost-burden rate have been driven primarily by an influx of high-income households to the rental market, rather than by a significant reduction in the number of cost-burdened households. While the number of cost-burdened households fell steadily from 2014 to 2017, this year’s data reflect a troubling reversal of that trend. The number of unburdened renter households also increased from 2017 to 2018, muting the increase in the cost burden rate.
This worsening situation for renters is also apparent when we compare growth in the median renter income to growth in the median rent. The chart below shows that the median rent grew faster than the median renter income for the first time since 2011.
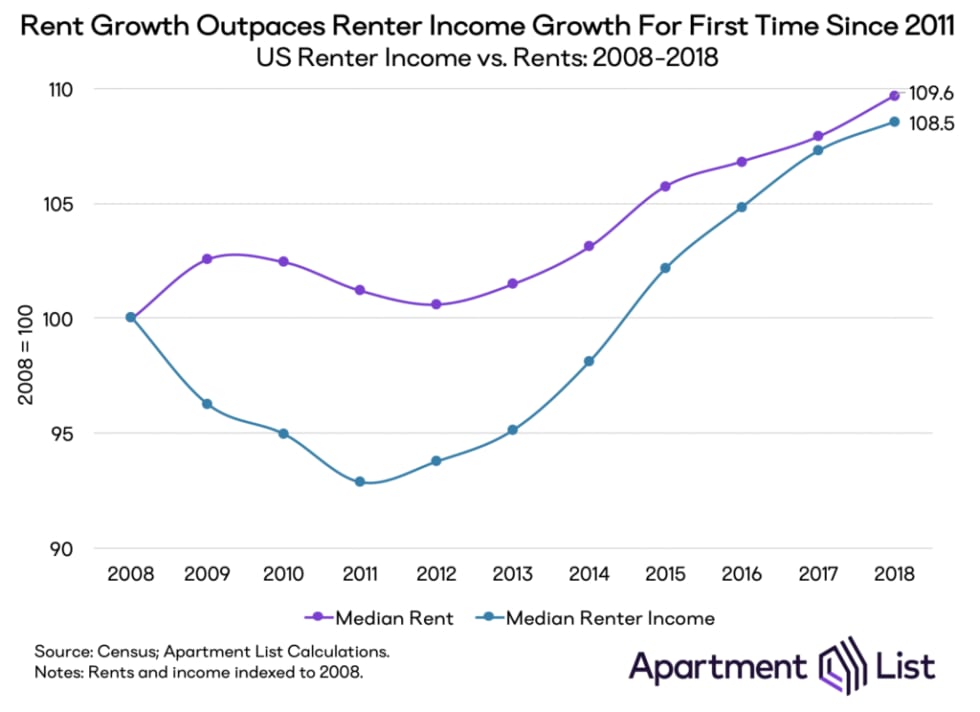
The gap between income growth and rent growth had been closing steadily for years, but widened slightly from 2017 to 2018, as the median rent grew by 1.6 percent, compared to 1.2 percent for the median renter income. While that difference is fairly small, it is important to note that these figures are subject to the same compositional effects described above.
The number of renter households earning more than $100,000 per year more than doubled from 2.8 million in 2008 to 6.1 million in 2018, and just 3.6 percent of these households were cost-burdened in 2018. Over the same period, the number of renter households earning less than $35,000 actually fell slightly from 20.3 million to 19.3 million, but the share of these households who are cost-burdened increased from an already staggering 78.3 percent in 2008 to 84.1 percent in 2018.
The median renter is cost-burdened in 19 of the 25 largest metros, with Miami renters struggling most
The map below shows the new 2018 cost burden data for more than 500 metropolitan areas across the country. The markers for each metro are shaded based on the local cost burden rate, with darker shades corresponding to higher rates, while the size of the markers corresponds to the total number of cost-burdened renter households in the metro.
Cost burden rates continue to be highest in coastal areas with high housing costs. Miami has a cost burden rate of 62.7 percent, the highest of the nation’s 100 largest metros, followed by New Orleans at 60.1 percent. At the state level, Florida has the highest cost burden rate at 56.5 percent. Nearly one in three cost-burdened renters (30.2 percent) lives in California, New York or Florida. While these are also some of the nation’s most populous states, they make up a notably larger share of the cost-burdened renter population than of the overall population.
Another way of framing the affordability issue is to consider whether a renter household earning the median income would be able to comfortably afford the median rent. We found that in 19 of the nation’s 25 largest metros, a household earning the median renter income would be cost-burdened by the median rent. Of the 100 largest metros, the median renter would be burdened in 64 metros.
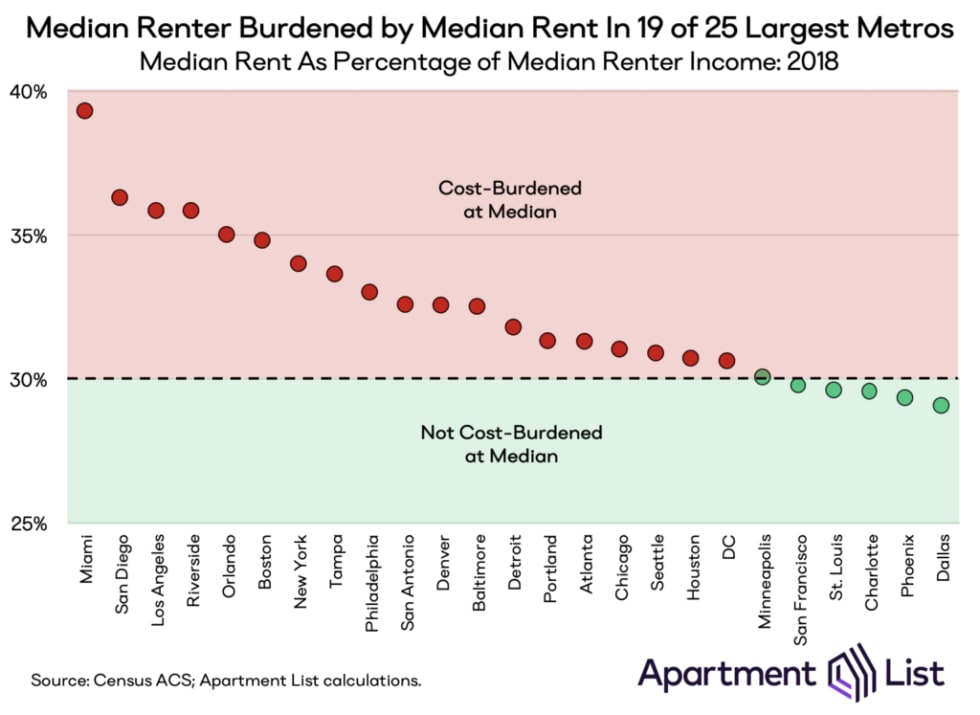
Miami again ranks worst on this metric, and by a fairly wide margin. A household earning the median renter income in the Miami metro would need to spend 39.3 percent of that income to afford the area’s median rent, well over the 30 percent threshold. After Miami, the median renter is most burdened in the southern California metros of San Diego, Los Angeles, and Riverside. Framing the problem in this way highlights the fact that rental housing affordability affects not just low-income households, but also millions in the middle-class.
There are only six metros — Dallas, Phoenix, Charlotte, St. Louis, San Francisco, and Minneapolis — where the median renter can comfortably afford the median rent. While these areas are generally among the nation’s more affordable large metros, San Francisco represents a notable exception. Although the Bay Area has the nation’s highest median rents, it also boasts some of the best job opportunities. San Francisco is also one of the few American cities with rent control laws that keep prices below the market rate for long-tenured renters. These factors result in the counterintuitive fact that the San Francisco metro has a cost burden rate that is below the national average.
Finally, we dug into the dynamics of how rent growth and income growth have interacted to drive changes in cost burden rates over the past ten years. In the chart below, markers shaded red indicate metros where the cost burden rate has increased, while those shaded green saw their cost burden rates fall. Markers are sized according to overall metro population.
In metros that fall above the diagonal line, the median renter income grew faster than the median rent from 2008 to 2018, while in those that fall below the diagonal, the opposite is true. Note that in most metros above the diagonal, cost burden rates increased, while rates decreased in nearly all of those below the diagonal.
For example, in San Diego, the inflation-adjusted median renter income grew by 7.3 percent from 2008 to 2018. However, rents grew at more than double that rate, with an increase of 17.4 percent. Consequently, the metro saw a 2.5 percent increase in the share of renter households who are cost-burdened. Meanwhile, Raleigh saw the median renter income grow by 20.6 percent while the median rent grew at a more modest 17.1 percent, resulting in a 3.5 percent decline in the metro’s cost burden rate.
This relationship demonstrates that when income growth outpaces rent growth, cost burden rates will tend to fall. The cost burden rate has fallen over the past ten years in 54 of the 100 largest metros, but here again, compositional effects may be painting a picture that is more positive than the reality.
Conclusion
It is worth noting that the cost burden rate alone does not provide a comprehensive picture of the housing affordability issue. The 30 percent threshold is a somewhat coarse measure which does not fully capture the varied needs of different household types. For example, a high-income household without children may be able to comfortably pay more than 30 percent of its income on housing costs without facing a burden. On the other hand, it has grown increasingly common for Americans to live with roommates, and while the combined income of a set of roommates may be enough to lift the household out of cost-burdened territory, this trend of banding together to form larger households is undoubtedly driven by affordability concerns. Despite these limitations, the traditional cost burden metric has been shown to track well with more nuanced methods of measuring housing affordability.
With that in mind, it is notable that the magnitude of the cost burden problem worsened from 2017 to 2018, after years of gradual improvement. This is a troubling sign, as households that struggle to pay rent often cut back spending on other basic necessities and may ultimately face eviction, which can have adverse and long-lasting consequences. The acute nature of this problem has resulted in the issue of housing affordability getting more attention than it has at any point in recent memory.
As millions of Americans struggle to make their monthly rent payments, a wave of legislation at the local and state levels is aiming to remedy the problem from varying viewpoints. Upzoning reforms such as those in Minneapolis, Seattle, and Oregon are trying to reduce supply constraints by making it easier to build new housing, while increased tenant protections and rent control measures such as those in New York are trying to shield renters from increasing prices.
This momentum has begun to build to the national stage as well. 2020 Democratic candidates including Elizabeth Warren, Bernie Sanders, Kamala Harris, Cory Booker, and Julian Castro have all unveiled plans aimed at tackling the growing housing crisis head on. These candidates are hoping to mobilize the potentially crucial yet untapped voting bloc of American renters.
The data make clear that we have a long way to go to ensure that all Americans can comfortably afford the basic human need of housing. On a positive note, awareness of this issue seems to be increasing, and housing advocates and policy makers at both the local and national levels are attempting to work toward solutions.
Share this Article
