2018 Cost Burden Report: Despite Improvements, Affordability Issues Are Immense
- Nationally, the share of renters who are cost-burdened fell slightly from 49.7 percent in 2016 to 49.5 percent in 2017. This is the sixth straight year that this figure has decreased, and the 2017 cost burden rate is the lowest since 2007.
- That said, much of this decrease in the cost burden rate is attributable to an influx of high-income households to the rental market. The total number of rent-burdened households in 2017 was greater than the 2007 level by 3.1 million households. On the positive side, the number of rent-burdened households has fallen by 774,000 since its 2014 peak.
- The median renter income grew faster than the median rent for the sixth straight year. Although this is also driven by an influx of high-income renters, there is some indication that renters further down the income distribution may be starting to experience gains.
- Florida is the state with the highest cost burden rate at 56.4 percent. Nearly one in three cost-burdened renters lives in California, New York or Florida. At the metro level, Miami has a cost burden rate of 62.7 percent, the highest of the nation’s 100 largest metros. In 20 of the nation’s 25 largest metros, a household earning the median renter income would be burdened by the median rent.
Download Complete National and Local Data
Introduction
Although the American economy has experienced nearly a decade of continuous expansion, the gains of recent years have not been evenly distributed across the country’s population. Virtually half of renter households are cost-burdened by their housing costs, spending more than the recommended 30 percent of their incomes on rent.
The lack of affordable housing is an increasingly visible issue, with politicians seriously exploring various ways to address the issue. In perhaps the most high-profile example, Sen. Kamala Harris (D-CA) recently unveiled an ambitious piece of legislation that would provide tax credits to cost-burdened renters earning up to $100,000. That said, despite the increased political activity on the matter, just 22 percent of the housing-related bills introduced in the current 115th Congress specifically mentioned renters, and none of these have been passed into law.
Newly-released data from the Census American Community Survey shows that the share of renters who are cost-burdened fell slightly from 2016 to 2017. While the recent improvement is encouraging, it remains slight in comparison to the magnitude of the problem. In this report, we explore the most important insights to be gleaned from this new data.
While cost burden rates are improving, the number of burdened households remains elevated
The national cost burden rate fell slightly from 49.7 percent in 2016 to 49.5 percent in 2017. The share of severely burdened renters fell from 25.0 percent to 24.7 percent, while the share of moderately burdened renters ticked up from 24.7 percent to 24.9 percent.1 This is the sixth straight year that this figure has decreased, and the 2017 cost burden rate is the lowest since 2007.
While the recent improvement in the cost burden rate is a positive signal, the magnitude of the affordability issue remains immense. Essentially half of renter households are still spending more than the recommended amount on their housing costs, while nearly one in four spends at least half of their household income on rent.
Improvement in the overall cost burden rate also obscures changes in the composition of our nation’s renter population. The chart below shows the change in the number of renter households since 2007, broken out by cost burden status.
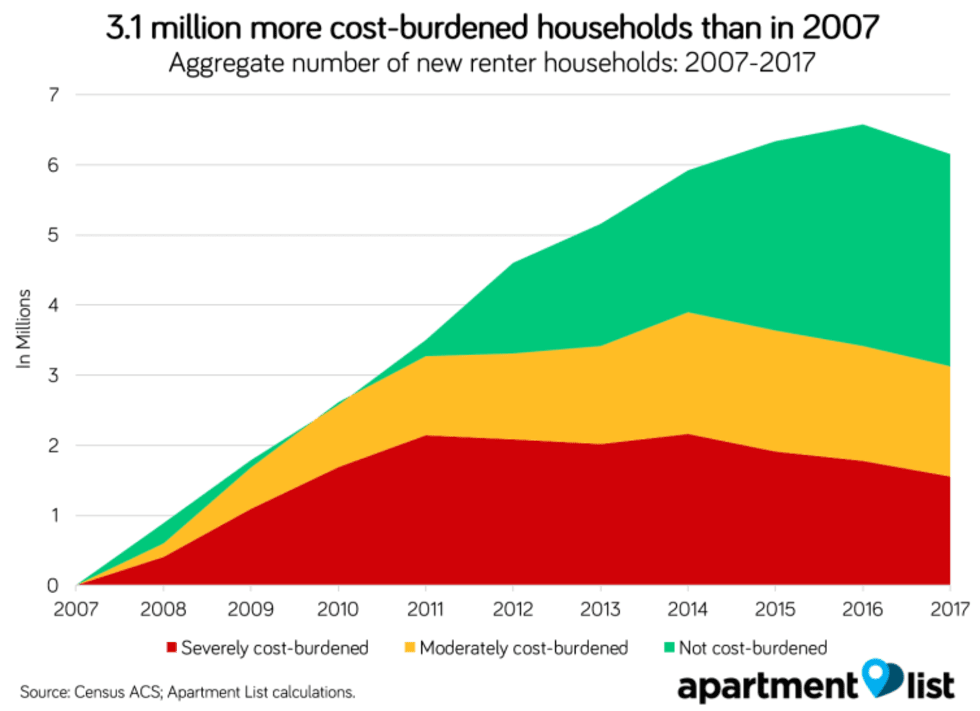
The cost burden rate fell by 1.6 percent from 2011 to 2014, but this improvement was driven by an influx of unburdened high-income renters. Over this same period, the number of rent-burdened households actually increased by 634,000. The number of cost-burdened households reached an all-time high in 2014, even though the cost burden rate was improving.
Luckily, the number of rent-burdened households has started to fall and is currently lower than the 2014 peak by 774,000 households. Importantly, 2017 was the first year since 2010 that the number of unburdened renter households decreased, indicating that this year’s improvement in the cost burden rate reflects genuine improvement rather than compositional change. That said, the total number of rent-burdened households remains higher than the 2007 level by 3.1 million households.
Signs of improvement can also be seen when we compare growth in the median renter income to growth in the median rent. The chart below shows that the median renter income grew faster than the median rent for the sixth straight year.
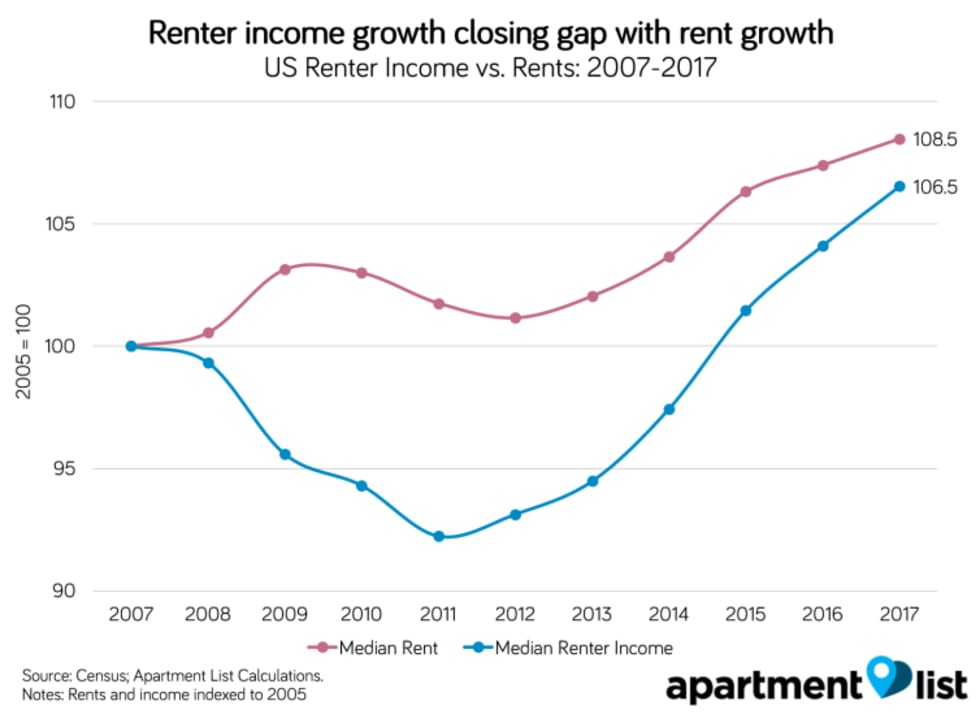
While the gap between income growth and rent growth is closing, it is important to note that these figures are subject to the same compositional effects described above. The number of renter households earning more than $100,000 per year more than doubled from 2.4 million in 2007 to 5.6 million in 2017; just 3.6 percent of these households were cost-burdened in 2017. Over the same period, the number of renter households earning less than $35,000 actually fell slightly from 20.5 million to 19.7 million, but the share of these households who are cost-burdened increased from an already staggering 76.6 percent in 2007 to 83.2 percent in 2017.
Miami has the highest cost burden rate, and the median renter is cost-burdened in 20 of the 25 largest metros
The map below shows the new 2017 cost burden data for more than 500 metropolitan areas across the country. The markers for each metro are shaded base on the local cost burden rate, with darker shades corresponding to higher rates, while the size of the markers corresponds to the total number of cost-burdened households in the metro.
Cost burden rates tend to be highest in coastal areas with high housing costs. Miami has a cost burden rate of 62.7 percent, the highest of the nation’s 100 largest metros,2 followed by Riverside, CA at 58.5 percent. At the state level, Florida has the highest cost burden rate at 56.4 percent. Nearly one in three cost-burdened renters (30.8 percent) lives in California, New York or Florida. While these are also some of the nation’s most populous states, they make up a notably larger share of the cost-burdened renter population than of the overall population. Note that there are some exceptions to this trend; the San Francisco metro has the nation’s highest median rent, but also some of the best job opportunities, resulting in a cost burden rate that is below the national average.
Another way of thinking about cost burdens is to consider whether a renter household earning the median income would be able to afford the median rent without spending more than 30 percent of their income. We found that in 20 of the 25 largest metros, a household earning the median renter income would be cost-burdened by the median rent. Of the 100 largest metros, the median renter would be burdened in 66 metros.
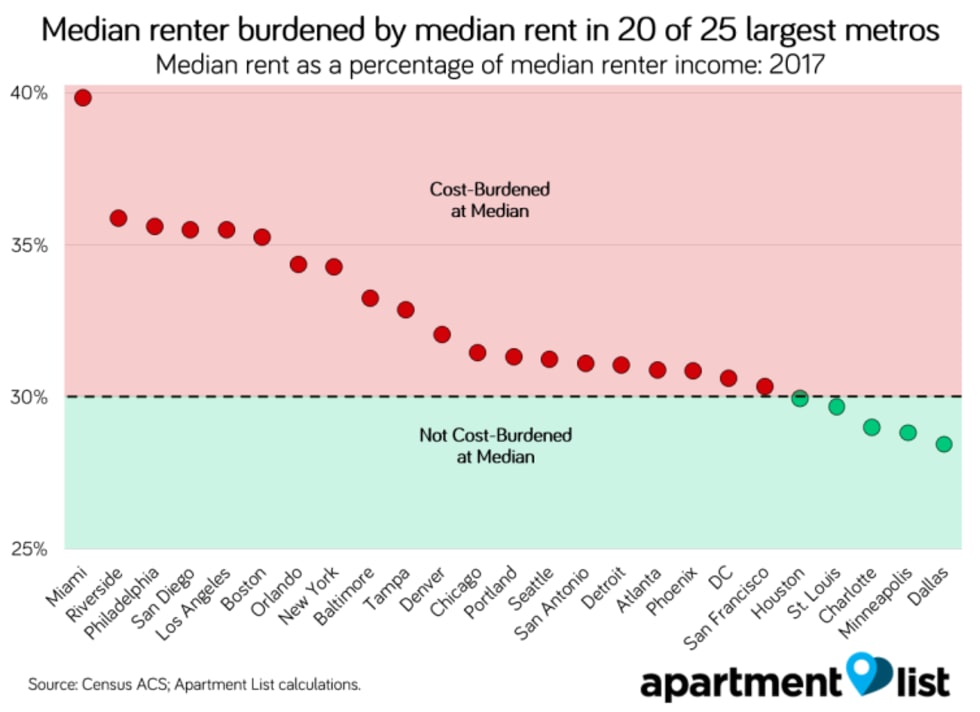
Miami and Riverside rank as having the nation’s most burdened renters using this metric as well. There are only five metros -- Dallas, Minneapolis, Charlotte, St. Louis and Houston -- where the median renter can comfortably afford the median rent. Framing the problem in this way highlights the fact that rental housing affordability affects not just low-income households, but also millions in the middle-class.
Finally, we dug into the dynamics of how rent growth and income growth have interacted to drive changes in cost burden rates over the past ten years. In the chart below, markers shaded red indicate metros where the cost burden rate has increased, while those shaded green saw their cost burden rates fall. Markers are sized according to overall metro population.
In metros that fall above the diagonal line, the median renter income grew faster than the median rent from 2007 to 2017, while in those that fall below the diagonal, the opposite is true. Note that in most metros above the diagonal, cost burden rates increased, while rates decreased in all of those below the diagonal.
For example, in Denver, which has experienced rapid economic growth in recent years, median renter incomes grew by 31.0 percent from 2007 to 2017. However, rents grew even faster at 42.6 percent, leading to a 3.2 percent increase in the share of renter households who are cost-burdened. Meanwhile, Raleigh saw the median renter income grow by 19.4 percent while the median rent grew at a more modest 14.6 percent, resulting in a 2.5 percent decline in the metro’s cost burden rate.
This relationship demonstrates that when income growth outpaces rent growth, cost burden rates will tend to fall. The cost burden rate has fallen over the past ten years in 54 of the 100 largest metros, but here again, compositional effects may be painting a picture that is more positive than the reality.
Conclusion
A lack of affordable housing in areas of economic opportunity remains one of our nation's most pressing issues. Households that struggle to pay rent often cut back spending on other basic necessities and may ultimately face eviction, which can result in adverse and long-lasting consequences. Our analysis shows that although the national cost burden rate has been falling since 2011, much of the improvement is driven by an increase in the number of high-income renters. There are currently millions more rent-burdened households than there were in 2007.
While the data do show some genuine improvement since 2014, we have a long way to go ensure that all Americans can comfortably afford to put a roof over their heads. Hopefully, increased awareness of this issue will result in concrete action aimed at reducing housing costs and spreading prosperity in more inclusive and equitable ways.
Download Complete National and Local Data
- Moderately burdened households are those that spend 30 percent to 50 percent of household income on rent, while severely burdened households are those that spend more than 50 percent of household income on rent.↩
- In response to the lack of opportunity for many low-income households in Miami, local elected officials have initiated a broad revitalization campaign in the city’s Liberty City neighborhood.↩
Share this Article
