$1,140
111 Belle Street, Columbus, OH 43215(380) 333-9602Rent Savings
- 21 units available
- Studio • 1 bed • 2 bed
- Amenities
In unit laundry, Nest technology, Patio / balcony, Dishwasher, Pet friendly, New construction + more
Verified listing
Verified

Note: Discover the most recent update of our report by visiting 'Best Cities for Black Professionals in 2024.'
It’s Black History Month!
In observation of this holiday, we partnered with Apartment List’s Black ERG, "Black@A-List", to create this report and uncover the best cities for Black professionals.
We understand that the Black community is diverse and includes many beliefs, interests, and cultures, so read our methodology below to understand how we determined our top cities.
We based the methodology in this report on what our Black@A-List colleagues believe would be relevant to great city for Black professionals - members of the African Diaspora who graduated from college and are part of the workforce. With that audience in mind, the urban features that we measured fell into four broad categories: Community & Representation, Economic Opportunity, Housing Opportunity, and Business Environment.


These four scores, and the individual statistics that comprise them, are weighted and summed to arrive at a final composite score between 0-10. Lower scores indicate a combination of less Black representation, worse economic outcomes for black households, and greater economic gaps between black and non-Black individuals. We acknowledge that this ranking will capture some, but not all of the socio-economic inequalities that exist between races and locations throughout the United States. For a more detailed look at the numbers behind the rankings, see the data section below.
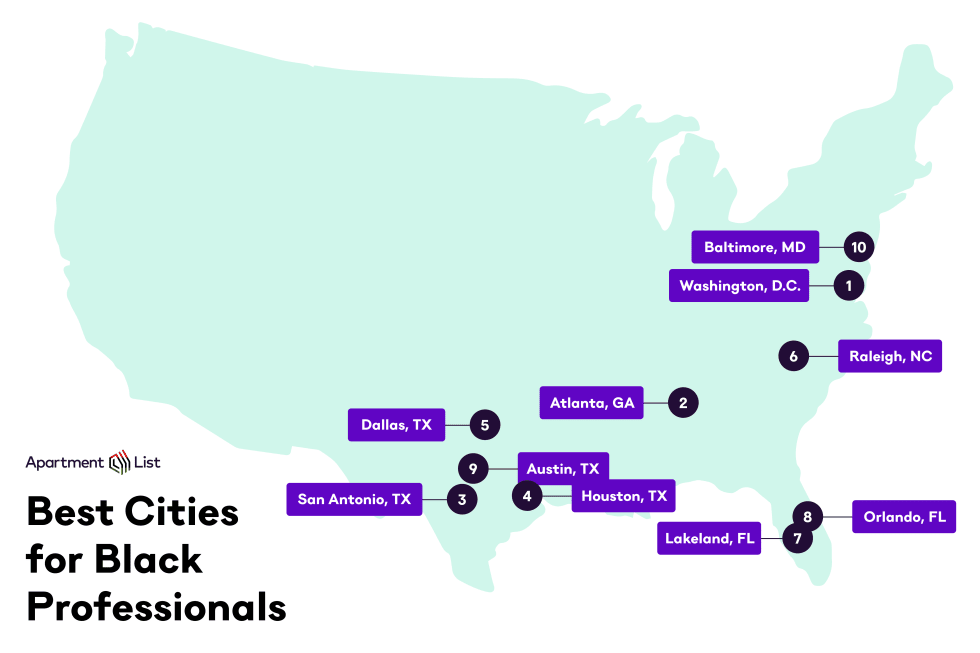
We analyzed 80+ cities to determine the Best Cities for Black Professionals:

Coming in first place is Washington, DC! With a final score of 72.4, DC is the best city for Black professionals. It ranks well on all scores, including a top #1 position for economic opportunity, #3 for housing opportunity, and #4 for business environment. DC’s lowest ranking is for its community & representation, which ranks #28.
Home to two Historically Black Colleges and Universities (HBCUs), Howard University and the University of District Columbia, it’s no surprise that over one-third of the region’s Black population has a college degree, well above average. Combined with a strong job market, the median income among DC’s Black population is higher than anywhere else in the country. Yet inequalities persist, and Black incomes in DC remain 21% lower than non-Black ones.
23.4% of businesses in DC are Black-owned. You can pick up a new novel at MahoganyBooks, grab some fresh flowers at Lee’s Flower Shop, or get in a hard workout at Cut Seven! Black businesses are somewhat underrepresented – 28% of residents are Black – but the gap is similar to other major cities with large Black populations, like Atlanta and Chicago.
Homeownership is a major contributor to racial wealth disparities in the United States. Nationally, the Black homeownership rate trails all other racial groups and is over 30 percentage points lower than white non-Hispanics. In DC, just over half of Black households own their homes - one of only seven cities in our analysis to reach this mark. This, combined with relatively high incomes, means Black DC households have a lower cost-burden rate than most other cities: 40% spend more than 30% of incomes on housing, compared to 55% in Los Angeles and 50% in New York.

Atlanta, GA is awarded second place for the best cities for Black professionals with a final score of 69.22! Atlanta ranks well for most factors, such as #1 for community & representation, #14 for housing opportunity, #7 for economic opportunity, and #2 for it’s business environment.
Atlanta is known for its Atlanta University Center, which is the consortium of four HBCUs: Clark Atlanta University, Morehouse College, Morehouse School of Medicine, and Spelman College. This density of HBCUs may explain why Atlanta is home to a large Black community (36% of all residents) with a high college graduation rate (28%) and a high employment rate (93%). The median income for these professionals is lower than in Washington DC but more closely aligned with non-Black incomes in the area.
Atlanta boasts both a large and growing Black population. In 2019, 35.7% of the region’s population was Black, up from 31.9% in 2010. The population is growing faster here than any other city in our analysis, signaling an increasingly strong business climate. Black-owned businesses are quite common in Atlanta at a 31.6% share. Catch a southern meal at the Atlanta Breakfast Club, go skating at Cascade Skating, or pick up some tea at Just Add Honey Tea Company.
Lastly, 46.8% of the Black population in Atlanta are homeowners. Similar to DC, the cost burden is lower than average at 40.9%.
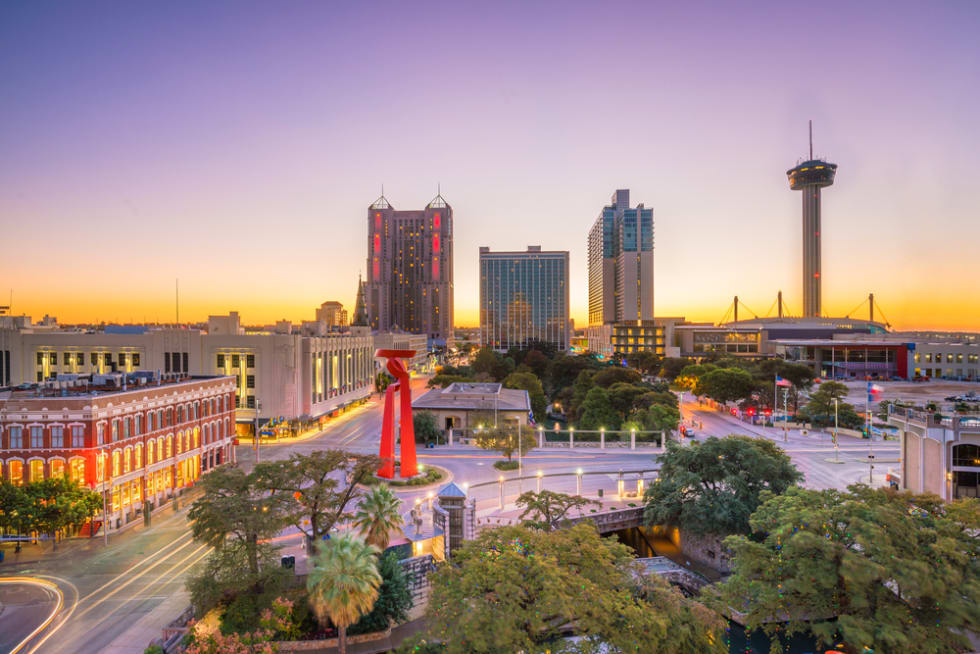
Moving to the Lone Star State, there are three Texas cities that rank in our Top 5. San Antonio comes first, with a final score of 66.08 and a Top 10 ranking in economic opportunity (#3) and housing opportunity (#7), despite lower ranks for community & representation (#14) and business environment (#14).
Compared to other cities, San Antonio’s Black population is rather small at 8.1% of all residents, almost half the average. However, the local Black employment rate is relatively high (93.9%) as is the Black median income. Black incomes are 5% lower than the rest of the population, much closer than in other cities on our list, even DC and Atlanta which received stronger overall scores.
On the other hand, the share of Black graduates is high at 26.8%. Texas has the second most HBCUs, after Alabama. While it’s an HBCU mecca, there’s only one university in San Antonio. This may or may not explain why the share of professionals is lower compared to our other top two.
Despite this, there’s no lack of Black-owned businesses to support in San Antonio. Start your day off by taking a boxing class at Black Stallion Boxing Plus. Then eat some lunch at Jamaica Jamaica Cuisine. Lastly, spend the remainder of the day shopping at Gold Diamonds.
While the Black homeownership rate is higher than average at 43.7%, the homeownership gap (Black homeownership rate - non-Black homeownership rate) is 10% lower than average at -19.4%. Perhaps this could be explained by San Antonio’s overall homeownership rate which is almost 10% lower than the state’s average. Additionally, the lower homeownership gap could explain the cost burden rate also being lower than average at 38.9%.

Staying in Texas, we arrive in Houston, our 4th best city for Black professionals. With a final score of 63.78, Houston boasts a strong business environment score (#3 in the nation), community and representation score (#4), and economic opportunity score (#7). But higher housing costs hurt Houston’s housing opportunity score, which ranks #20. 42% of black households in Houston spend more than 30% of this income on housing expenses.
Although Houston ranks lower overall, it does have a larger Black population than nearby San Antonio. 18% of Houstinites are Black, and the community is well-represented in some critical occupations: 21% of teachers are Black, as are 20% of doctors. Houston is also home to the HBCU Texas Southern University, helping a job market when the median Black income is several thousand dollars above average.
Similarly, 17% of local businesses are Black-owned, more than any other part of Texas. From the Mitochondria Gallery to Ten Skyncare and Wisdom’s Vegan Bakery, Houston has it all!

Rounding out our Top 5 is Dallas. Within Texas, Dallas trails Houston and San Antonio in many of the community and economic factors that we measure, but still ranks extremely well compared to other parts of the country. Dallas is home to Texas’s fastest-growing Black community: in 2010, 14% of the population was Black, today that share has risen to over 17%.
Like Houston, Dallas’s Black community is fairly well-represented. 14.5% of businesses are Black-owned. Start your day off at Brunchaholics, then get your hair done at Pressed Roots, and end the day with a workout at BURN. Black incomes in Dallas are comparable to other southern cities like Austin, Atlanta, and Raleigh.
Housing burden and inequity factors that holds back Dallas’s overall score, compared to the other cities on this list. The Black homeownership rate is only 36%, over 27% points lower than non-Black households. And because of high housing costs, nearly 44% of Black households are cost-burdened, comparable to Austin.
Use the table below to compare the cities and their respective scores. Below the Rankings table you will find more granular information about the data and how our scores were calculated.
| Ranking | City | Final Score |
|---|---|---|
| 1 | Washington, DC | 72.4 |
| 2 | Atlanta, GA | 69.2 |
| 3 | San Antonio, TX | 66.1 |
| 4 | Houston, TX | 63.8 |
| 5 | Dallas, TX | 60.6 |
| 6 | Raleigh, NC | 58.8 |
| 7 | Lakeland, FL | 58.1 |
| 8 | Orlando, FL | 57.5 |
| 9 | Austin, TX | 57.1 |
| 9 | Baltimore, MD | 57.1 |
| Ranking | City | Community & Representation | Economic Opportunity | Housing Opportunity | Business Environment |
|---|---|---|---|---|---|
| 1 | Washington, DC | 28 | 1 | 3 | 4 |
| 2 | Atlanta, GA | 1 | 7 | 14 | 2 |
| 3 | San Antonio, TX | 14 | 3 | 7 | 14 |
| 4 | Houston, TX | 4 | 7 | 20 | 3 |
| 5 | Dallas, TX | 5 | 4 | 34 | 7 |
| 6 | Raleigh, NC | 21 | 15 | 5 | 50 |
| 7 | Lakeland, FL | 3 | 54 | 10 | 4 |
| 8 | Orlando, FL | 7 | 21 | 18 | 9 |
| 9 | Austin, TX | 46 | 5 | 26 | 27 |
| 9 | Baltimore, MD | 25 | 10 | 18 | 45 |
A total of 82 locations were included in this analysis. For individual factors (e.g., employment rate, median income), weights, and data sources, please view the complete data.
Each factor was converted into a normalized score from 0 to 100 according to the distribution of values across locations. Normalized scores were then weighted and summed to give every location a final composite score between 0 and 100. A score of 100 would mean a location ranked first in every individual factor in the analysis.
 We wrote this report in collaboration with the Apartment List Black ERG, also known as, "Black@A-List". Pictured above are a few of those employees who helped us with this report!
Employee Resource Groups (ERGs) at Apartment List are meant to serve as a safe space for Apartment List employees. They meet frequently to chat about their shared experiences, plan company-wide events, and form allyship across the company. Apartment List has 5 different ERGs that each represent a different identity group: Black, Asian, Latinx, Women, and LGBTQ+.

In unit laundry, Nest technology, Patio / balcony, Dishwasher, Pet friendly, New construction + more
In unit laundry, Patio / balcony, Pet friendly, Stainless steel, Walk in closets, Gym + more