San Francisco’s Rental Market Is Booming Again [2026 Update]
Key Findings
- Rapid rent increases are sweeping across the San Francisco Bay Area, as high demand driven by the growth of the AI industry collides with a supply-constrained housing market.
- In San Francisco proper, the apartment vacancy rate has fallen to just 2% in August 2026, while rents have risen 26% in the past 12 years. This leads the nation and represents the fastest post-pandemic rent growth captured by our model.
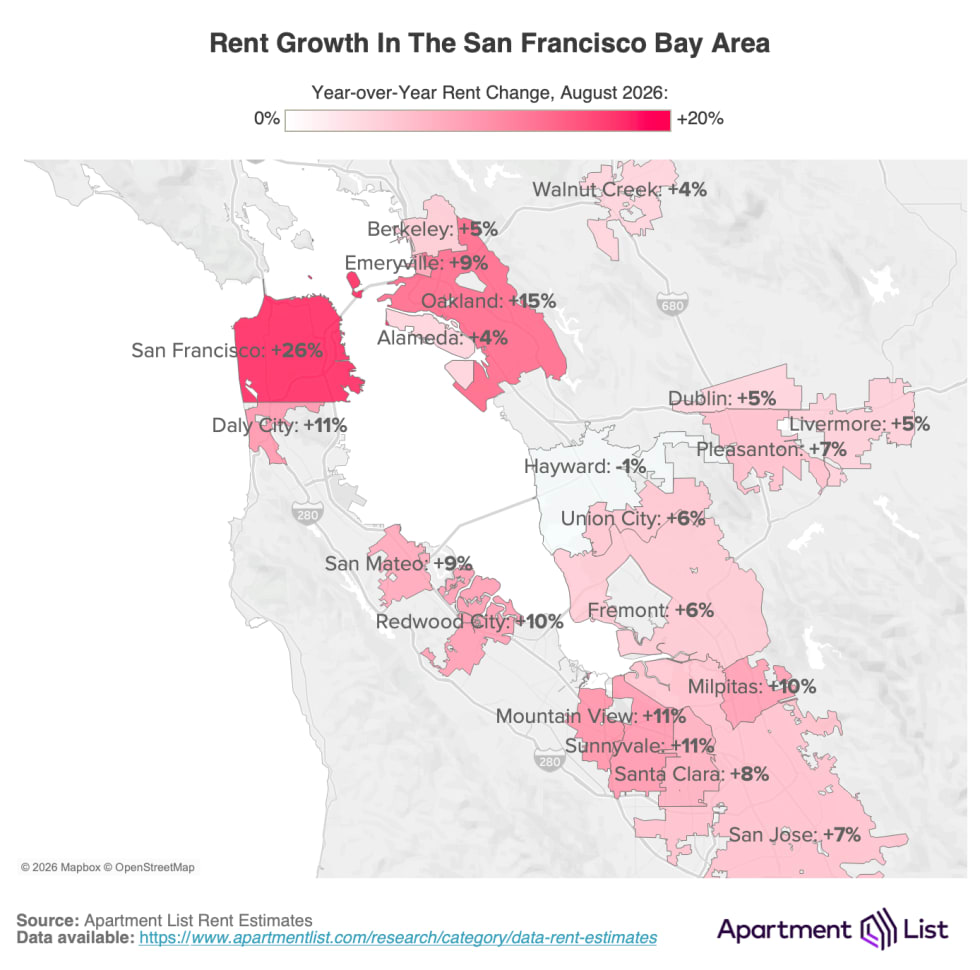
- Elsewhere in the Bay Area, rent increases have been more modest (+15% in Oakland, +11% in Mountain View, +7% in San Jose). But there is a clear spillover effect taking place whereby the red-hot market in San Francisco is cascading outward to the East Bay and Peninsula.
- One major factor is the Bay Area’s sluggish construction pipeline. While many other cities built record numbers of apartments over the past 5 years, development in San Francisco has dwindled, providing little inventory to absorb inbound housing demand.
San Francisco’s recovery was slow, until it wasn’t
Perhaps no rental market in America was hit harder by the COVID pandemic than San Francisco. By the end of 2020, as a tech-driven economy quickly embraced remote work and out-migration hollowed some of the city’s densest downtown neighborhoods, rents had fallen more than 25%. The city’s visible struggles led many to wonder if, much less when, San Francisco would be able to recover.
Well the answer to “if” is (resoundingly) yes, and the answer to “when” began in 2024, when San Francisco found itself once again at the center of technological revolution. As the AI industry has exploded, investor money has poured in and office buildings have filled. The rental market is experiencing a surge of high-wage newcomers, with few options to house them. As of August 2026, year-over-year rent growth has hit a new peak of 26% – faster than anywhere else in the country – and there is little to suggest the trend will slow any time soon.
Apartment List builds and monitors several rental market datasets. What follows is a quick summary of the data in San Francisco: where things stand today, how we got here, and where we’re going.
In San Francisco, rents have jumped 26% in a single year
The location of innovation is playing a big role in today’s rental market. The Bay Area’s previous tech boom – led by tech giants like Facebook, Apple, and Google – was largely concentrated in the sprawling, suburban office parks of Silicon Valley. There was an implicit tradeoff to working on the Peninsula but living dozens of miles to the north in San Francisco. Corporate commuter buses became the symbol of this chapter in Bay Area history, as they shuttled workers to and from SF. The housing market was put under pressure, but that pressure was relatively distributed across the region.
But this time, San Francisco finds itself the epicenter. Many of the newest, biggest names in tech – Anthropic, OpenAI, Cursor – are headquartered in the very same neighborhoods that were struggling with occupancy just a few years prior. Living in San Francisco now gives direct access to the leading jobs in tech, no commuter shuttle required. As such, rents in the city are up 26% between July 2025 and July 2026. Price increases cascade east and south from there, with rent growth reaching +15% in Oakland, +11% in Mountain View, +7% in San Jose, and reaching double-digits in several other cities across the Peninsula and South Bay.
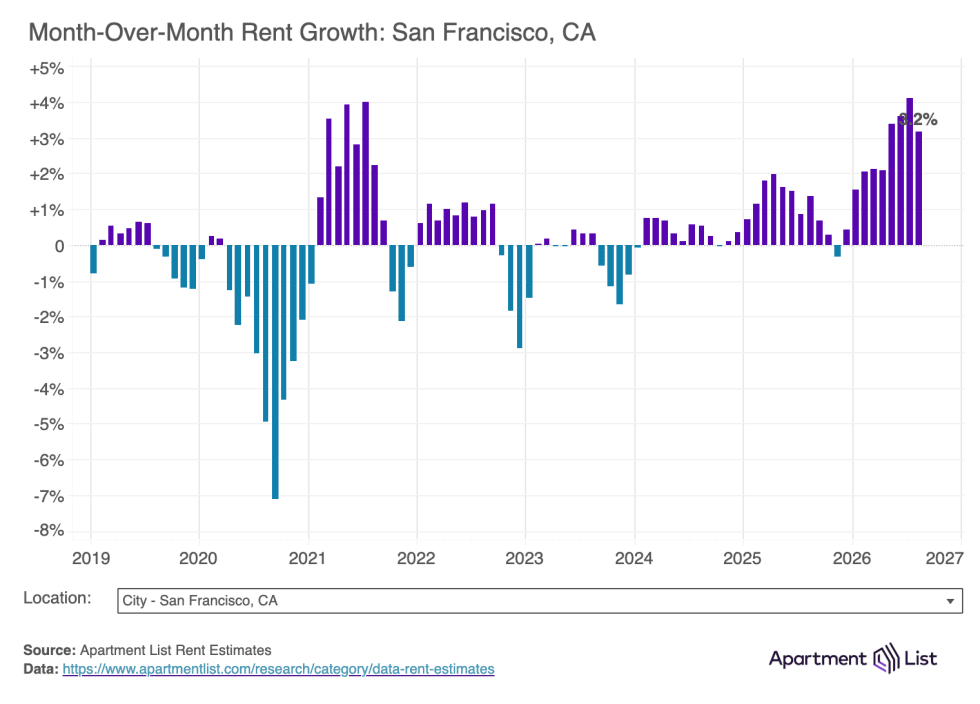
San Francisco rents jumped 3% in August alone
San Francisco has logged the nation’s fastest rent increase in every month of 2026. In August alone, rents shot up 3.2%; that’s more rent growth in a single month than most cities have registered in the past year. Throughout the year, the three cities logging the fastest monthly rent increases in the country are, unsurprisingly, San Francisco, Oakland, and San Jose.
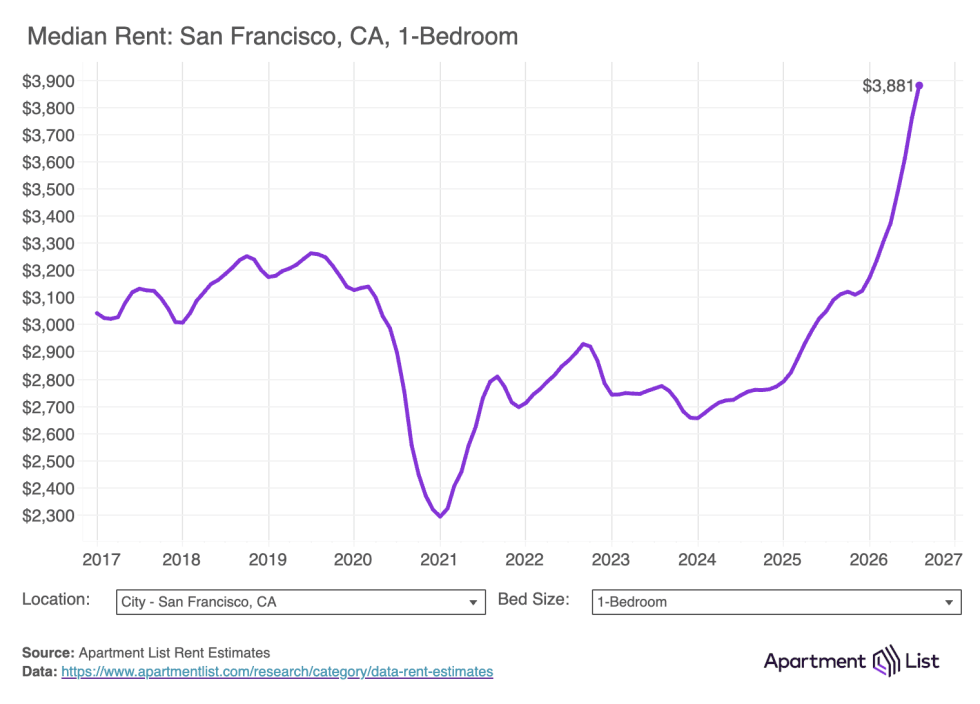
San Francisco has the most-expensive one-bedroom apartments in the country
Our model estimates that in August 2026, the median rent paid for a one-bedroom apartment in San Francisco is $3,881, an increase of over $1,200 per month over the last 2.5 years. San Francisco ranks most-expensive in the nation, followed immediately by six other Bay Area cities: San Mateo, Sunnyvale, Redwood City, Mountain View, and Santa Clara.
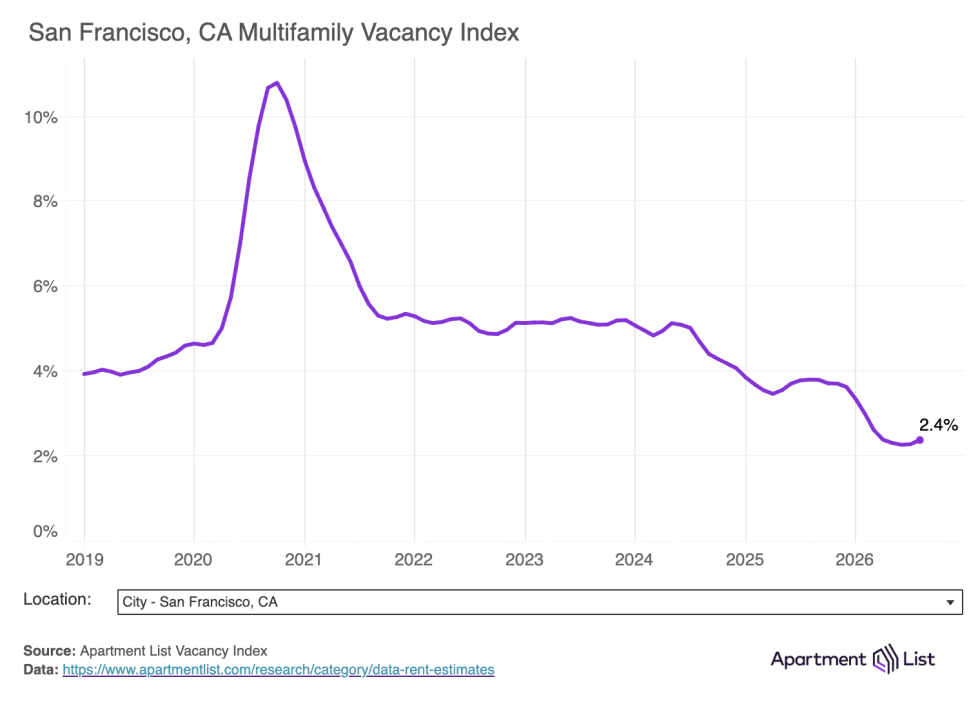
San Francisco’s apartment vacancy rate is just 2.4%
If we examine San Francisco’s rent boom through the lens of supply and demand, the demand effect is clear: as the AI industry grows, new renters are drawn to the Bay Area with high-paying jobs and large housing budgets, and they out-compete others whose spending power has not kept pace. An abundant supply of apartments would help absorb this new housing demand and keep prices in check. But the reality is in San Francisco it’s much easier to attract a new renter than it is to build a new apartment.
So in the past few years, a historically tight housing market has grown even tighter. San Francisco’s apartment vacancy rate has been more than cut in half, from 5.1% in 2024 to 2.4% by mid-2026. Rent growth during that period has skyrocketed from -3% to +26%. Property managers who find themselves with increasingly-scarce vacant apartments are pushing rent increases to the extreme.
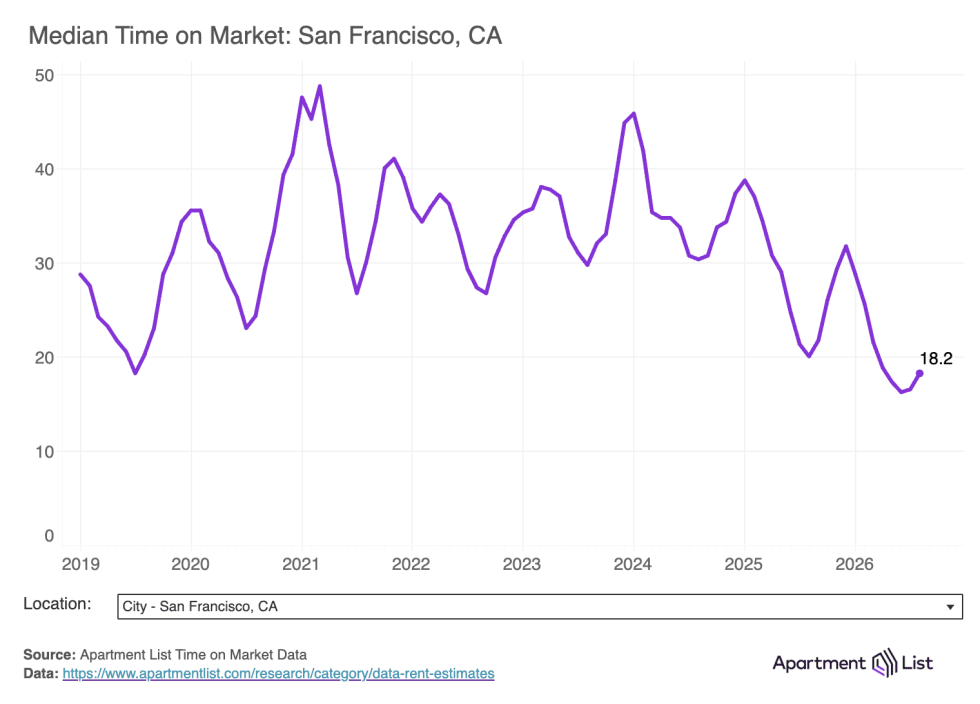
As a result of this high-demand, low-supply environment, vacant units are turning over quickly. We track “list-to-lease” time, which is the number of days between when a vacant apartment is listed for rent, and when it is actually rented. Nationwide, the typical list-to-lease time is 30 days; in San Francisco, apartments are turning around in just 18 days – the fastest August reading since we started tracking in 2019.
Apartments are scarce because when many other cities built, San Francisco did not
In some respects, San Francisco’s rent boom should come as no surprise. The extremes to which the AI industry would spark wealth and housing demand may have been difficult to foresee, but San Francisco’s supply crunch was anything but. Starting in 2021, many cities across the country – led by the major Sun Belt markets such as Austin and Phoenix – were transformed by an apartment building frenzy. At that time, rent prices were soaring while interest rates were at historic lows, so money poured into multifamily construction, what seemed at the time to be a sure-fire, profitable investment. In just three years, more than 1.5 million new apartments were built nationwide.
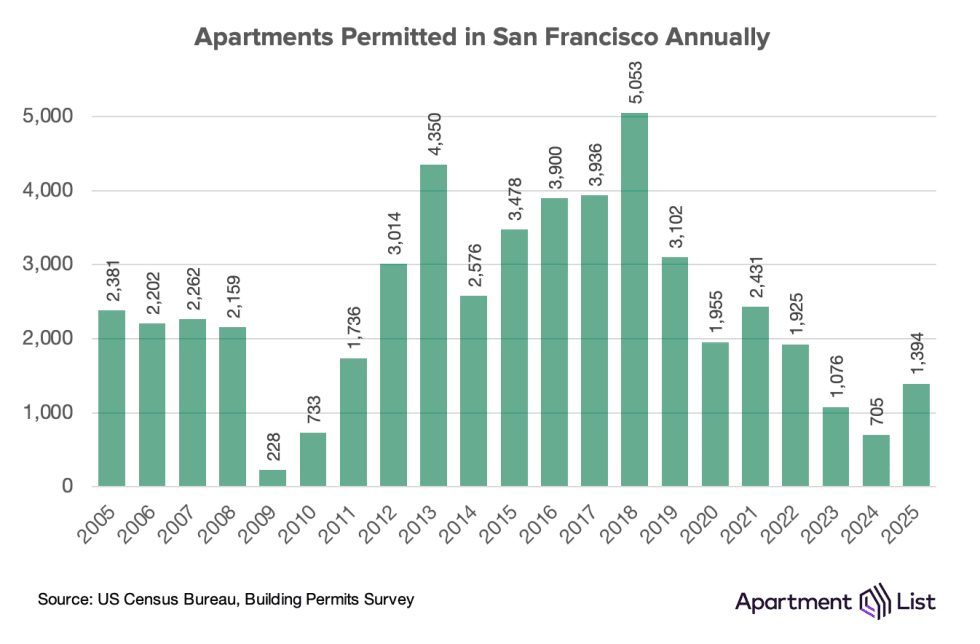
But San Francisco did not participate in this supply wave. In fact, permits for new apartments in the city – not all of which get built – declined through this whole period, reaching a low of just 705 apartments in 2024. 2025 saw a modest increase to nearly 1,400 units, but on a per-capita basis this is still fewer than 2 new apartments for every 1,000 San Francisco residents. To put that in perspective, supply-friendly cities like Austin, TX were permitting more than 15 new apartments per 1,000 residents during the post-pandemic construction boom.
Where will the San Francisco rental market go from here?
The relationship between supply growth and rent growth is clear: the markets that permit fewer apartments today see faster rent increases tomorrow. With so little in the construction pipeline, and barring some economic disaster that saps the city of housing demand, the trajectory that San Francisco is on right now will continue for the foreseeable future. On the supply side, there are a few reasons to be mildly optimistic. Today’s rent increases will drum up interest from developers to build more homes, who see revenue potential in the future growth of the city. Meanwhile, the new Family Zoning Plan has upzoned large swaths of the city for this future development to occur. But the reality is any major upswing in housing supply is years away, and may still be insufficient to meet regional housing needs. At today’s pace of change, rental affordability in San Francisco will get worse before it gets better.
San Francisco Bay Area Rental Market Data, August 2026
| City | Population | Median Rent (1br) | Median Rent (2br) | Rent Change (MoM) | Rent Change (YoY) |
|---|---|---|---|---|---|
| San Jose, CA | 1001176 | $2,725 | $3,234 | 0.7% | 6.5% |
| San Francisco, CA | 851036 | $3,881 | $4,599 | 3.2% | 25.6% |
| Oakland, CA | 437825 | $2,137 | $2,565 | 2.7% | 15.1% |
| Fremont, CA | 228795 | $2,467 | $2,989 | 0.5% | 5.7% |
| Hayward, CA | 160602 | $2,255 | $2,537 | -1.2% | -0.8% |
| Sunnyvale, CA | 154573 | $3,369 | $3,953 | 1.8% | 10.8% |
| Santa Clara, CA | 128058 | $3,215 | $3,684 | 1.1% | 8.3% |
| Berkeley, CA | 121385 | $2,038 | $2,459 | 1.6% | 5.5% |
| San Mateo, CA | 104165 | $3,427 | $4,294 | 3.3% | 9.2% |
| Daly City, CA | 103648 | $2,861 | $3,522 | 3.0% | 10.8% |
Share this Article