The Increasing Importance of Multifamily Construction
Spending on multifamily construction totaled over $61 billion in 2017, which is nearly four times the amount spent in the post-recession trough of 2010. Multifamily makes up an increasingly large share of new construction spending. In 2017, multifamily housing made up 18 percent of all new residential construction spending, up from just 7 percent in 1993 when our data begins.
We estimate that from 2000 to 2016, spending on multifamily construction topped $10 billion each in 14 of the nation’s 25 largest metros, with spending in the New York metro alone totaling nearly $65 billion. This construction spending can be a boon to local economies.
When controlling for metro population, the fast-growing tech hubs of Seattle and Denver had the highest levels of per-capita spending on multifamily construction. Although housing markets in these areas have still struggled to keep pace with their booming job growth, this new supply has surely helped to temper rent growth.
The share of new residential spending going to multifamily construction has increased in all of the 25 largest metros, in some cases drastically. For example, in San Diego, multifamily housing accounted for 19.7 percent of spending on new residential construction in 2000, while that share had risen to 59.5 percent by 2016.
Introduction
Maintaining a healthy housing market is a matter of effectively balancing supply and demand, requiring a construction industry that builds enough new housing to keep pace with the demand created by economic, demographic and migration factors. Notably, residential construction is a sector of the economy that has lagged in recent years, with construction of new homes remaining at depressed levels in the face of increased costs for land, labor and materials.
New housing can be broken down into two groups: single family homes and multifamily properties that span the range from two-unit duplexes to large apartment complexes with hundreds of units. Although 69 percent of all households in the US live in single family homes1 multifamily properties have become increasingly important to our housing markets. In 1993, multifamily accounted for just 7 percent of new residential construction spending, but that share has increased by more than 2.5 times, to 18 percent in 2017. This increase is partially attributable to the nation’s growing share of renters. Between 2005 and 2016, 91 percent of all newly formed households were renters, and renters currently occupy 87 percent of the units in multifamily properties.2 Additionally, as more and more of the nation’s top jobs cluster in so-called “superstar cities,” there is increasing need for dense, transit-oriented development to keep these areas affordable and inclusive.
In order to better understand the trends in multifamily construction, Apartment List analyzed historic data on new residential construction at the national and local levels. This analysis uses national construction spending data made available by the Census Bureau. We obtained local estimates by apportioning national spending based on county-level building permit data3 also from the Census.4
Real spending on new multifamily construction up nearly 4x since 2010
Nationally, real spending on new multifamily construction showed a long-term upward trend prior to the collapse of the housing bubble, and it has rebounded strongly in the aftermath of the collapse, such that it is currently near its 2006 all-time high.
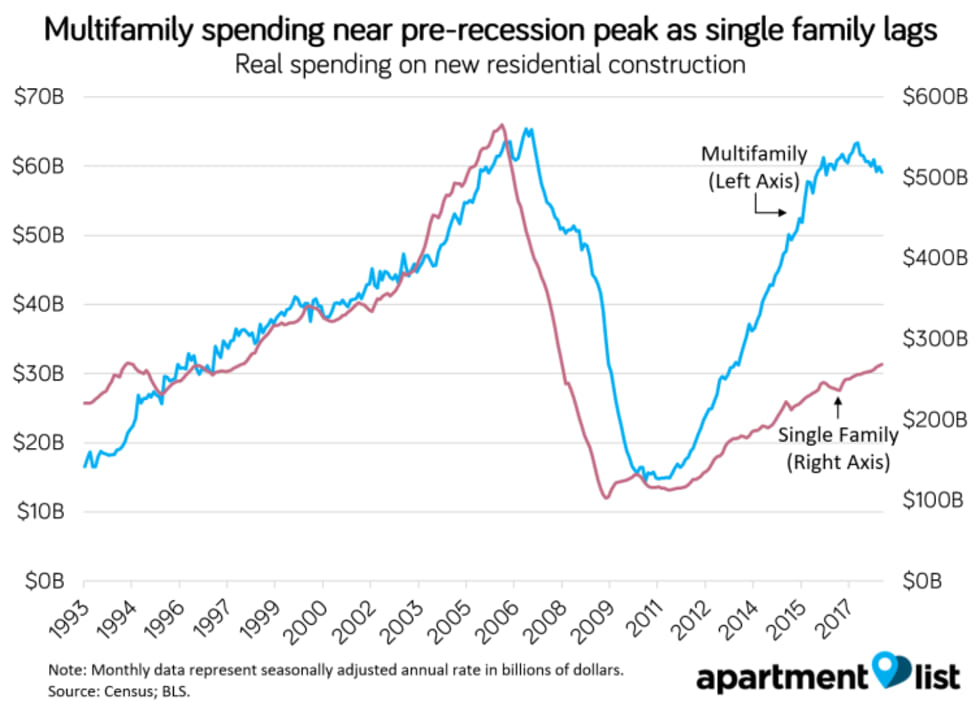
In 2017, annual spending on new multifamily construction totalled $62.6 billion; this amount is 3.8 times the amount spent in the post-recession trough of 2010, and it is just 2.6 percent shy of the pre-recession peak of 2006. In contrast, single family construction has failed to recover to the same extent, with real spending still at less than half its peak level.
In addition to increasing in absolute terms, multifamily construction has also been growing as a share of all new residential construction. In 1993, multifamily made up only 7 percent of new residential construction spending, but as of 2017, that share has increased to 18 percent. When we consider number of units rather than total spending, multifamily makes up a much larger share of new construction; 38 percent, as of 2016, up from 17 percent in 1993. This is because multifamily housing is significantly less expensive to build on the unit level, due to economies of scale and the fact that multifamily units tend to be smaller.
NYC has highest overall multifamily spending, but Seattle spends most per-capita
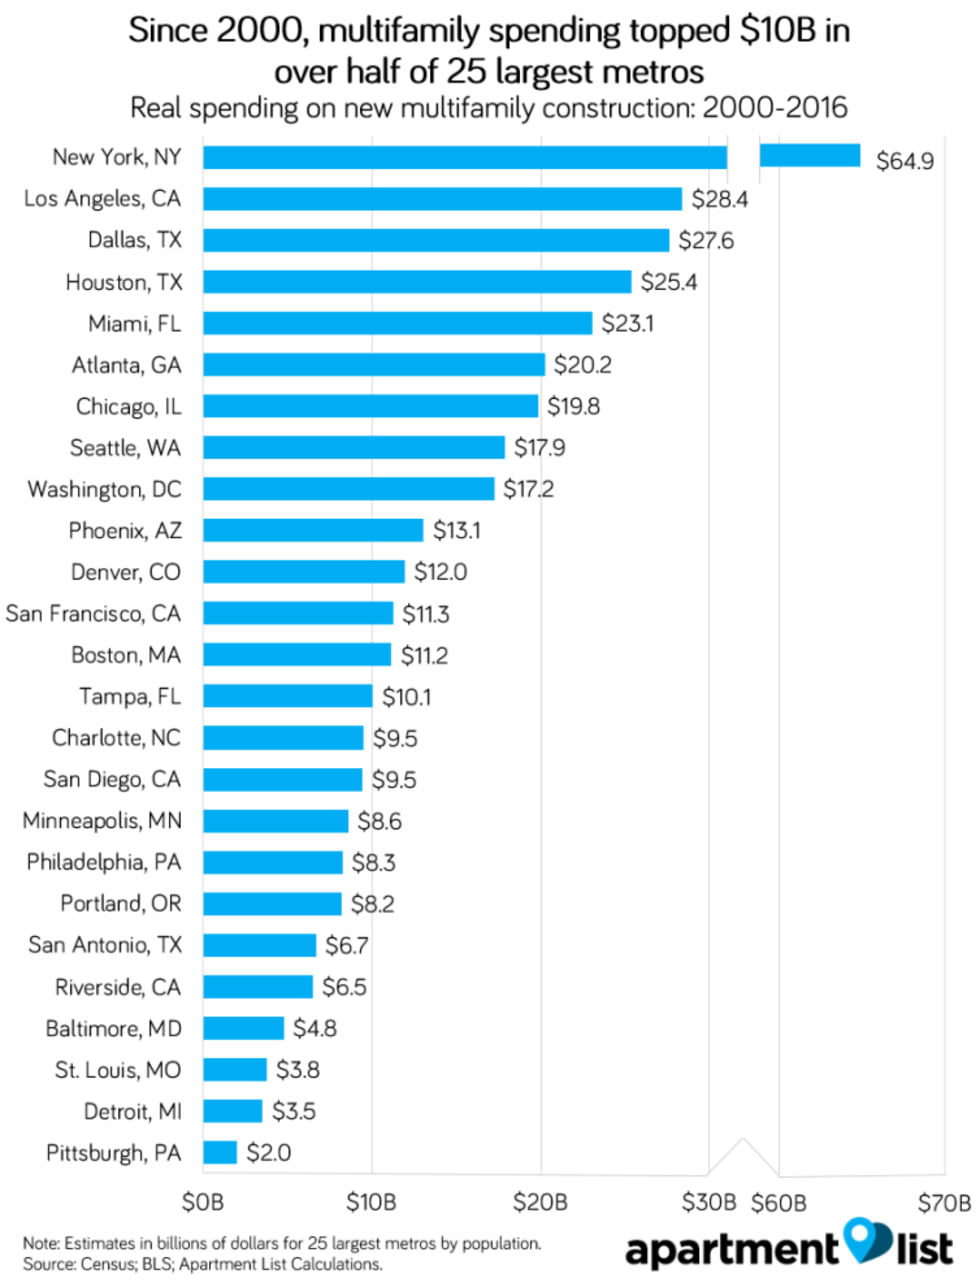
In order to understand how spending on multifamily construction is distributed across the country, we estimate spending at the metro level using building permit data to apportion overall spend. The following chart shows total spending on new multifamily construction since 2000 for the nation’s 25 largest metros.
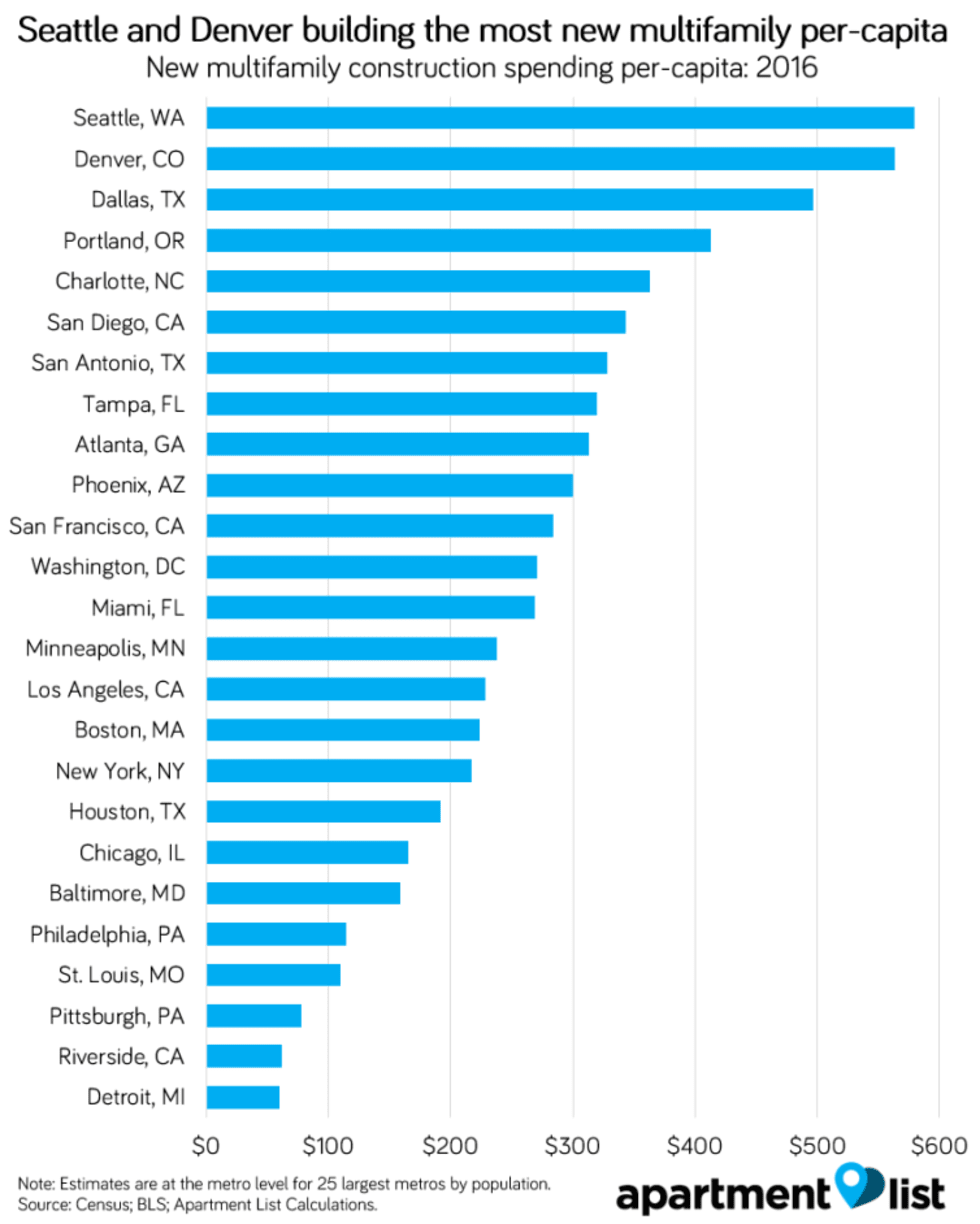
Since total spending is driven largely by metro size, we calculate a per-capita estimate to see which metros are spending the most on multifamily construction relative to their sizes. The following chart contains data for the nation’s 25 largest metros, based on 2016 spending levels.
Multifamily construction is important to local economies for two primary reasons. First, the addition of new units to the housing supply serves to meet the need for housing, which helps keep rent growth in check. In addition, the construction itself creates jobs and injects money which can be a boon for the local economy.
Some notable takeaways regarding multifamily spending at the local level:
The New York City metro has the highest level of multifamily spending by far -- from 2000-2016, spending in NYC totaled $64.9B, well over double the $28.4B spent in LA, the metro with the second highest level of MF spending.
From 2000-2016, spending on new multifamily construction has topped $10 billion in fourteen of the nation’s 25 largest metros.
On a per-capita basis, spending on new multifamily construction is highest in cities that have experienced rapid job growth, including Seattle, Denver, Dallas and Portland. Our data shows that since 2014, rent growth in Portland has actually lagged the national average, with rents actually declining in recent months as new supply comes onto the market. While the other three cities listed have had rent growth exceeding the national average, the addition of multifamily units has surely helped to temper rent growth.
Multifamily making up an increasing share of new residential spending in all of 25 largest metros
As discussed above, multifamily’s share of new residential construction spending has been increasing nationally. This is true at the local level for all of the nation’s 25 largest metros, to varying degrees:
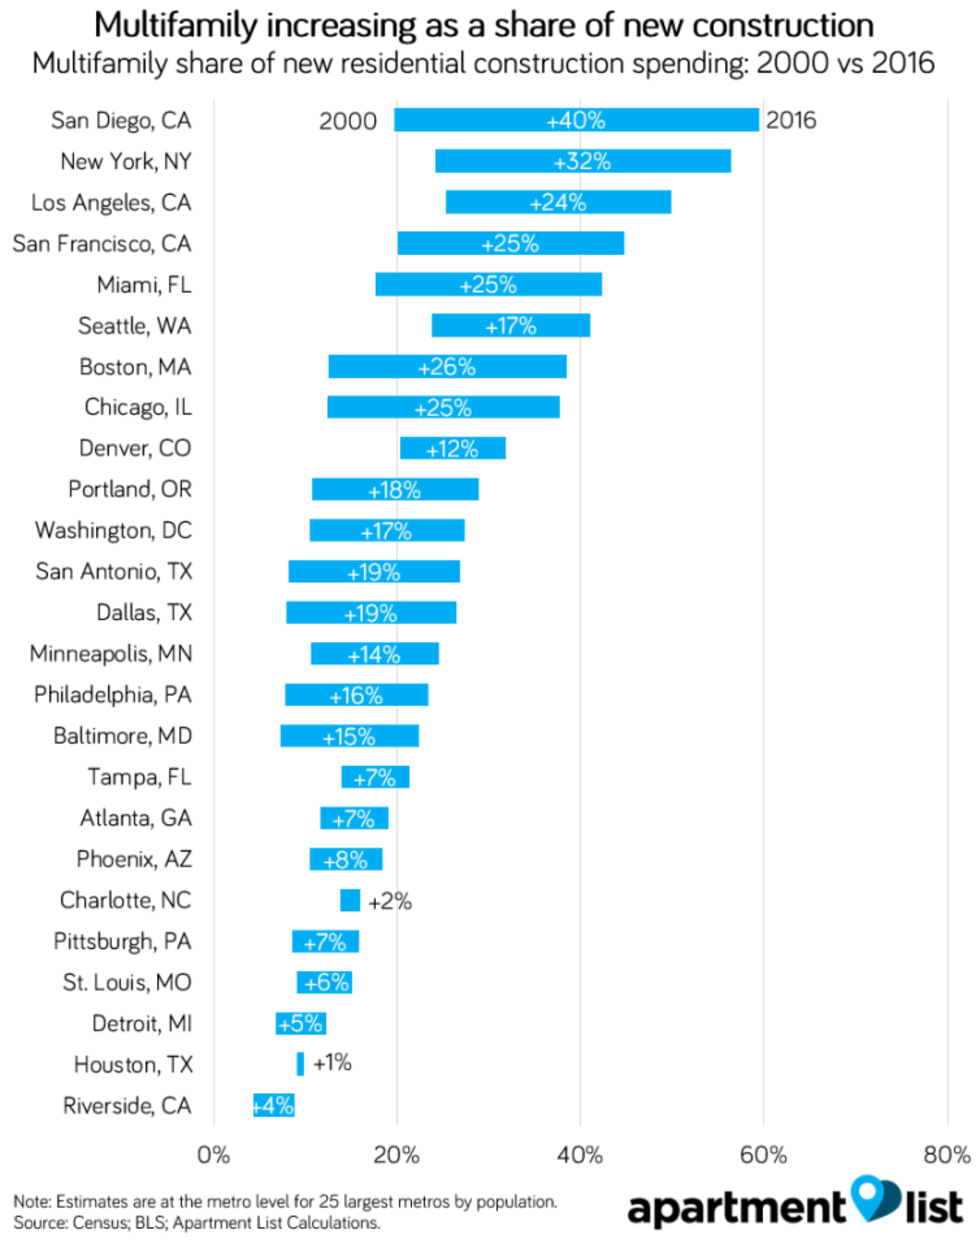
- In San Diego, multifamily made up 19.7 percent of new residential spending in 2000, but by 2016, that figure had risen to 59.5 percent. In the New York City metro, the share of spending going to multifamily rose from 24.1 percent to 56.4 percent.
- In 2000, Los Angeles had the largest share of new residential spending going to multifamily at 25.3 percent. In 2016, more than half of the 25 largest metros had multifamily shares above that level.
- The share of spending going to multifamily has increased most in metros where multifamily already comprised a large share of new construction. In contrast to the large increases seen in San Diego, New York and Los Angeles, the share of new residential spending going to multifamily increased by only 0.7 percent in Houston, which has historically built mainly single family homes.
Conclusion
As populations grow, new residential construction plays a crucial role in maintaining the affordability of housing. Our nation’s housing stock has historically been dominated by single family homes, but over time, multifamily housing has begun to make up an increasing share. As our economy has shifted toward knowledge work, there has been an increase in demand for housing in the metropolitan cores where these jobs tend to be located. From 2000-2010, population growth in urban areas outpaced the national average by 25 percent. This trend has slowed in the years since, but that change may be more the result of a lack of options rather than a lack of demand. As affordability becomes an increasing problem in many cities, households have been forced to extend their housing searches to the fringes of the metros in which they live, giving rise to an increase in “super commuters.”
New multifamily housing is well-positioned to address these problems. Adding new housing units close to the urban core can help soften rent growth, and dense transit-oriented construction can reduce commute times and promote sustainability. Furthermore, increasing the housing stock allows successful cities to grow, giving broader access to their opportunities. From 2005 to 2016, Seattle, Denver and Dallas -- the metros with the highest levels of per-capita multifamily spending -- saw their populations grow by 21 percent, 25 percent and 27 percent, respectively, while New York, Boston and San Francisco -- metros with similarly strong economies, but less new construction -- grew by 6 percent, 12 percent and 15 percent, respectively. Multifamily construction acts as a stimulus to local economies, and plays a crucial role in allowing our nation’s cities to grow in inclusive and sustainable ways.
Find data for the nation's 250 largest metros in the table below. For further questions or data requests, feel free to contact us at rentonomics@apartmentlist.com.
| Metro | Total Real MF Spend in Millions (2000-2016) | Per-Capita MF Spend (2016) | MF Share of New Residential Spend (2000) | MF Share of New Residential Spend (2016) |
|---|---|---|---|---|
| New York, NY | $64,880 | $220 | 24.2% | 56.4% |
| Los Angeles, CA | $28,400 | $230 | 25.4% | 49.8% |
| Chicago, IL | $19,840 | $170 | 12.4% | 37.8% |
| Dallas, TX | $27,610 | $500 | 7.9% | 26.5% |
| Houston, TX | $25,370 | $190 | 9.1% | 9.8% |
| Philadelphia, PA | $8,270 | $110 | 7.9% | 23.4% |
| Washington, DC | $17,240 | $270 | 10.4% | 27.4% |
| Miami, FL | $23,070 | $270 | 17.6% | 42.4% |
| Atlanta, GA | $20,240 | $310 | 11.6% | 19.0% |
| Boston, MA | $11,170 | $220 | 12.5% | 38.5% |
- Census ACS; FactFinder Table B25032.↩
- Census ACS; FactFinder Table B25032.↩
- Data aggregated and made available courtesy of BuildZoom.↩
- Note that this approach implicitly assumes a geographically constant cost-per-unit. This is a simplified assumption which likely introduces some error in the estimates.↩
Share this Article
