At Apartment List, we know that searching for a home is tough, and the decision can be even more complicated for families than it is for singles. Families look for different traits in the communities in which they choose to settle, and since they tend to have lower rates of mobility, the impact of their choices may be more enduring. For the past two years (2015 and 2016), we have dug into data on a number of pertinent factors to produce a family-friendliness index, and we’ve just updated the analysis with the most recent data. Read on to see the results!
Methodology
Our index is calculated based on a weighting of 4 factors that are of particular importance to families:
Safety (35%): We used FBI data to rank cities by the total number of violent crimes and property crimes per 100,000 residents. 1
Housing Affordability (30%): We used Census data on median gross rent as a percentage of household income as an indicator of housing affordability in each city. This measure takes into account not only how expensive rents are, but how well they are balanced with earnings. 2
Education Quality (25%): Comparing schools across different states can be challenging due to differing education requirements. We have chosen to use data on high school graduation rates, collected by the Department of Education, as a proxy for overall school quality. Cities were ranked by the graduation rates of their respective public school districts. 3
Child Friendliness (10%): Communities with a greater percentage of children tend to be more family friendly, so we used Census data to score cities based on the percentage of the population under age 18. 4
Our family-friendliness index is calculated using the factor weights listed above, and cities are ranked and graded based on that overall score. We’ve analyzed data for over 500 cities, and this is what we found:
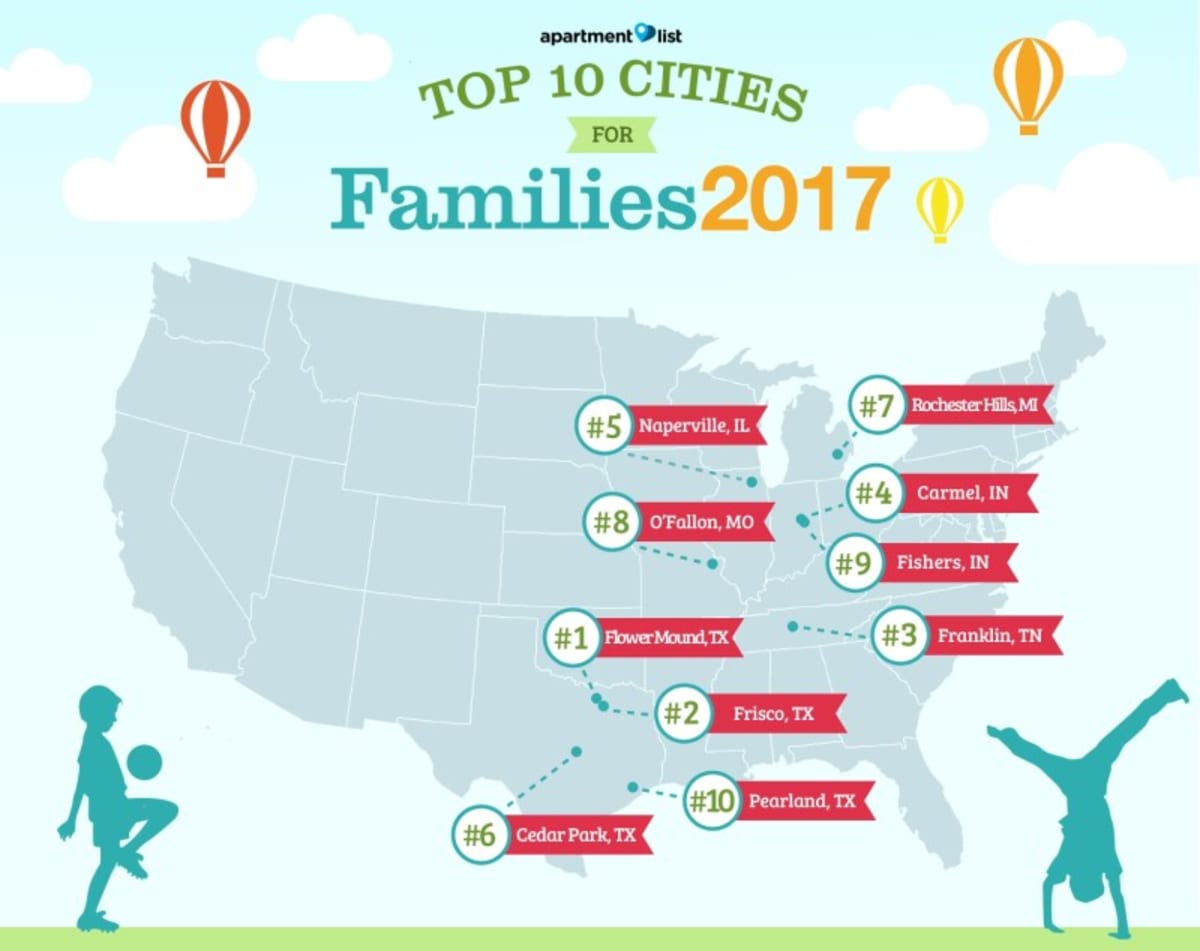
Flower Mound, TX takes #1; TX and Midwest suburbs dominate our Top 10
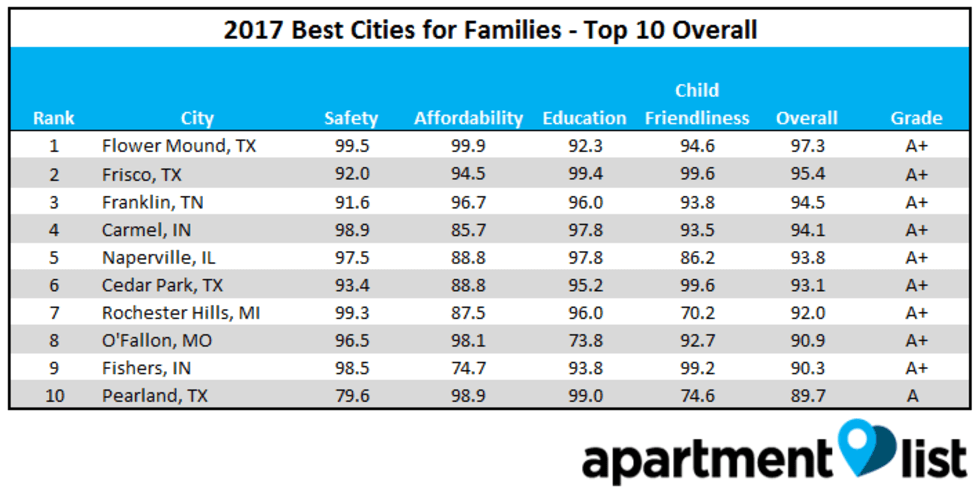
The top two cities in our rankings (Flower Mound and Frisco) are both part of the Dallas metro; two additional Texas cities (Cedar Park and Pearland) also made the top 10. The remainder of the top 10 is made up primarily of smaller Midwestern cities, including suburbs of Indianapolis, Chicago, Detroit, and St. Louis. The only top ranked city not located in Texas or the Midwest is Franklin, TN, which is located in the Nashville metro.
Among the nation’s 25 largest cities, El Paso, TX scored best, with an A- overall grade. Other large cities that performed relatively well include Dallas, San Diego, Phoenix, and Charlotte, which all received overall grades of B.
Thornton, CO ranks #1 for safety
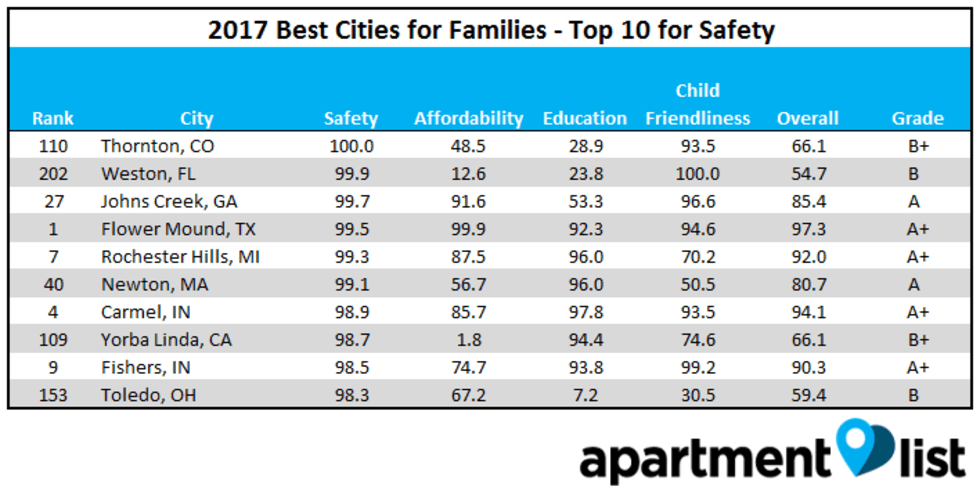
With only 244 violent and property crimes per 100,000 residents, the Denver suburb of Thornton tops our safety rankings, followed by the Miami suburb of Weston. Note that despite safety being the most highly weighted factor in our overall index, four of the ten safest cities do not crack the top 100 for overall rankings; this is due to the fact that many of the safest cities tend to be more expensive, and some have under-performing public schools.
On the other end of the spectrum, many large cities have substantially higher rates of crime. Memphis, San Francisco, Seattle, Indianapolis and Detroit all received F grades for safety.
Cities on the interior tend to be most affordable
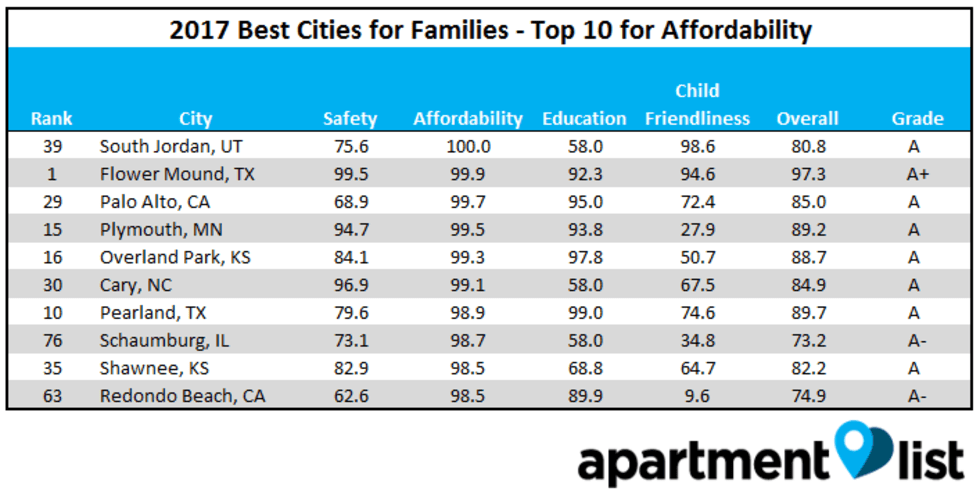
The median rent in South Jordan, UT is only 20% of household income, which is well below the recommended cap of 30%. Overall, the 10 highest ranking cities for affordability tend to be on the interior of the country, with the exception of two wealthy communities in CA (Palo Alto and Redondo Beach). We were surprised to see those expensive cities make the cut, but high incomes help offset rents there (the median household income is $102K in Redondo Beach, and a staggering $148K in Palo Alto).
California cities outperform on school quality 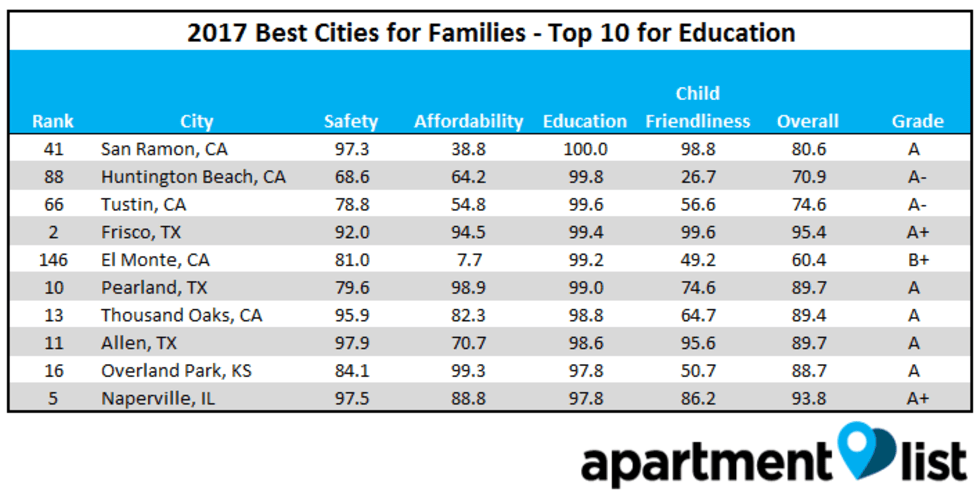
Five of the ten cities with the best high school graduation rates are located in CA, and an additional three are located in TX. Each of the cities listed in the above table graduated over 97% of their public high school students in the most recent year for which data was available.
Large cities tended to underperform on this measure, with 14 of nation’s 25 largest cities receiving education grades of C or lower. The best performing large cities were San Antonio, Austin, and San Diego, which all scored A- or better.
Weston, FL is best for child friendliness
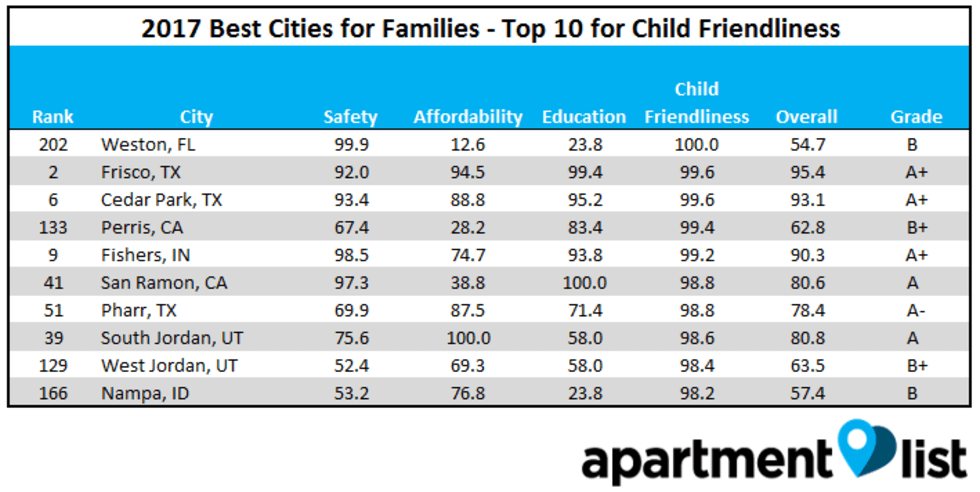
Over 26% of Weston’s population is under the age of 18, compared to the national average of 16.7%. Weston also ranks #2 for safety, but its overall score is middling due to below average scores for our other factors. TX, UT, and CA each have multiple cities in the top 10 for child friendliness.
Conclusion
With a strong mix of safety, affordability, and good public schools, Texas has some of the best choices for families trying to decide where to settle. Small to mid-size cities in the Midwest also tend to perform well, but there are an array of great options across the country.