Introducing Our Newest Data Product: Concession Rates
Introduction
Since 2022 the United States rental market has been in a bit of a cold snap. As of September 2026 the national vacancy rate stands at 7%, while rents have fallen 4% from their mid-2022 peak. This softening of rents has coincided with a period of rapid multifamily construction and a slowdown in household formation, tipping the market in favor of renters while property managers compete to fill vacant units.
But price isn’t the only lever that property managers can pull to attract new residents. New-lease concessions are becoming an increasingly popular strategy for securing leases. Concessions can take many forms, including discounted rents, cash back offers, gift cards, or free amenities. In many cases they push net effective rent below the advertised prices, amplifying the rent declines currently captured in our rent model.
In an effort to continue providing actionable, real-time data on the rental market, the Apartment List Economics Team is publishing a new dataset that tracks the prevalence of high-value concessions being offered in rental markets across the country.
Defining A Concession
Not all concessions are created equal. An apartment community offering 12 free weeks of rent is providing significantly more value to a prospective renter than another offering a $250 gift card. Our concession model parses the details of tens of thousands of offers listed on our platform every day. We analyze the raw text of the offer in order to identify the item targeted by the discount (monthly rents, application fees, security deposits, etc), the cost structure (dollars off, a percentage reduction, etc), and the timing (a one-time price cut, savings on a set number of weeks/months, etc). Our methodology leverages a complex large language model to turn text-based concessions into structured data.
For our published dataset, we use a stable, standardized definition for a concession: any discount whose total value is equal to one free month of rent or greater. This can appear in the data in a few ways, for example:
- Free rent for 1 or more months
- Free rent for 4 or more weeks
- A 50% rent discount that extends for 2 or more months
- A one-time dollar discount worth more than the median rent at the property on that day
Our published concession rate is the share of properties in a market advertising a discount that meets one of these criteria in any given month.
In today’s soft market, concessions are getting more popular
As of September 2026, the nationwide concession rate is 31.3%, ie, 31.3% of multifamily properties across the country are advertising concessions worth at least one month of free rent on new leases. The daily concession rate back to the start of 2025 is presented below.
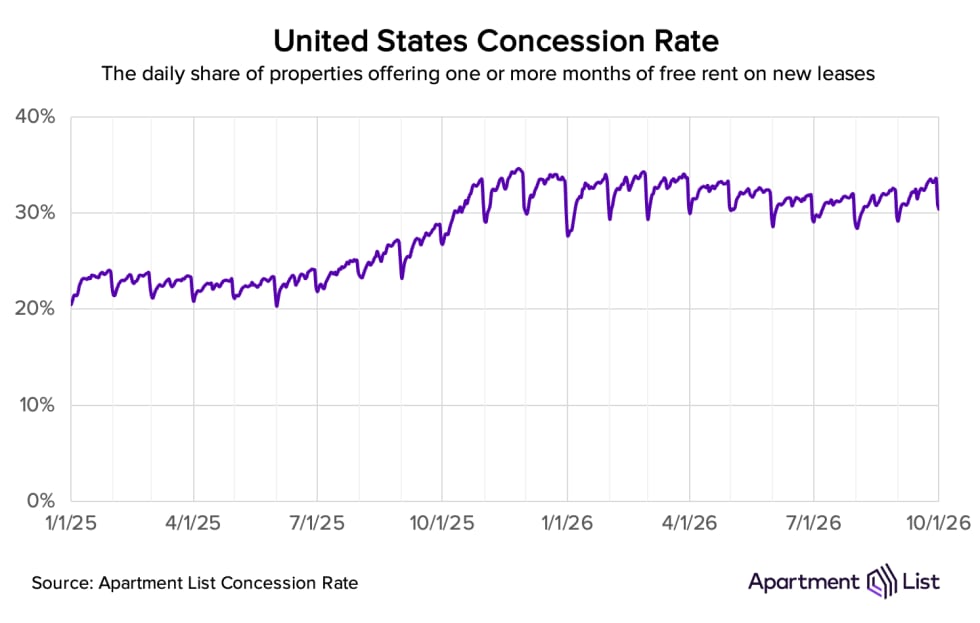
The daily concession rate shows three distinct trends signalling shifts in property behavior:
- A daily trend: Concessions dip on the first of each month (the most popular day to sign a lease) and are gradually activated throughout the month. Properties are most likely to offer concessions at the end of each month, as they attempt to fill units before a new monthly billing cycle begins.
- A seasonal trend: Concessions dip lightly during the summer, then ramp up during the winter. This is consistent with seasonal patterns in rent and demand. Fewer renters move during the winter, so not only are properties more likely to lower prices, they’re more likely to offer concessions.
- A long-term trend: As the rental market has been cooling for 3+ years, the concession rate is higher in 2026 than it was in 2025. Concessions have become an increasingly popular tactic to draw in demand while renters exercise more patience. The nationwide concession rate in September 2026 (31.3%) is 5.9 percentage points higher than it was in September 2025 (25.4%).
Local market dynamics are highly visible in the concessions data
It’s no surprise that in soft rental markets, more operators turn to concessions to entice demand. San Antonio, TX, for example, has experienced falling rents for three full years, and is currently one of the softest rental markets in the country, with annualized rent growth falling as low as -5.0% earlier this year. As a result, concessions in San Antonio have spiked, and today 57% of properties are offering at least a free month of rent.
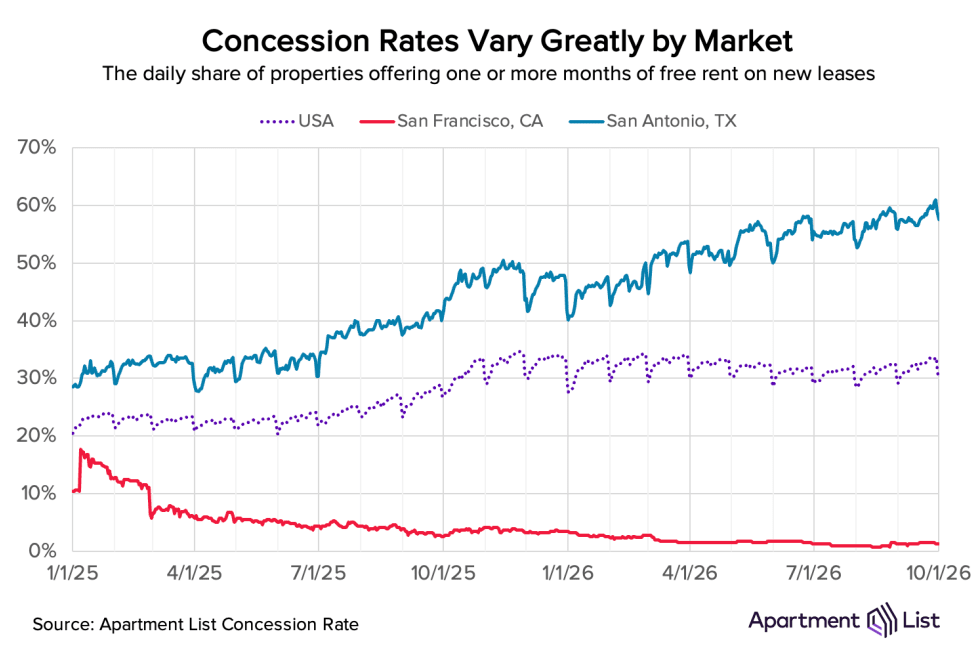
On the other end of the spectrum is San Francisco, CA, which has been making headlines in 2026 for its eye-popping rent inflation. With a vacancy rate below 3% and annualized rent growth exceeding 25%, property managers in San Francisco have no need for additional incentives, and the concession rate has steadily fallen to one of the lowest in the nation: just 1.2% in September 2026.
This relationship – rent growth negatively correlated with concession rates – holds true across much of the country. Below is a scatter plot with year-over-year rent growth on the y-axis and concession rates on the x-axis, as of September 2026. Huddled in the upper left quadrant are many Midwest and Northeast cities, where modest construction and steady demand has kept rent growth positive for the past few years. Western cities (California notwithstanding) and Southern cities fill up the bottom right quadrant, where rents are falling and concessions have become popular.
Below are September 2026 concession rates for 50 large U.S. cities. Atop the list are Southern and Western cities where supply has expanded rapidly, creating a competitive environment for property managers. The highest concession rate is in Austin, TX (57.4%) followed closely by Henderson, NV (57.0%), San Antonio, TX (56.8%), and Charlotte, NC (56.7%).
At the other end of the spectrum are high-demand cities where the market is competitive for renters, not property managers. Chicago and San Francisco have the nation’s two lowest concession rates (1.1% and 1.2%, respectively), followed by Virginia Beach, VA (3.9%), which has consistently maintained some of the fastest rent growth in the country over the past year.
Data availability and publication
Starting this month, Apartment List Concession Rates will be made publicly available alongside our existing data products: rent estimates, vacancy rates, and median time-on-market. Concession data are available for nearly 400 locations, spanning states, counties, cities, and metropolitan areas. These datasets are free to download and use. Any publications or reports using figures or charts derived from any of our datasets must cite Apartment List as the source; we also ask that any digital publications citing our data include a link to the source page. If you have any questions about the data, feel free to reach out to the Apartment List Economics Team at research@apartmentlist.com.
Share this Article