Welcome to the June 2016 Texas Apartment List Rent Report. Rent growth in the Lone Star State hover just above that of the nation, and in this report, we’ll evaluate trends across the whole state as well as variations between cities.
Texas Rent Growth
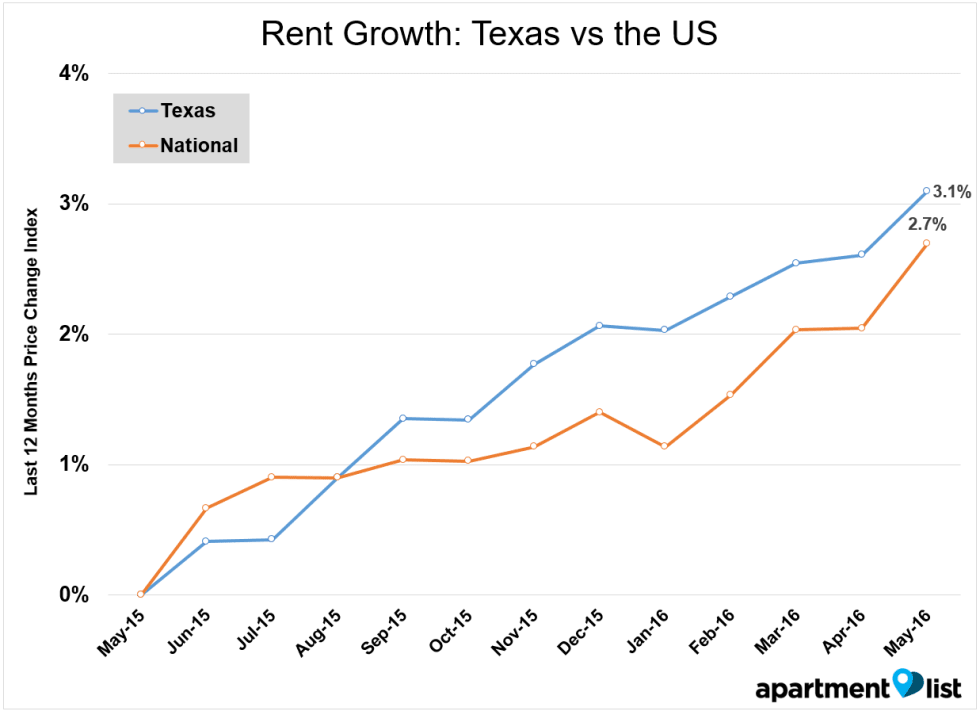
In Texas, rents increased 0.5% over last month, and are up 3.1% over last year. A 1-bedroom in Texas costs $1,020, while a 2-bedroom has a median rent price of $1,240.
Top 10 Most Expensive Cities
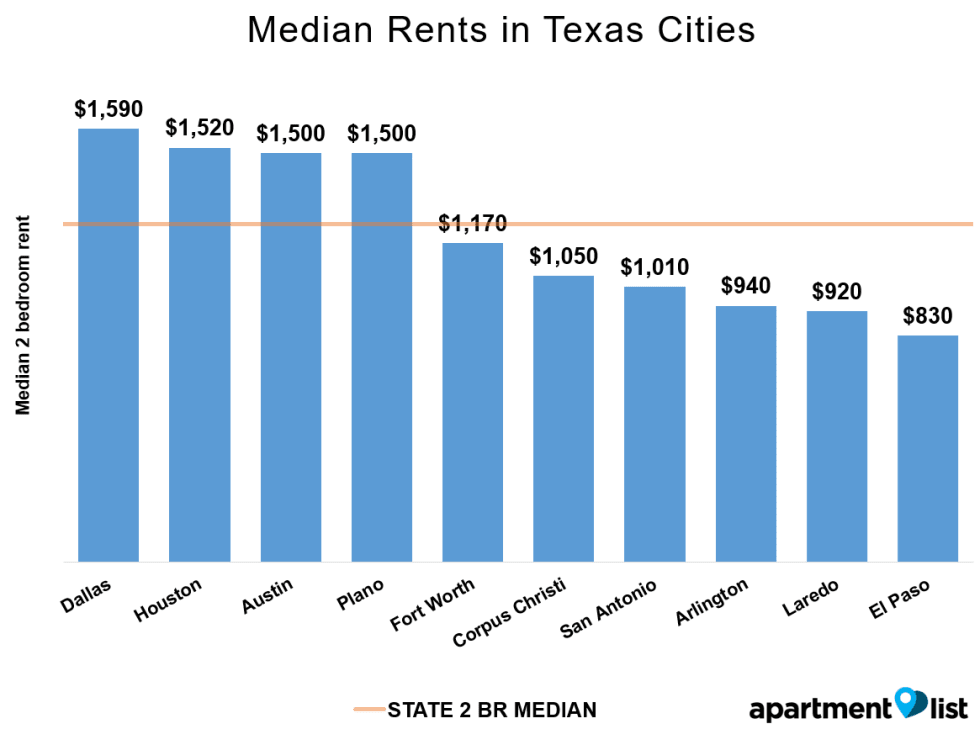
- Dallas: Dallas is Texas’ most expensive city for renters, with 2-bedrooms at $1,590. Dallas rents have grown year-over-year by 5.8%, which is higher than both statewide and national averages. A 1-bedroom in Dallas has a median rent price of $1,220.
- Austin and Plano: Plano joins Texas’ capital in a tie for the 3rd most expensive city, with median rents at $1,500 for a 2-bedroom. 1-bedroom rents run a median rent price of $1,190 in Austin, and $1,090 in Plano.
- San Antonio: Located southwest of Austin, San Antonio places 7th for most expensive Texas cities. A 2-bedroom in San Antonio costs $1,010, while 1-bedrooms go for $850. Rents there have risen 3.4% in the past year.
Top 10 Cities with the Fastest Rent Growth
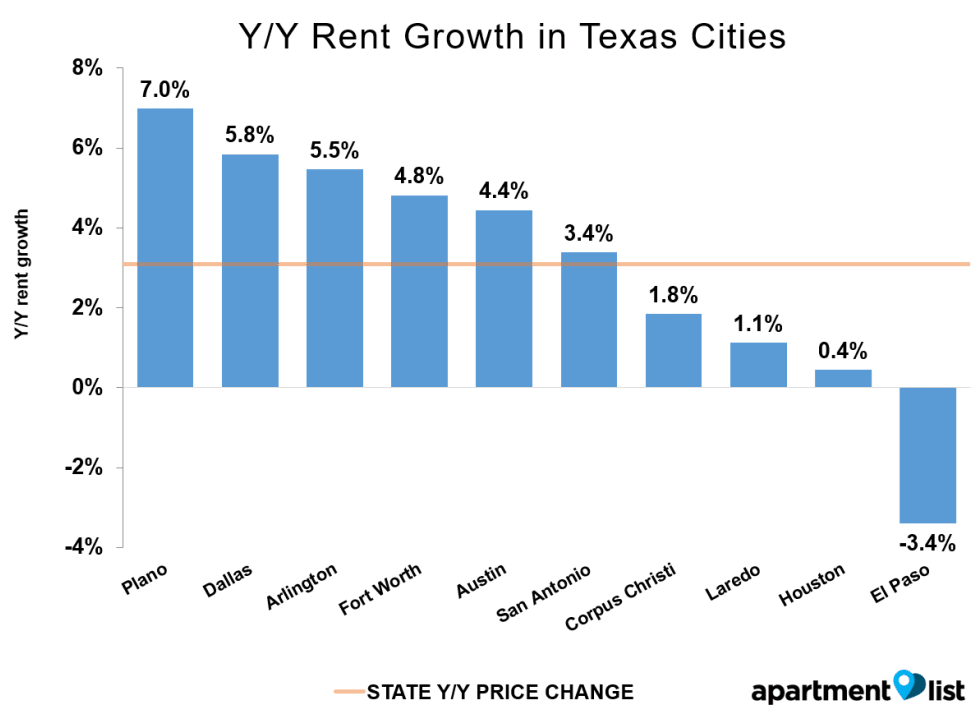
- Plano: In addition to placing as Texas’ 4th most expensive city, Plano also shows the highest year-over-year rent growth, with a 7.0% increase over May 2015. Plano rents have grown 0.9% over last month.
- Fort Worth: Just west of Dallas, Fort Worth (median 2-bedroom rent $1,170) showed the 4th largest rent increase with 4.8% growth over last year. Fort Worth was one of just six Texas cities with rent growth that exceeds statewide and national averages.
- Houston: In addition to ranking 2nd for most expensive Texas rents, Houston ranks 9th for biggest rent increase, with rents 0.4% higher than they were last year. Houston rents are up 0.1% over last month. A 2-bedroom in Houston runs a median rent price of $1,520.
For full data and methodology, please see below. And as always, feel free to contact us with any questions!
Data & Methodology
June 2016 Apartment List Texas Rent Data
Texas | State | $1,020 | $1,240 | 0.5% | 3.1% |
---|---|---|---|---|---|
Abilene, TX | City | $630 | $750 | 0.5% | 1.1% |
Addison, TX | City | $1,320 | $1,720 | 0.9% | 5.6% |
Allen, TX | City | $1,030 | $1,420 | -0.2% | 5.4% |
Amarillo, TX | City | $620 | $770 | 1.0% | 1.9% |
Arlington, TX | City | $740 | $940 | 0.2% | 5.5% |
Austin, TX | City | $1,190 | $1,500 | 0.5% | 4.4% |
Baytown, TX | City | $760 | $890 | -0.7% | -1.9% |
Beaumont, TX | City | $990 | 1.1% | 1.1% | |
Bedford, TX | City | $810 | $1,020 | 1.0% | 12.6% |
Bee Cave, TX | City | $1,160 | $1,560 | 1.5% | 0.3% |
Boerne, TX | City | $980 | 0.3% | 2.9% | |
Brownsville, TX | City | $750 | 0.3% | 3.3% | |
Bryan, TX | City | $640 | $750 | 1.0% | 5.9% |
Carrollton, TX | City | $960 | $1,170 | 0.7% | 8.0% |
Cedar Park, TX | City | $1,010 | $1,240 | 0.7% | 6.0% |
Cinco Ranch, TX | City | $1,190 | 0.3% | -0.1% | |
College Station, TX | City | $670 | $750 | 0.9% | 3.5% |
Conroe, TX | City | $940 | $1,210 | -1.0% | 1.9% |
Converse, TX | City | $1,000 | -1.5% | ||
Coppell, TX | City | $1,050 | $1,330 | 0.9% | 5.0% |
Copperas Cove, TX | City | $510 | -1.5% | -3.2% | |
Corpus Christi, TX | City | $820 | $1,050 | -0.1% | 1.8% |
Dallas, TX | City | $1,220 | $1,590 | 0.8% | 5.8% |
Denton, TX | City | $810 | $1,000 | 0.6% | 2.8% |
DeSoto, TX | City | $970 | 0.7% | 6.5% | |
Edinburg, TX | City | $550 | $730 | 0.0% | 1.4% |
El Paso, TX | City | $660 | $830 | 0.3% | -3.4% |
Euless, TX | City | $870 | $1,150 | 1.1% | 6.0% |
Farmers Branch, TX | City | $1,290 | $1,500 | 1.5% | 10.2% |
Flower Mound, TX | City | $1,130 | $1,550 | 1.8% | 7.8% |
Fort Worth, TX | City | $940 | $1,170 | 1.0% | 4.8% |
Friendswood, TX | City | $1,040 | 0.9% | ||
Frisco, TX | City | $1,220 | $1,590 | 1.8% | 8.5% |
Galveston, TX | City | $920 | $1,330 | 0.9% | 17.2% |
Garland, TX | City | $780 | $980 | 1.4% | 8.1% |
Georgetown, TX | City | $1,480 | |||
Grand Prairie, TX | City | $940 | $1,100 | -1.0% | 7.4% |
Grapevine, TX | City | $1,140 | $1,510 | 1.0% | 2.2% |
Greenville, TX | City | $700 | |||
Haltom City, TX | City | $930 | $1,090 | 1.0% | 10.9% |
Harker Heights, TX | City | $720 | 0.2% | -1.9% | |
Harlingen, TX | City | $550 | $700 | 0.6% | 1.7% |
Houston, TX | City | $1,220 | $1,520 | 0.1% | 0.4% |
Humble, TX | City | $850 | $1,090 | 0.2% | 1.1% |
Hurst, TX | City | $900 | 0.4% | 15.5% | |
Irving, TX | City | $980 | $1,290 | 0.6% | 7.4% |
Jersey Village, TX | City | $910 | $1,130 | 1.1% | |
Katy, TX | City | $1,060 | $1,400 | 0.4% | 1.2% |
Keller, TX | City | $1,120 | $1,250 | 2.2% | 2.8% |
Killeen, TX | City | $580 | 0.3% | -4.3% | |
Laredo, TX | City | $800 | $920 | 0.0% | 1.1% |
League City, TX | City | $1,020 | $1,270 | -0.7% | 6.0% |
Lewisville, TX | City | $940 | $1,210 | 0.2% | 4.3% |
Little Elm, TX | City | $1,110 | $1,600 | 0.8% | |
Longview, TX | City | $650 | $770 | -0.1% | 4.9% |
Lubbock, TX | City | $560 | $800 | 1.4% | 0.8% |
Lufkin, TX | City | $620 | -0.5% | 12.4% | |
Magnolia, TX | City | $960 | $1,330 | 1.1% | 2.4% |
Mansfield, TX | City | $950 | $1,370 | 1.9% | 3.5% |
McAllen, TX | City | $660 | $870 | 0.2% | 1.3% |
McKinney, TX | City | $980 | $1,360 | 1.9% | 3.2% |
Mesquite, TX | City | $820 | $910 | 0.6% | 5.9% |
Midland, TX | City | $750 | $1,030 | -3.7% | -21.6% |
Missouri City, TX | City | $1,090 | $1,430 | 2.6% | 2.4% |
Nassau Bay, TX | City | $1,480 | 1.6% | ||
New Braunfels, TX | City | $910 | $1,160 | 0.4% | 4.6% |
North Richland Hills, TX | City | $850 | $1,040 | 1.4% | 9.8% |
Odessa, TX | City | $720 | $970 | 0.0% | -26.0% |
Pasadena, TX | City | $840 | $1,290 | -0.9% | 5.4% |
Pearland, TX | City | $1,120 | $1,400 | -0.4% | 2.1% |
Pflugerville, TX | City | $1,030 | $1,440 | 1.0% | 5.6% |
Plano, TX | City | $1,090 | $1,500 | 0.9% | 7.0% |
Port Arthur, TX | City | $800 | |||
Richardson, TX | City | $1,160 | $1,460 | 0.6% | 7.8% |
Richmond, TX | City | $1,030 | $1,310 | -0.2% | -0.2% |
Rockwall, TX | City | $1,140 | $1,480 | 7.3% | 25.6% |
Rosenberg, TX | City | $1,030 | $1,400 | 0.8% | -0.1% |
Round Rock, TX | City | $1,000 | $1,180 | 0.3% | 5.9% |
San Antonio, TX | City | $850 | $1,010 | 0.7% | 3.4% |
San Marcos, TX | City | $850 | $1,000 | -0.9% | 5.8% |
Seabrook, TX | City | $970 | $1,210 | 3.3% | |
Sherman, TX | City | $690 | -0.1% | ||
Spring, TX | City | $1,000 | $1,250 | 0.5% | -2.2% |
Stafford, TX | City | $1,070 | $1,340 | 0.0% | 0.3% |
Sugar Land, TX | City | $1,100 | $1,430 | 0.0% | -0.2% |
Temple, TX | City | $760 | 0.9% | -1.0% | |
Texarkana, TX | City | $650 | $730 | 0.6% | 2.5% |
Texas City, TX | City | $700 | $880 | -1.7% | 4.4% |
The Colony, TX | City | $1,100 | $1,470 | 2.9% | -1.0% |
The Woodlands, TX | City | $1,110 | $1,470 | 0.7% | 0.8% |
Tomball, TX | City | $950 | $1,120 | 0.9% | |
Tyler, TX | City | $700 | $840 | 0.5% | -0.6% |
Universal City, TX | City | $800 | 0.3% | -2.0% | |
Victoria, TX | City | $700 | $840 | 0.2% | |
Waco, TX | City | $500 | 1.0% | -0.2% | |
Webster, TX | City | $880 | $1,170 | -0.9% | 2.2% |
Wichita Falls, TX | City | $510 | $680 | 0.2% | |
Selma, TX | City | $1,190 | |||
Atascocita, TX | City | $1,180 | 2.7% | -1.9% | |
University Park, TX | City | $2,250 | |||
Wells Branch, TX | City | $1,020 | $1,390 | 0.0% | 4.5% |
Angelina County, TX | County | $620 | -0.5% | 12.4% | |
Bell County, TX | County | $650 | 0.4% | -4.0% | |
Bexar County, TX | County | $850 | $1,020 | 0.6% | 2.9% |
Bowie County, TX | County | $710 | 0.6% | 2.5% | |
Brazoria County, TX | County | $1,090 | $1,390 | -0.2% | 2.0% |
Brazos County, TX | County | $650 | $750 | 0.9% | 4.8% |
Cameron County, TX | County | $550 | $750 | 0.8% | 2.5% |
Collin County, TX | County | $1,080 | $1,460 | 1.1% | 6.7% |
Comal County, TX | County | $910 | $1,160 | 0.7% | 2.4% |
Coryell County, TX | County | $510 | -1.5% | -3.2% | |
Dallas County, TX | County | $1,170 | $1,480 | 0.8% | 6.1% |
Denton County, TX | County | $960 | $1,210 | 0.7% | 5.2% |
Ector County, TX | County | $720 | $960 | -0.2% | -26.1% |
El Paso County, TX | County | $660 | $830 | 0.3% | -3.4% |
Ellis County, TX | County | $790 | $900 | 2.6% | 0.2% |
Fort Bend County, TX | County | $1,070 | $1,420 | 0.4% | 1.1% |
Galveston County, TX | County | $930 | $1,180 | -0.4% | 5.3% |
Grayson County, TX | County | $610 | $700 | 0.4% | |
Gregg County, TX | County | $630 | $760 | -0.1% | 4.9% |
Guadalupe County, TX | County | $1,000 | -0.9% | ||
Harris County, TX | County | $1,140 | $1,430 | 0.1% | 0.6% |
Hays County, TX | County | $890 | $1,040 | -0.6% | 5.8% |
Hidalgo County, TX | County | $680 | $800 | 0.1% | 1.5% |
Hood County, TX | County | $900 | |||
Hunt County, TX | County | $730 | -0.5% | ||
Jefferson County, TX | County | $820 | 0.8% | 1.2% | |
Johnson County, TX | County | $760 | 1.5% | 4.9% | |
Kendall County, TX | County | $780 | $970 | -0.4% | 3.6% |
Lubbock County, TX | County | $550 | $790 | 1.4% | 0.7% |
McLennan County, TX | County | $500 | 0.3% | -2.4% | |
Midland County, TX | County | $810 | $1,090 | -3.4% | -21.2% |
Montgomery County, TX | County | $1,040 | $1,330 | 0.5% | -0.3% |
Nueces County, TX | County | $820 | $1,040 | -0.1% | 1.8% |
Parker County, TX | County | $750 | |||
Potter County, TX | County | $700 | -0.7% | -0.7% | |
Randall County, TX | County | $630 | $800 | 2.1% | -0.5% |
Rockwall County, TX | County | $1,100 | $1,420 | 7.2% | 25.1% |
San Patricio County, TX | County | $740 | 1.6% | ||
Smith County, TX | County | $700 | $830 | 0.5% | -0.6% |
Tarrant County, TX | County | $870 | $1,080 | 0.8% | 5.7% |
Taylor County, TX | County | $630 | $750 | 0.5% | 1.0% |
Travis County, TX | County | $1,200 | $1,530 | 0.5% | 4.1% |
Victoria County, TX | County | $700 | $840 | 0.2% | |
Webb County, TX | County | $800 | $920 | 0.0% | 1.1% |
Wichita County, TX | County | $510 | $660 | 0.3% | |
Williamson County, TX | County | $1,020 | $1,310 | 0.9% | 6.7% |
Palo Pinto County, TX | County | $640 |
Methodology:
Apartment List Rent Report data is drawn monthly from the millions of listings on our site. 1-bedroom and 2-bedroom rents are calculated as the median for units available in the specified size and time period. Price changes are calculated using a “same unit” methodology similar to the Case-Shiller “repeat sales” home prices methodology, taking the average price change for units available across both time periods.
About Rental Price Monitors:
Apartment List’s Rent Reports cover rental pricing data in major cities, their suburbs, and their neighborhoods. We provide valuable leading indicators of rental price trends, highlight data on top cities, and identify the key facts renters should know. As always, our goal is to provide price transparency to America’s 105 million renters to help them make the best possible decisions in choosing a place to call home.
