Housing Markets and Income Inequality
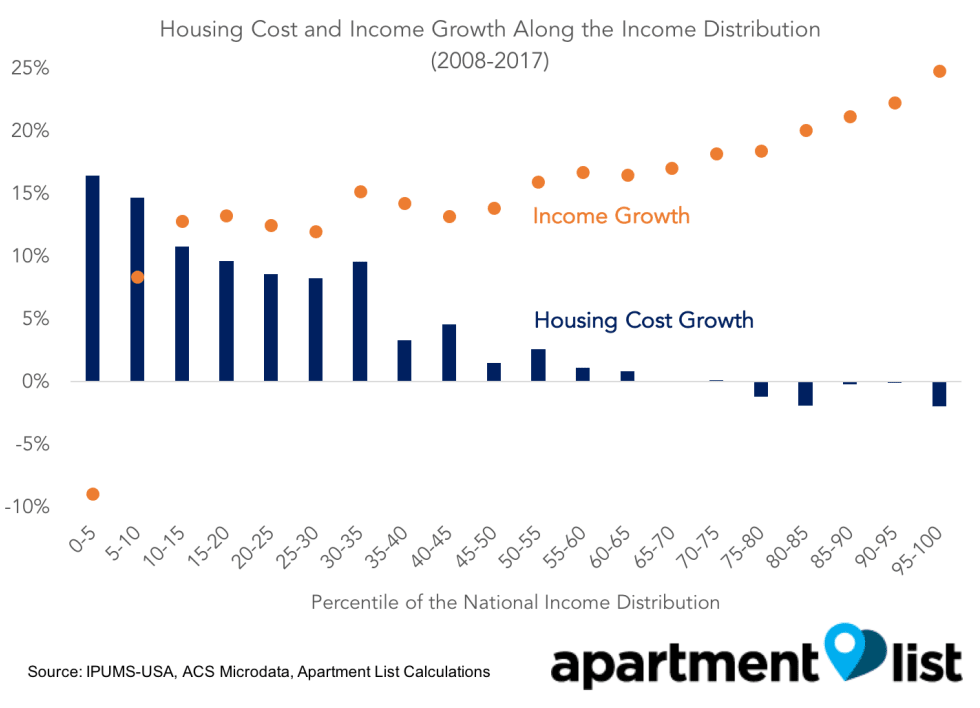
Housing markets are exacerbating the gap between the rich and poor. Incomes are growing fastest for the top of the income distribution (especially for the top 1%), but housing costs are growing fastest for families at the bottom of the income distribution. The bottom 10% of the income distribution has seen their costs rise the most, while the top 25% of earners have actually seen their housing costs fall.
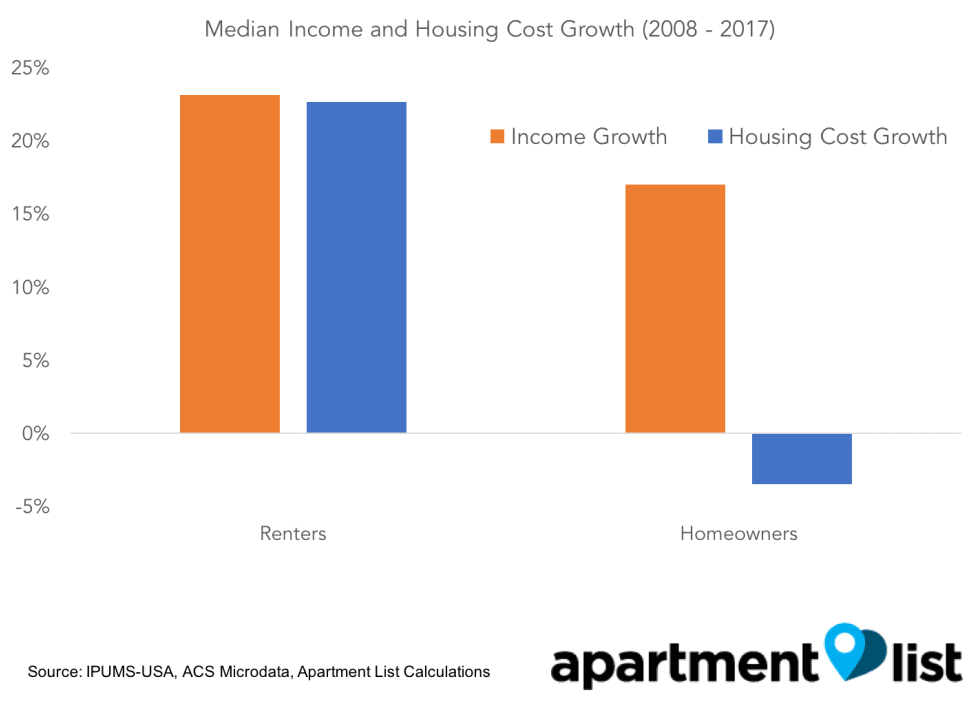
Renters have enjoyed strong income growth over the past decade, but rents have also steadily risen. Monthly housing costs for homeowners, on the other hand, have fallen.
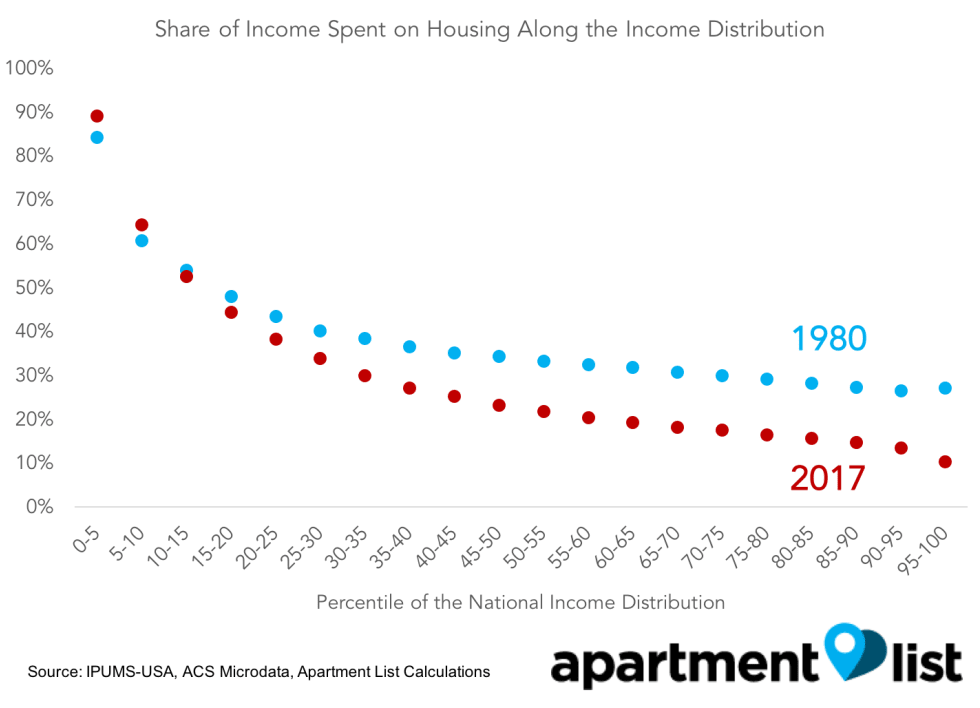
Today, renters at all income levels are spending a greater share of their income on rent than they did in 1980. Homeowners are paying a smaller fraction of their monthly paychecks for housing than they used to.
In each one of the top hundred U.S. metros, housing costs are growing more quickly for those in the bottom half of the income distribution than for those in the top half.
The evolution of inequality is not just a regional phenomenon or a story about growing and declining cities. In fact, most income inequality growth takes place within rather than across regions. We see income inequality rising in nearly all metros (45 of the top 50). Philadelphia has the greatest disparity between its rich and poor residents, while New Orleans has witnessed the greatest inequality growth over the past ten years.
Housing Costs Amplify Growing Income Inequality
By nearly any measure available, income inequality has grown rapidly in the United States since the early 1980s. After a period of broad-based growth in the postwar era, the top of the income distribution began to pull away from the pack. In the past few decades, the top 10% of earners have enjoyed much stronger wage growth than the middle class has. Academics, politicians, and the business community have now all taken note. Presidential hopefuls are proposing new policies to mitigate rising inequality. Academics are focusing their attention on understanding the mechanisms that are driving the trend. Famed investor Ray Dalio went as far as to call American income inequality a “national emergency.”
Meanwhile, the evolution of housing markets is making the gap between the haves and have- nots even bigger. As incomes are growing fastest at the top of the income distribution, housing costs are doing the opposite. Americans in the bottom ten percent of the income distribution have experienced the most rapid growth in housing costs over the past ten years.1 Moving up the income ladder, the richer a household gets the less it has seen rents and mortgage payments spike. At the top, we find that the top quartile of income earners has actually seen their housing costs fall in the last decade.
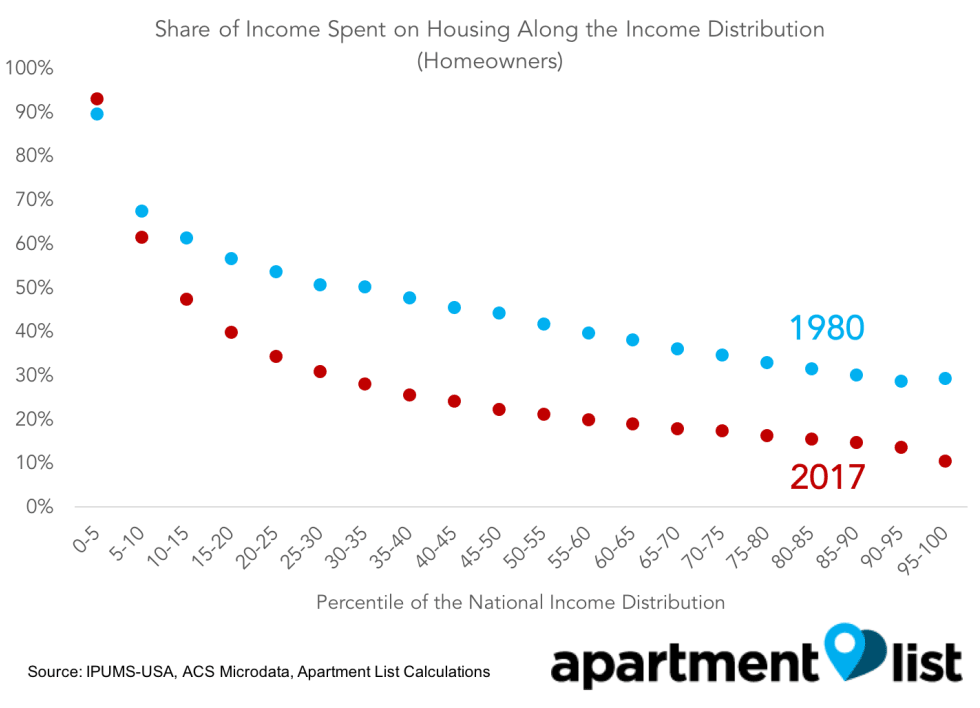
This trend is not new. The following chart compares the share of income spent on housing along the income distribution in 2017 and 1980.2 Those in the bottom twenty percent of the income distribution spend just as much of their income on housing as they used to. It is still unfortunately common for low-income households to spend more than half of their earnings on rent and related costs.3
At higher income levels, however, the two curves diverge. Those in the top half of the income distribution in 2017 spend significantly less of their income on housing than the top half did in 1980. Those at the very top of the income distribution have enjoyed a significant break on their housing costs. Income inequality in the U.S. has grown, but the disparities are even greater after rent and mortgage payments are paid.
Different Incomes but Similar Housing Costs
The distribution of housing costs is far more compressed than the national income distribution. As a result, many households who make vastly different wages pay comparable rents or mortgage payments. The following chart compares average income and housing costs of the top and bottom quartiles in the income distribution to the median household. The left panel focuses on households in the bottom 25 percent of the income distribution, and plots the ratio of their housing costs to the housing costs of the median household alongside the ratio of their income to the income of the median household. The right panel repeats the exercise for households in the top quarter of the income distribution.
Income inequality is much larger than housing cost inequality, and this is true at both the top and bottom of the income distribution. Those in the lowest quartile make only 27% as much as the median household, but they still need to pay 79% of what the median household does each month to housing. America’s poor earn just a fraction of the median family’s income, but their housing costs are not too different.
The Different Paths of Owners and Renters
The horse race between incomes and housing costs has played out differently for renters and homeowners over the past decade. The median income across renters has grown more quickly than homeowner median income, largely due to an influx of high-income renters. The median renter household today earns 23 percent more (in nominal dollars) than the median renter household ten years ago. Over the same period, however, the nominal median rent paid has also grown by 23 percent.
The median household that owns their home, however, is paying less today than they did a decade ago. The pull from lower mortgage rates and the ability to refinance have overpowered the rising prices that new buyers are paying. The net effect is that the median homeowner is paying less out of pocket each month.
For homeowners, rising incomes and falling costs imply lower cost burdens. Renters incomes, on the other hand, have grown proportionally with rents. Looking over a longer time horizon, we see that homeowner burdens have fallen across the income distribution since 1980. Homeowners near the top of the income distribution have seen the greatest decline in their share of income spent on housing.
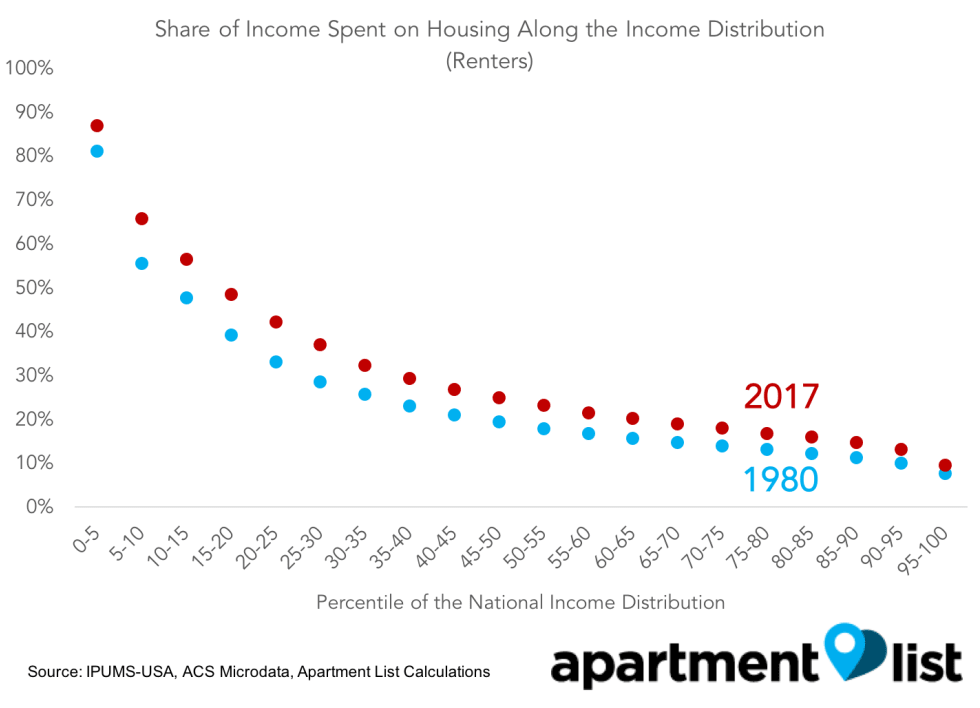
For renters, the unfortunate opposite story emerges. Rent payments cut deeper into paychecks today for all renters, but especially for those near the bottom of the national income distribution.
These trends partially explain why the bottom half of the income distribution is seeing growing housing costs. The likelihood of renting falls with household income. In fact, the median homeowner income is higher than the median renter income in every single one of the largest 100 metros in the U.S. In 55 of the 100 most populated metros, median homeowner income is more than double the median renter income. Differential trends in housing costs for renters and owners are exacerbating renter-homeowner inequality.
Inequality is Rising Within and Across America’s Metros
Though the debate around inequality is taking place at the national level, inequality is often experienced more acutely at a local level. The actual and perceived gaps between the rich and poor within a city or community can have enormous effects on both quality of life and individual decision making. This begs the question: are we seeing inequality grow because regional incomes are drifting apart or because individual incomes within a region are becoming more unequal?
The answer: both. Regional disparities exist, and they do appear to be widening. In 2008, the metro area in ranking tenth (out of the top 100 by population) had a median income that was 49% greater than the median income of the metro ranking ninetieth. By 2017, this 90-10 metro premium rose to 57%. Incomes of richer metros are growing faster than the incomes of poorer metros.
Inequality is also rising within metro areas, however. When we compare the 90-10 ratio, a common measure of inequality, for metros over time, we find that 45 of the top 50 metros have experienced growing income inequality over the past decades. The 90-10 ratio measures the income at the 90th percentile of the income distribution compared to income at the 10th percentile. Only 19 of the top 100 metros have witnessed declining local inequality by this measure. The rich are pulling away from the poor within most American cities.
| Metro | Households in the Metro | 90-10 Ratio in 2008 | 90-10 Ratio in 2017 | Inequality Growth |
|---|---|---|---|---|
| Philadelphia, PA | 2,295,099 | 12.7 | 17.2 | 35.3% |
| New York, NY | 7,183,882 | 14.9 | 16.8 | 12.3% |
| New Orleans, LA | 481,826 | 10.8 | 15.6 | 44.2% |
| Boston, MA | 1,842,878 | 13.2 | 15.1 | 14.2% |
| San Francisco, CA | 1,694,362 | 13.9 | 14.6 | 4.9% |
| Miami, FL | 2,095,985 | 12.8 | 13.8 | 7.5% |
| San Jose, CA | 633,810 | 10.6 | 13.5 | 26.8% |
| Los Angeles, CA | 4,348,545 | 12.1 | 13.4 | 10.4% |
| Memphis, TN | 482,718 | 11.4 | 13.4 | 16.9% |
| Detroit, MI | 1,673,231 | 11.6 | 13.2 | 13.5% |
New Orleans has experienced the largest increase in the gap between the rich and poor (incomes at the ninetieth percentile compared to incomes at the tenth percentile). A number of cities with very strong economic growth over the past decade round out the top ten. San Jose, Orlando, Las Vegas, Phoenix, and Houston all have quickly growing economies but rising inequality.
Changes in housing costs have made matters worse at a local level too. In each of the top 100 metros, households earning less than the median income have seen their housing costs rise more quickly (or fall less) than those in the top half of the income distribution.4
Why and What’s Next?
Income inequality continues to rise in cities throughout the United States, and rising rents are aggravating existing disparities. Growing inequality is not just a matter of regional disparity, but also a phenomenon taking place within housing markets. At the same time, housing costs are growing quickly for the poor but falling for the rich.
Why are housing markets exacerbating the growing gap between the rich and poor in America? There are numerous mechanisms at play, and causality can run in both directions. Rising income inequality can drive up costs for low income residents in supply-constrained markets. If the housing stock is fixed, or difficult to expand, then growing incomes at the top of the income distribution can provide new spending power to bid up prices and create alternative high-value uses for land or housing.
Growing housing disparities can also contribute to local income inequality. If rising housing costs prevent those at the bottom of the income distribution from having capital to invest, relocate, or take risks, then moving up the income ladder becomes challenging. At the other end of the spectrum, falling mortgage rates can do the opposite for those already well off.
There is no silver bullet solution. As policy makers and researchers continue to design and test policy proposals, however, it is important to keep in mind that housing and labor markets are inextricably linked. Housing policy has the potential to alter the course of evolving inequality, and vice versa.
- We plot nominal growth of income and housing costs. We assign each household a percentile in the national income distribution of household income, and aggregate across percentiles within a year.↩
- We plot the share of household income spent on housing for households by their percentile of the national income distribution in 1980 and 2017. Those in lowest category often earn no income or report losses, so we cap the ratio of housing costs to income at one.↩
- Very high housing expenditure shares at the bottom of the income distribution are largely driven by the share of households who earn no income or report losses.↩
- We assign households to either the top or bottom half based on their place in the national income distribution, rather than the local income distribution. This way, we do not conflate housing costs growing for the poor with the city getting richer as a whole (possibly due to an exodus of low income residents).↩
Share this Article
