Why Are We Changing Our Rent Methodology?

Why we are changing our rent methodology
Apartment List publishes monthly reports on rental trends in U.S. cities and states. Renters and policymakers need good information in order to make sound decisions, and we invest significant time and effort in gathering and analyzing rent data. Our work is covered regularly by journalists across the country.
Despite this, we recognize that our analysis has limitations. Today, we announce major updates to our methodology, which we believe addresses the shortcomings of other approaches. To provide transparency, this post outlines the limitations in current data sources, and the changes we have made.
All rent data sources have limitations
There are several different providers of rent data, ranging from government statistics (e.g., the Census Bureau, HUD) to private data providers such as ourselves or Zillow. Each source has advantages and limitations:
| Provider | Data Source/ Methodology | Advantage | Limitations |
|---|---|---|---|
| American Community Survey (ACS) | Surveys sample of households nationwide | - Accurate, unbiased rent estimates - Available across multiple geographies (e.g., county, metro, city, zip) | - 1-2 year lag in data release - Estimates cover all renters, not market rents |
| HUD | Adjusts Census data to account for recent movers and inflation | - Based on accurate Census data - Allows for rough comparisons across metropolitan areas | - Published annually; unable to provide up-to-date rental trends - Based on rough forecast for rent growth nationwide |
| Apartment List (pre-June 2017 methodology) | Same unit analysis on listing data, similar to Case-Shiller | - Published frequently - Same unit methodology provides accurate picture of rental trends | - Biased sample |
| Zillow | Proprietary machine learning model applied to listing data | - Published frequently - Modeling attempts to correct for skew in listings | - Biased sample Zumper |
| Abodo | Median rents based on listing data | - Published frequently | - Biased sample |
The Census is generally considered to be the gold standard in data collection, with surveys that cover large, representative samples of households nationwide. However, their data is released with a significant lag (the most recent year currently available is 2015). The Department of Housing and Urban Development publishes 2017 estimates, but these are based on Census numbers, extrapolated forward to account for inflation.
Private listings companies such as Zillow or Zumper, on the other hand, have up to date data, but draw on a non-representative source of listings (typically skewing towards luxury apartments). Both Zillow and Apartment List’s methodologies attempt to correct for this bias, with some success. Other companies appear to calculate rent growth by comparing median rents from one period to another, resulting in volatile rental trend estimates.
Comparison of Rent Estimates
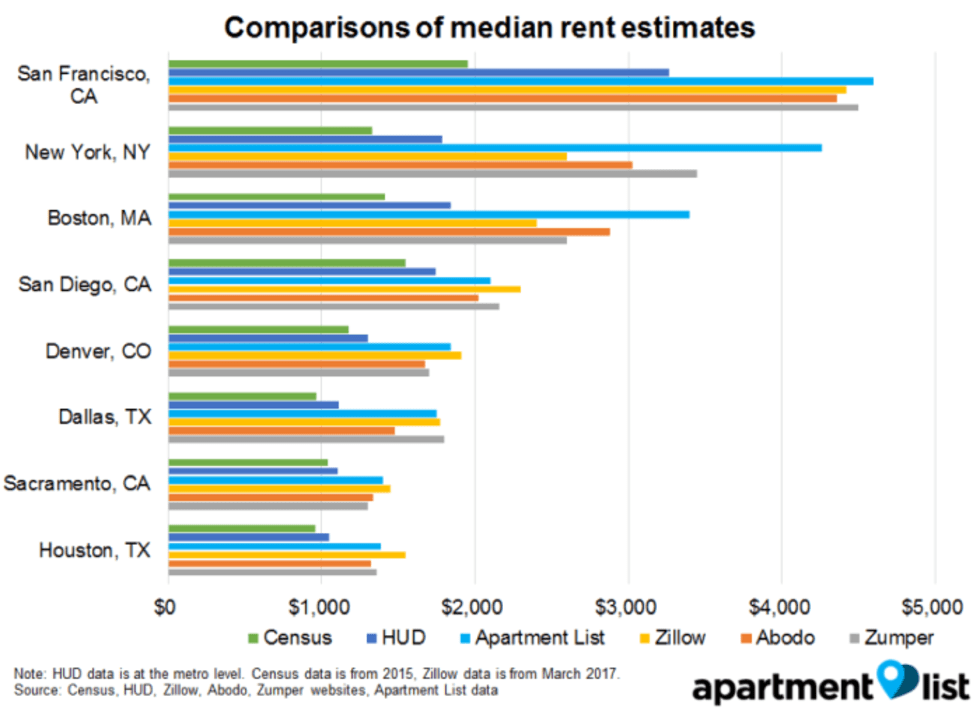
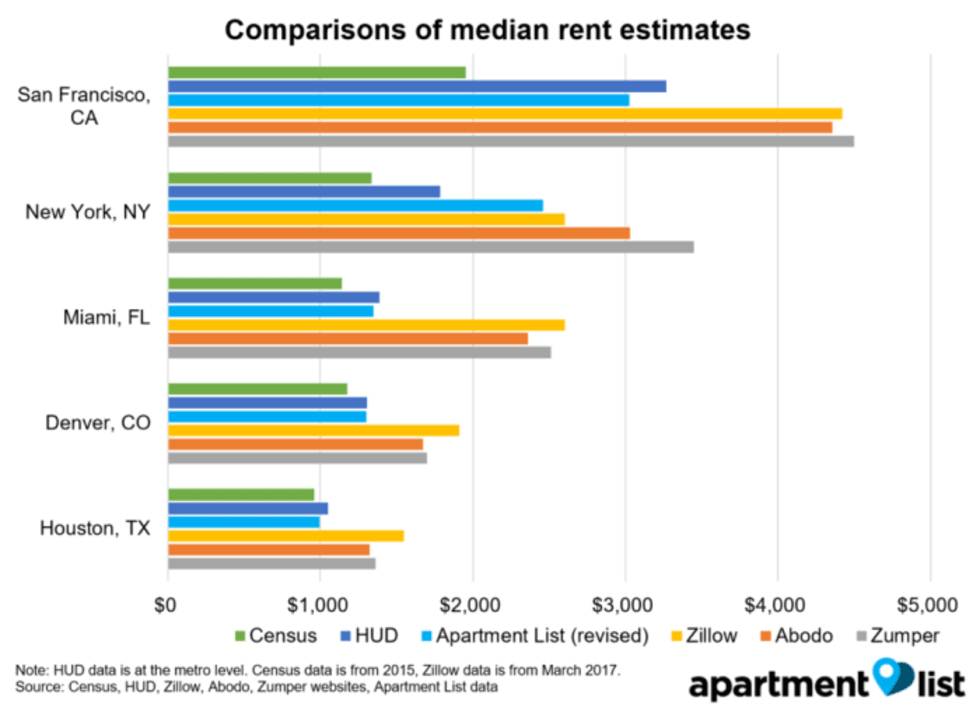
These different methodologies result in vastly different rent estimates.1 In Denver, for example, the ACS estimates two-bedroom rents at $1,176 in 2015, but the most recent reports by Apartment List, Zillow and Zumper show rents of $1,840, $1,909 and $1,700, respectively. Even factoring in rent growth from 2015 to 2017, it is unlikely that private listing companies should have rent estimates 50 percent greater than the ACS. The difference reflects the skew of private listing companies’ data toward luxury apartments.
Even in Miami, Houston and Denver, where professionally-managed properties are more common and span a wide range of property classes, private listing company estimates are still higher than both ACS and HUD estimates. If we trust the data provided by government sources, this confirms that the methodologies that private listing companies employ are insufficient to correct for biases in their inventory.
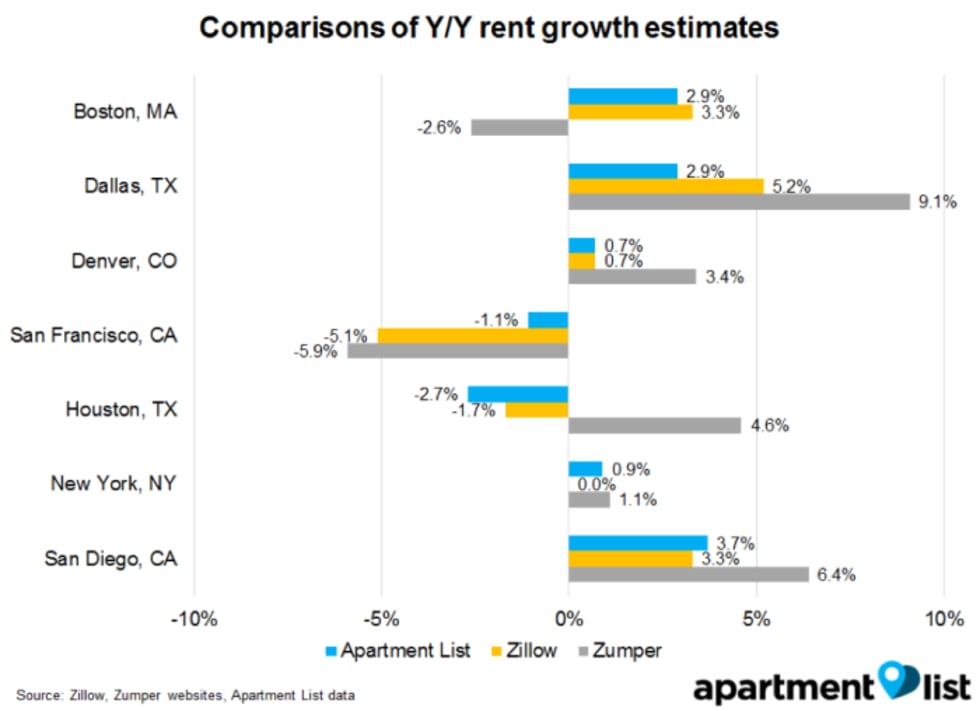
Looking at the estimates for Y/Y rent growth published by different companies (Abodo does not release these numbers), we notice differences across Apartment List, Zillow and Zumper. In five of seven cases, estimates for Apartment List and Zillow are within one percentage point of each other, although there remain larger differences in Dallas and San Francisco.
Estimates by Zumper, however, are often several percentage points off from results released by Apartment List and Zillow. In Houston, for example, both Apartment List and Zillow report rent declines, whereas Zumper estimates a 4.6 percent rent increase.
Our approach
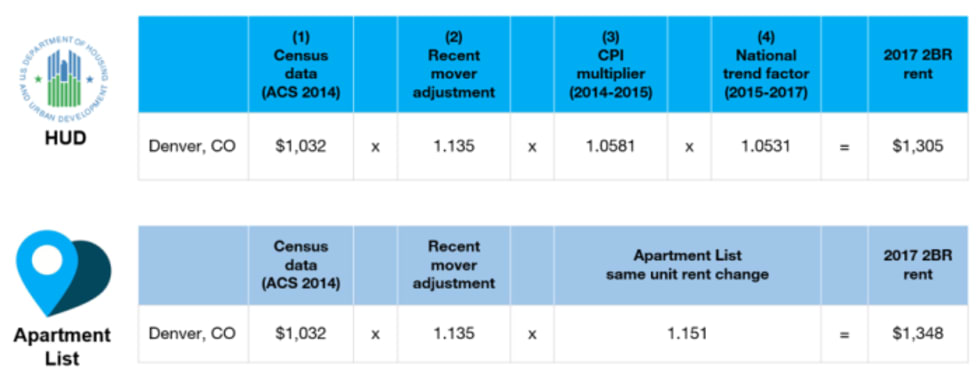
Our updated methodology attempts to correct for the limitations inherent in both public and private data. We start with reliable Census numbers, then extrapolate them forward using our listing data, relying on a same-unit analysis similar to Case-Shiller’s methodology. Essentially, our approach mirrors HUD’s methodology, but using location-specific rental trends instead of a crude nationwide adjustment.
For example, HUD reports that the median rent in the Denver metro was $1,305. To get this, they started with 2014 data from the Census, then extrapolated forward to 2017:
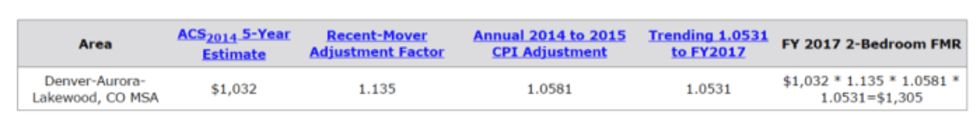
This approach provides rough rent estimates that are used for Section 8 administration, but are unable to account for variations in rent growth across metros, from 2015 to 2017, or from month to month.
Our approach relies on the same base estimates from the Census, but instead of using a crude national adjustment factor, we analyze data from our own listings to calculate the actual change in rents over that time period.2 In doing so, we use a same-unit analysis similar to Case-Shiller’s approach, comparing only units that are available across both time periods to provide an accurate picture of rent growth in cities across the country.
Our new rent estimates are much closer to Census and HUD statistics
Our revised approach produces results that are lower than before - in some cases, markedly so. For example, our previous estimate for Houston 2BR rents was $1,390, but our new methodology produces an estimate of $993. Even larger differences are seen in cities like San Francisco and New York, where our inventory (and that of other listing websites) skews towards expensive parts of the city.
Our new results are typically much closer to statistics published by the Census and HUD. Census numbers include data from all renters and skew lower in rent controlled or stabilized cities like SF and NYC, which explains the big gap with our numbers. In most other locations, however, our estimates are comparable to HUD and Census, with the added benefit of being released every month.
Getting good data is hard, but important
As we talk to renters, journalists and policymakers about rental trends, we realize the importance of good data. The project to revamp our methodology has been challenging, but we believe our approach yields the most reliable, timely data available. We are continuously working to improve our methodology and data, with the goal of providing renters with the information that they need to make the best decisions.
Zillow rent estimates retrieved from https://www.zillow.com/research/data/#rental-data on 5/10/17. Abodo estimates retrieved from https://www.abodo.com/blog/may-2017-national-apartment-report on 5/10/2017. Zumper rent estimates retrieved from https://www.zumper.com/blog/2017/05/zumper-national-rent-report-may-2017/.↩
- Adjusting for recent movers to obtain market rents (1.135)
- Extrapolating forward from 2014 to 2015 using local CPI data (1.0581)
- Extrapolating forward from 2015 to 2017 using a national trend factor (1.0531)
Share this Article
