$1,140
111 Belle Street, Columbus, OH 43215(380) 333-9602Rent Savings
- 22 units available
- Studio • 1 bed • 2 bed
- Amenities
In unit laundry, Nest technology, Patio / balcony, Dishwasher, Pet friendly, New construction + more
Verified listing
Verified

It’s Hispanic Heritage Month (aka Latinx Heritage Month)! This holiday celebrates the Central and South American, Caribbean, Mexican, and Spanish ancestors of American citizens, including their contributions, culture, and history.
In observation of this holiday month, we wanted to create this report and uncover the best cities for Hispanic and Latinx professionals across the country.
Historically, the National Hispanic Heritage observation began as a week-long commemoration in 1968 under President Lyndon Johnson. Later, in 1988, President Ronald Reagan expanded the observation to cover 30 days from September 15 through October 15.
The start of the commemorative month, September 15, marks the anniversary of the independence of Latin American countries Nicaragua, Honduras, Guatemala, El Salvador, and Costa Rica.
Note: In this report, Hispanic refers to the definition of ethnicity used by the United States Census Bureau. It represents people who are from, or descendants of, Spain or from Spanish-speaking countries in Latin America. By this definition, Hispanics can be of any race. We want to acknowledge that while Hispanic and Latino are sometimes used interchangeably and can overlap, they do have different meanings.
To identify the top U.S. cities for Hispanic and Latinx professionals, we analyzed data in four categories: Community & Representation, Economic Opportunity, Housing Opportunity, and Business Environment. The specific metrics within these categories, and their relative weights in our ranking, were determined after surveying members of our Latinx ERG about what makes a city great for them.
The Community & Representation score identifies regions that have a sizable (and growing) Hispanic community. This score considers the share of a city’s population who is of Hispanic or Latinx origin, and to what extent that community has grown over the past decade.


The Economic Opportunity score identifies strong job markets that offer competitive wages for Hispanic and Latinx professionals. This score considers the median income among Hispanic workers and how that income compares to that of non-Hispanic workers.
The Housing Opportunity score evaluates affordability for renters and homeowners within each local housing market. This score considers the renter cost burden rate (the share of renters spending at least 30% of their income on rent) and homeownership rate among Hispanic and Latinx households.


The Business Environment score measures the percentage of local businesses that are Hispanic-owned, and whether that rate is proportional to the overall share of the population that is Hispanic or Latinx.
These four scores, and the individual statistics that comprise them, are weighted and summed to arrive at a final composite score between 0-100. Higher scores indicate places that offer better economic outcomes and better community representation for Hispanic or Latinx workers. We acknowledge that this ranking will capture some, but not all of the socio-economic inequalities that exist between races and locations throughout the United States.
For a more detailed look at the numbers behind the rankings, see the data section at the bottom of this report.
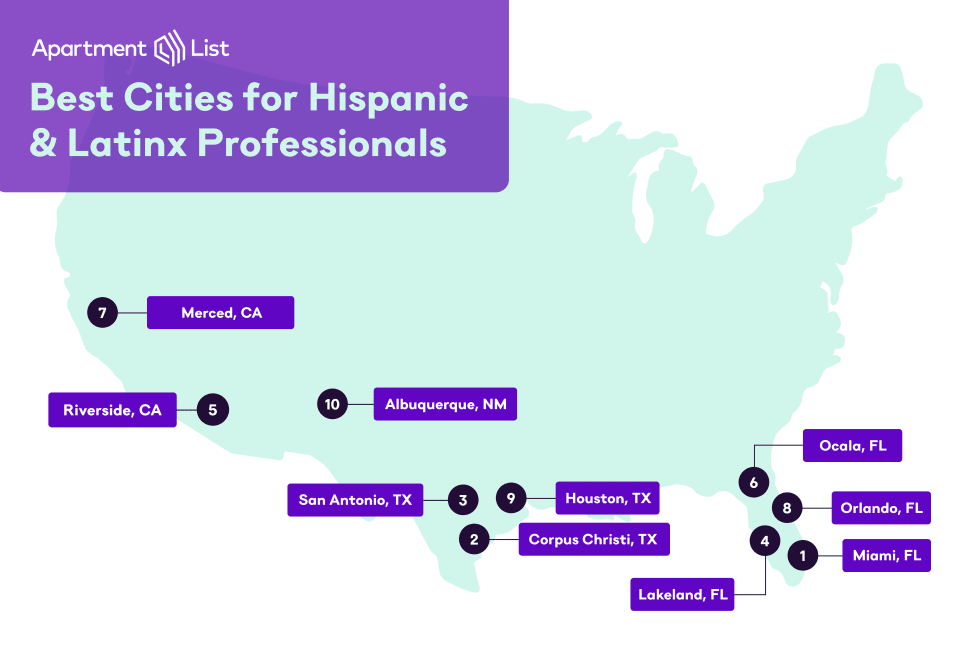
We analyzed 90+ cities to determine the Best Cities for Hispanic and Latinx Professionals:
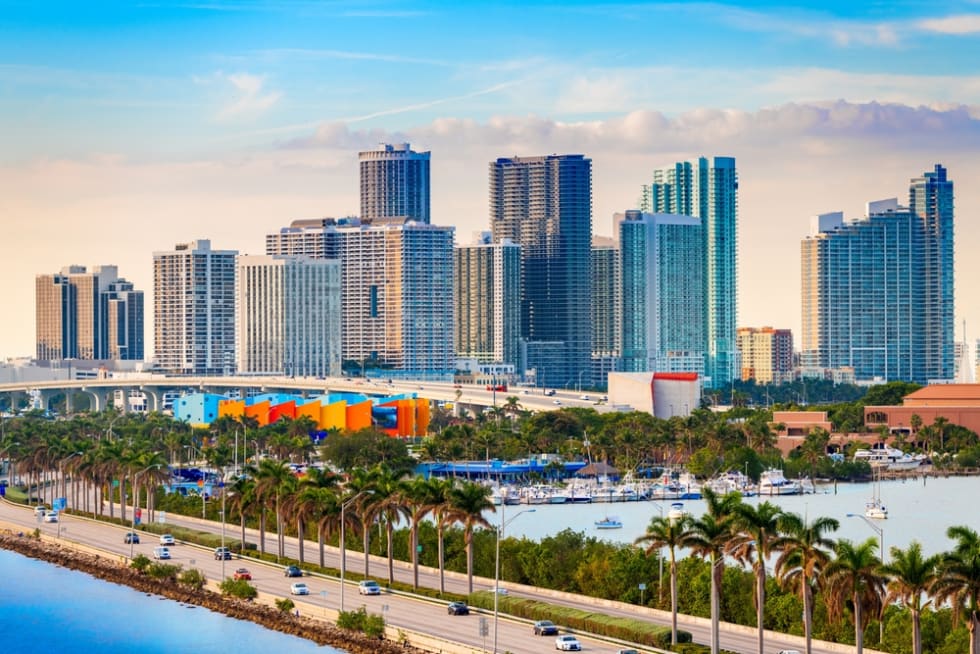
The first city on the list is none other than Miami, Florida. With a final score of 61.68, Miami ranks well on nearly all scores, including a #1 position for the business community, a #10 position for community and representation, and #19 for economic opportunity. Miami’s lowest ranking is for its housing opportunity, which ranks the lowest on our list at #76.
The median income in Miami for the Hispanic and Latinx population is $50,906, which is about average on our list. The Hispanic homeownership rate in Miami is on the lower end of the median, sitting at 51.0%.
A whopping 46.5% of businesses in Miami are Hispanic-owned, the highest representation on our list, making it a destination for Hispanic entrepreneurs. Grab some healthy baked goods at the Vitamin Shoppe or GNC from Eat Me Guilt Free, stop by for a free tasting on the weekend at Lucio Wine Shop, and pick up a plastic-free educational toy from Happy Monkey Shop on your way home.
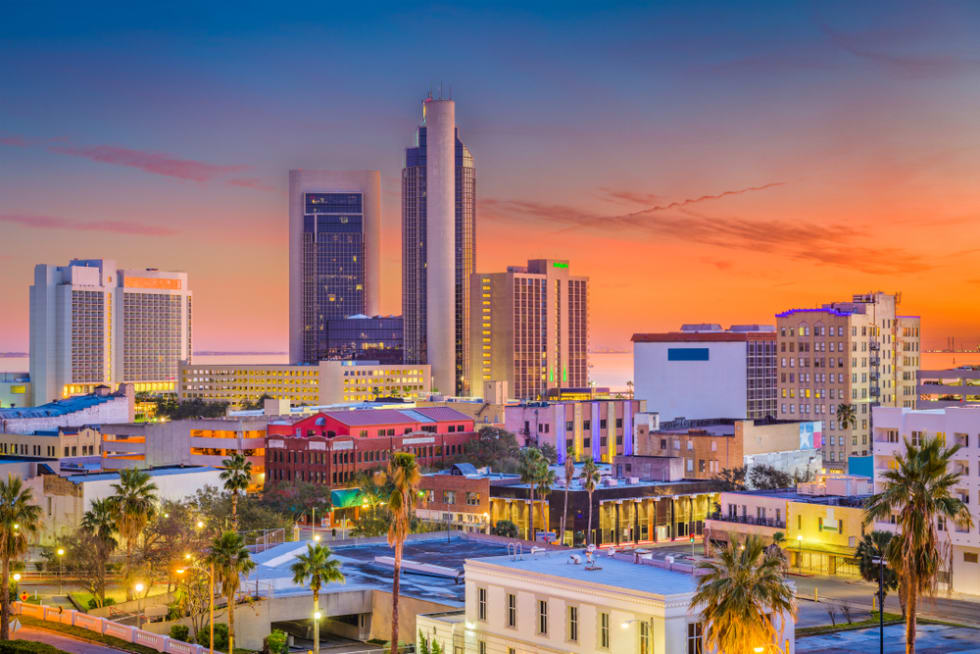
Texas is well-represented on our list with three cities, proving to be one of the best states for Hispanic and Latinx professionals. First up for Texas is Corpus Christi, with a final score of 60.59.
Corpus Christi ranks well for almost every score, including a #1 position for community and representation, a #7 position for the business community, and #10 for housing opportunity. The city’s lowest ranking is for its economic opportunity, which ranks #48.
The median income in Corpus Christi for the Hispanic and Latinx population is $48,870, which is the median on our list. Surprisingly, though, the Hispanic homeownership rate in the city is 57.1%, which is on the higher end of the other cities listed.
Given the high ranking of the business community, it’s no surprise that 42.5% of businesses in Corpus Christi are Hispanic-owned. Find some Y2K goods at Sun Moon and Stars Vintage, get your nails done with My Nail Girl Steph, and check out the boutique storefront of Sew Bonita.

Another Texas city, San Antonio, sits at number 3 on the list. With a final score of 58.83, San Antonio ranks well on almost all scores, which is no surprise as the city also ranks #3 among the best cities for Black professionals.
San Antonio sits at a #4 position for the business community, #6 for community and representation, and #12 for its housing opportunity. San Antonio’s lowest ranking is for its economic opportunity, which ranks #63.
The median income in San Antonio for the Hispanic and Latinx populations is $50,000. While the median income is about average for our list, the Hispanic homeownership rate in San Antonio is relatively high at 57.8%, falling just behind Ocala, Florida.
42.3% of businesses in San Antonio are Hispanic-owned, the third highest ranking on our list. Grab greeting cards crafted by local artists at Feliz Modern, learn ceramics over at MujerArtes Studio, and finish out your day by grabbing a bite to eat from Rosario’s Mexican Restaurant.

The first of the three Florida cities is Lakeland, sitting in the #4 position. With a final score of 63.64, Lakeland also ranks #7 among the best cities for Black professionals as well.
The city ranks high on some scores, including a #3 spot for the business community and #12 for community and representation. On the decent side is a #21 score for economic opportunity and #29 for housing opportunity.
The median income in Lakeland for the Hispanic and Latinx population is $45,083, which is the second lowest on our list, falling just behind Ocala, Florida. Still, the Hispanic homeownership rate in Lakeland is quite high at 56.4%.
When it comes to businesses in Lakeland, 23.3% are Hispanic-owned. You can support Hispanic-owned businesses by shopping at El Patron Supermarket, grabbing a New York-inspired sandwich from Divicious Deli, or eating at Nineteen 61.

The first California city on the list, Riverside, sits at number five. With a final score of 56.39, Riverside ranks well on all scores, including a #9 position for economic opportunity, #7 for community and representation, and #9 for the business community. Riverside’s lowest ranking is for its housing opportunity, which ranks #39.
The median income in Riverside for the Hispanic and Latinx population is $58,400, which is the highest on our list. The Hispanic homeownership rate in Riverside also currently sits at 56.7%.
35.9% of businesses in Riverside are Hispanic-owned. Send the kids off to swim lessons at Desert Swim Academy so you can grab a bite to eat amongst the family recipes at Las Casuelas Terraza and grab something sparkly over at Don Victor Jewelers.
Fun fact - Riverside also ranks as #9 of the best cities overall for Asian professionals in the country.

The next Florida city on our list is Ocala, with a score of 53.92. It ranks well on nearly all scores, including a #3 position for its housing opportunity, #10 for the business community, and #14 for its economic opportunity. Ocala’s lowest ranking is for its community and representation, which ranks #45.
Ocala has the highest rate of Hispanic homeownership on our list, at 62.9%. This figure comes as a bit of a surprise, considering the Hispanic median income is only $42,598, the lowest on our list.
Also, the share of Hispanic-owned businesses at 13.9% is higher than the overall Hispanic population, which stands at 13.2%. Support local Hispanic-owned businesses by hiring driving services from Pronto Limousine Service, advertising services from Grafito Advertising, and design services from Architecture Studio.

The second California city on our top list of cities for Hispanic and Lantix Professionals is Merced, with a final score of 53.64. Two scores rank well for Merced, including a #3 position for community and representation and #13 for the business community. The other rankings, though, are subpar, with a #35 for housing opportunity and #53 for economic opportunity.
A combination of the lower housing opportunity score paired with the low Hispanic median income of only $46,409 for Merced results in a lower homeownership rate as well. The 45.1% Hispanic homeownership rate in Merced is the lowest on our list.
Thankfully, despite the lack of homeownership representation, Merced has 38.8% Hispanic-owned businesses. Get dance lessons from Salsa Merced Dance Studio, pick up some groceries from Carniceria Vallarta, or grab a bite to eat at Chef Rafa's Kitchen Agüeybaná.

Rounding out the hot spots in Florida for Hispanic and Lantix Professionals is Orlando, with a final score of 53.37. Orlando also hits the #8 spot on the list of the best cities for Black professionals as well.
Two scores rank well, including a #2 position for the business community and #8 for the community and representation. The other rankings, though, are subpar, with a #60 for economic opportunity and #70 for housing opportunity.
With a low housing opportunity score, it doesn’t come as a surprise to see the Hispanic homeownership rate of 47.5% in Orlando. Still, this is higher than Merced, California. The Hispanic median income is at $47,409, which also falls above Merced, among a couple of other cities on our list.
30.0% of businesses in Orlando are Hispanic-owned. Grab a bite to eat at Malao Bakery Food Truck, a juice from Grounding Roots, or shop around La Placita Latina Supermarket to make some Hispanic dishes yourself at home.

Closing out the hot spots in Texas for Hispanic and Lantix Professionals is Houston, with a final score of 52.37. It ranks well on almost all scores, including a #15 position for economic opportunity, #8 for the business community, and #25 for its housing opportunity. Houston’s lowest ranking is for its economic opportunity, which ranks #67.
The median income for Hispanics in Houston is $52,147, on the higher end of the cities on our list. As a result, the Hispanic homeownership rate is 52.6%.
Houston is quickly becoming a popular location for minorities, hitting at #3 of the best cities for Asian professionals and #4 of the best cities for Black professionals.
29.1% of businesses in Houston are Hispanic-owned. Hit the East End Farmers Market every Sunday, pick up some cigars from El Cubano Cigars, and feast on some Peruvian cuisine at Latin Bites.
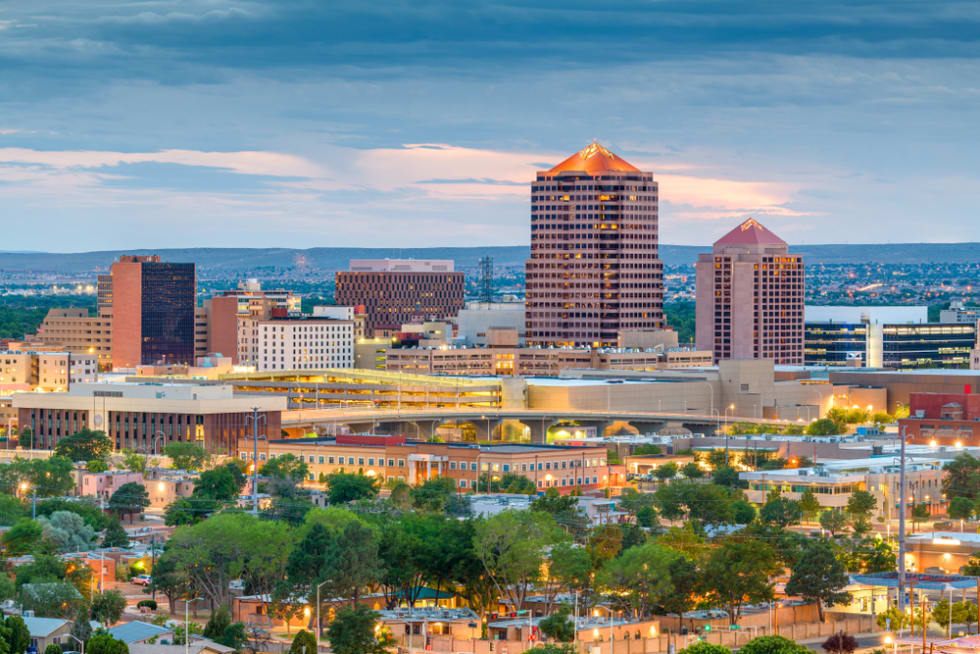
Finishing out the list of Hispanic and Lantix Professional hot spots across the country is Albuquerque, with a final score of 51.98. The city has decent scores all around, including a #11 position for its housing opportunity, #13 for the community and representation, and #15 for its business community. Albuquerque’s lowest ranking is for its economic opportunity, which ranks #47.
The median income for Hispanics in Albuquerque is $47,000, and the Hispanic homeownership rate is 52.3%. Both figures are on the lower end of the range of our list.
Thankfully, 31.6% of businesses in Albuquerque are Hispanic-owned. While this figure isn’t astronomical, it still ranks higher than a few on our list. Stop by for a quick trim at Justin Tyme Barber Shop, grab a refreshing beverage at Pop Fizz Express, or grab a full meal from Perea’s Tijuana Bar.
Use the table below to compare the cities and their respective scores. Below the Rankings table, you will find more granular information about the data and how our scores were calculated.
| Ranking | City | Final Score |
|---|---|---|
| 01 | Miami, FL | 61.68 |
| 02 | Corpus Christi, TX | 60.59 |
| 03 | San Antonio, TX | 58.83 |
| 04 | Lakeland, FL | 57.32 |
| 05 | Riverside, CA | 56.39 |
| 06 | Ocala, FL | 53.92 |
| 07 | Merced, CA | 53.64 |
| 08 | Orlando, FL | 53.37 |
| 09 | Houston, TX | 52.37 |
| 10 | Albuquerque, NM | 51.98 |
| Ranking | City | Community & Representation | Economic Opportunity | Housing Opportunity | Business Environment |
|---|---|---|---|---|---|
| 01 | Miami, FL | 10 | 19 | 76 | 01 |
| 02 | Corpus Christi, TX | 01 | 48 | 10 | 07 |
| 03 | San Antonio, TX | 06 | 63 | 12 | 04 |
| 04 | Lakeland, FL | 12 | 21 | 29 | 03 |
| 05 | Riverside, CA | 07 | 09 | 39 | 09 |
| 06 | Ocala, FL | 45 | 14 | 03 | 10 |
| 07 | Merced, CA | 03 | 53 | 35 | 13 |
| 08 | Orlando, FL | 08 | 60 | 70 | 02 |
| 09 | Houston, TX | 15 | 67 | 25 | 08 |
| 10 | Albuquerque, NM | 13 | 47 | 11 | 15 |
A total of 93 locations were included in this analysis. For individual factors (e.g., median income, homeownership rate), weights, and data sources, please view the complete data. Each factor was converted into a normalized score from 0 to 100 according to the distribution of values across locations. Normalized scores were then weighted and summed to give every location a final composite score between 0 and 100. A score of 100 would mean a location ranked first in every individual factor in the analysis.
We wrote this report in collaboration with the Apartment List Latinx ERG, also known as, "Listos". Pictured above are a few of those employees who helped us with this report! Employee Resource Groups (ERGs) at Apartment List are meant to serve as a safe space for Apartment List employees. They meet frequently to chat about their shared experiences, plan company-wide events, and form allyship across the company. Apartment List has 5 different ERGs that each represent a different identity group: Black, Asian, Latinx, Women, and LGBTQ+.
In unit laundry, Nest technology, Patio / balcony, Dishwasher, Pet friendly, New construction + more
In unit laundry, Patio / balcony, Pet friendly, Stainless steel, Walk in closets, Gym + more