February 2026 Rental Market Recap: What Multifamily Leaders Need to Know Now
The rental market is starting 2026 the same way it ended 2025: soft, but with one encouraging sign underneath the numbers. Year-over-year rent growth sits at -1.4%, the national vacancy rate has hit a new high of 7.3%, and median list-to-lease time has stretched to 41 days. At the same time, renter urgency is ticking up for the first time in over three years.
The slow conditions that defined 2025 have followed the market into the new year. Rents dipped again in January, empty units hit a record high, and it's taking longer than ever, 41 days on average, to go from listing a vacant apartment to signing a lease. Things haven't turned around yet.
But there's one number worth watching – for the first time in more than three years, renters are starting to show more urgency in their apartment searches. That hasn't translated into higher rents or lower vacancy yet, but it has the potential to show up there next.
Here's what Chief Economist Chris Salviati covered in our February 2026 Rental Market Insights webinar, and what you can expect in this blog:
- January 2026 Market Metrics: Where rents, vacancy, and time-to-lease stand.
- Leading Indicator: Renter urgency is turning for the first time in three years.
- Leasing Season Shift: Why demand is arriving earlier.
- Macro Forces: What will shape multifamily performance this year.
- Strategic Actions: How operators should respond.
January 2026 Market Snapshot: The Four Metrics That Matter
Rent Growth: Six Months of Declines, No Turn Yet
Rents fell 0.2% MoM in January, the sixth consecutive monthly decline. Year-over-year, the national median rent is down 1.4%, the weakest reading since mid-2023. Earlier in 2025 it looked like rent growth might finally turn positive. Instead, it's moved further negative.
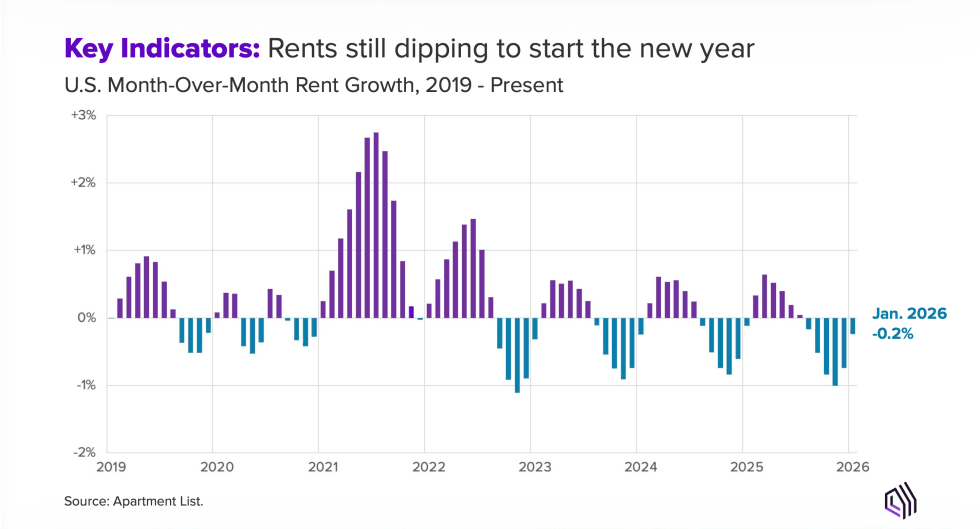
Source: Apartment List. U.S. Month-Over-Month Rent Growth, 2019–Present.
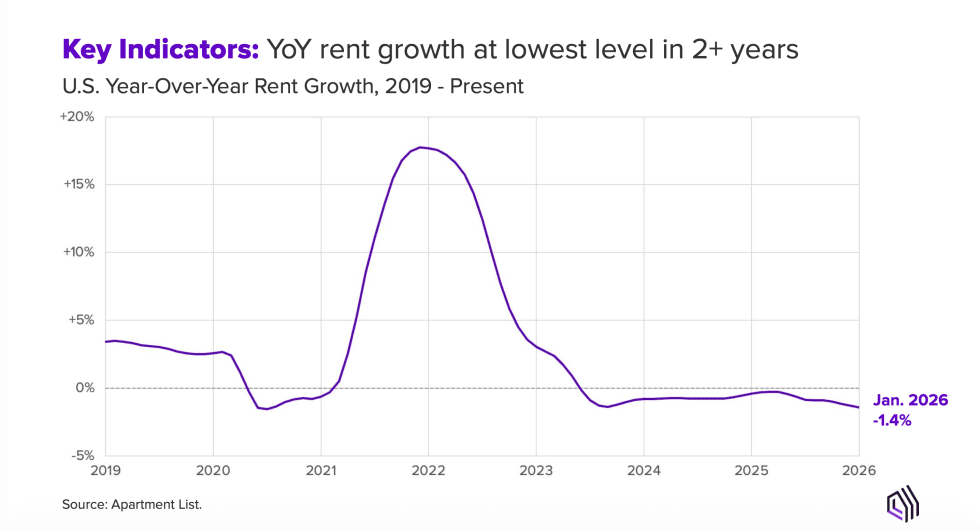
Source: Apartment List. U.S. Year-Over-Year Rent Growth, 2019–Present.
Zooming out helps put this in perspective. The national median rent in January 2026 was $1,353, just $9 above where it would have landed if rents had just grown at their normal, pre-pandemic pace all along. The big run-up of 2021 and 2022, when rents shot up nearly 18%, has now been almost completely reversed. That's not a crash, it's the market finding its way back to normal. However, it does mean operators shouldn't count on rising rents to do the heavy lifting this year.
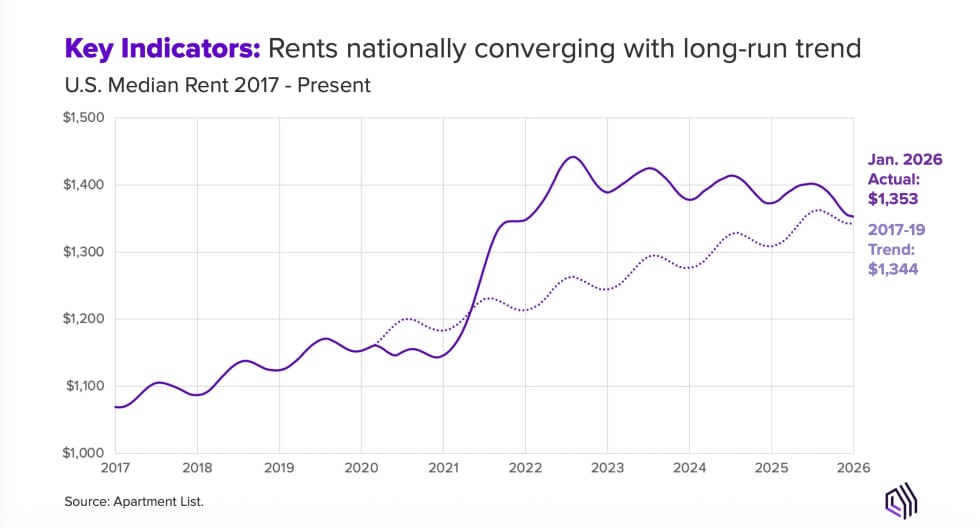
Source: Apartment List. U.S. Median Rent 2017–Present, with 2017–19 trend line.
Market Divergence: Where Rents Are Rebounding and Where They’re Breaking
Not every market is telling the same story right now. In fact, the gap between the best- and worst-performing cities is wider than it's been in years. Where you operate matters more than the national headline.
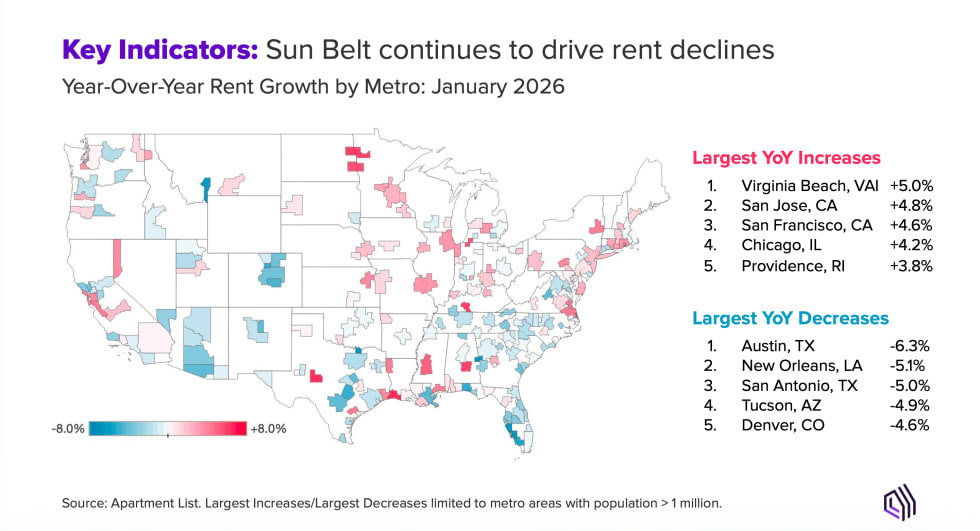
Source: Apartment List. Year-Over-Year Rent Growth by Metro, January 2026.
The Bay Area is one of the clearest bright spots. The San Francisco and San Jose metropolitan areas are both seeing rents rise, up 4.6% and 4.8% respectively compared to last year, fueled by a wave of tech hiring tied to AI companies and a push to get workers back into the office. Virginia Beach is leading all major metros at +5.0%. Chicago and Providence are also holding up well.
On the other end, Austin is the softest major market in the country, with rents down 6.3% from a year ago. The city built more new apartments than almost anywhere else over the past few years, and the market is still working through that excess. New Orleans, San Antonio, Tucson, and Denver are in similar territory, more new supply than the market can absorb quickly.
The national number tells you less and less. What matters is what's happening in your specific market: how much new supply has come in, how strong the job market is, and whether your city is affordable compared to nearby alternatives.
Vacancy: A Record 7.3% and Still Rising
The national vacancy rate hit 7.3% in January, the highest reading in the Apartment List index going back to 2017. It's being driven by two things happening at once: elevated new supply still coming onto the market, and renters who aren't in as much of a hurry to move. Even as construction has started to pull back from its 2024 peak, deliveries are still outpacing demand.
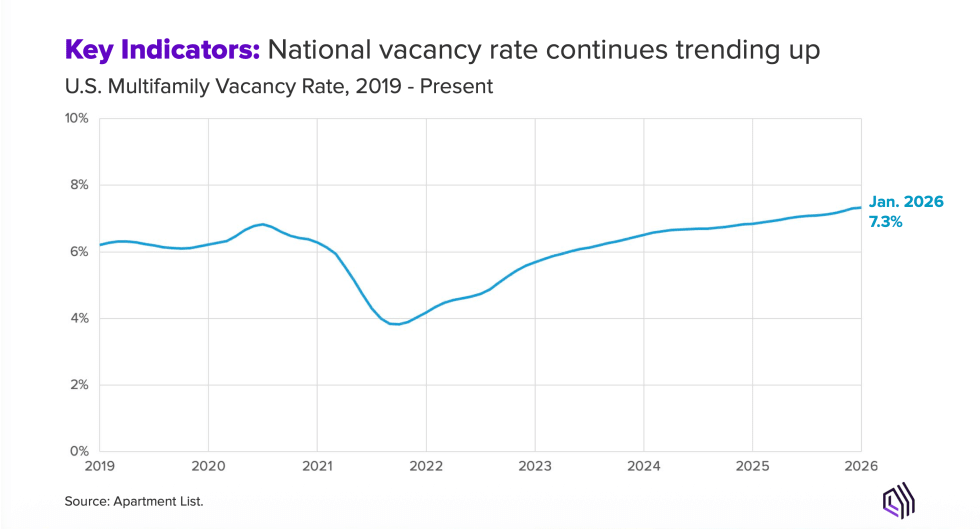
Source: Apartment List. U.S. Multifamily Vacancy Rate, 2019–Present.
The spread between cities is striking. For example, Austin is close to 10% vacancy while San Francisco is under 4%. As a reminder, the national number is a starting point, not the one to build your strategy from.
List-to-Lease Time: 41 Days and Slowing
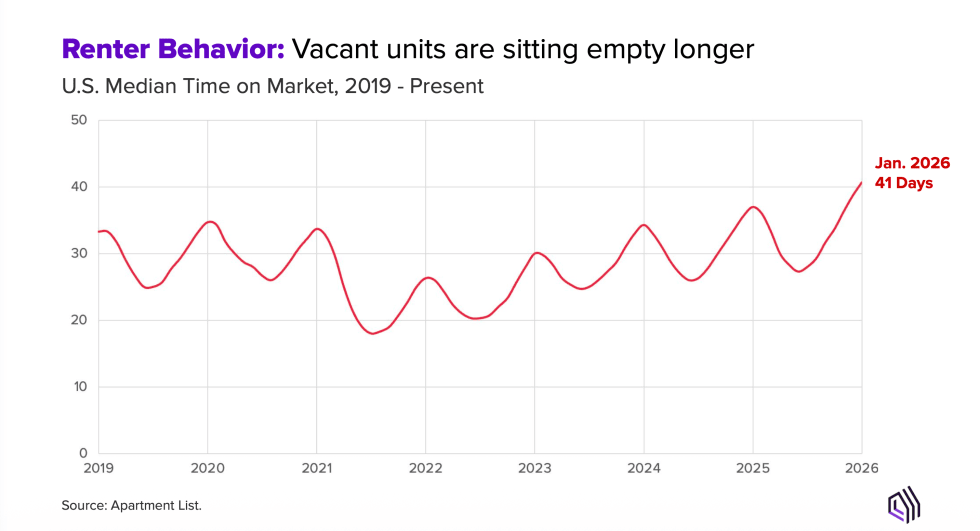
The median list-to-lease time, how long it takes from when a unit is listed to when a lease is signed, hit 41 days in January, a record high going back to 2019. In January 2022, the same figure was 26 days. Renters are taking their time, shopping around, and not feeling any pressure to decide quickly. That extra two weeks per unit adds up fast when you're carrying vacancies.
Concessions: Elevated, Expensive, and Here to Stay (For Now)
More than a third of properties on Apartment List are currently offering at least one month of free rent, meaning the concession rate sits at 35%, up from 25% a year ago. It peaked at 36% in December before dipping slightly in January, likely just a seasonal blip rather than a real turning point.
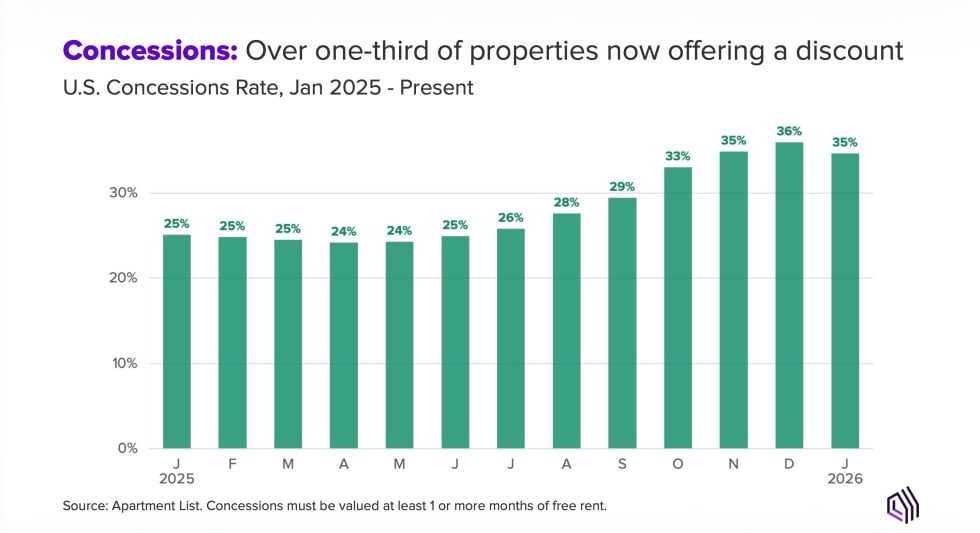
Source: Apartment List. U.S. Concessions Rate, January 2025–Present.
Renters today have more options, more time, and more leverage than they've had in years. Discounts help move units, but they also signal something about how renters are making decisions; carefully, without urgency, with an eye on upfront costs.
| Metric | Current Reading | Direction | What to Focus On |
|---|---|---|---|
| Year-Over-Year Rent Growth | -1.4% | Declining | Price to your local market, not national averages |
| Vacancy Rate | 7.3% | Rising | Keep units filled; don't let them sit |
| List-to-Lease Time | 41 days | Getting longer | Follow up fast; every day counts |
| Concession Rate | 35%+ of properties | Elevated | Use discounts strategically, not automatically |
Leading Indicator: Renter Urgency Is Finally Ticking Up
Because Apartment List sits at the start of the renter journey, our platform captures behavioral signals before they show up in rent or vacancy data. One of those signals just moved for the first time in three years.
When renters sign up on Apartment List, we ask them how important their move-in timeline is: are they just browsing, or do they need to move soon? For years, more and more renters were saying they were in no hurry. The low-urgency share peaked in late 2025 and has now started to decline. As of January 2026, 54% of renters are still searching at low urgency, but the direction has reversed.
"This is the first time in over three years that we've seen this low urgency share decline,” said Chris Salviati, Chief Economist, Apartment List
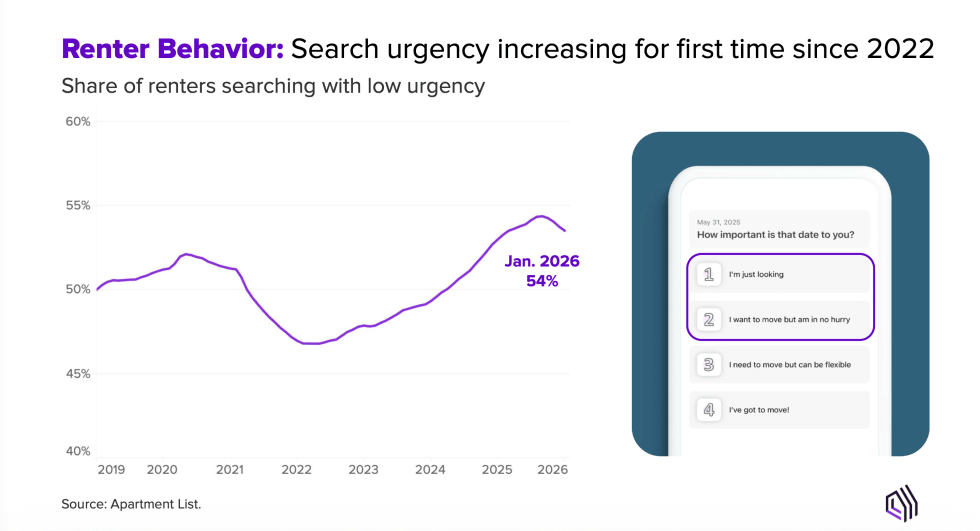 Source: Apartment List. Share of renters searching with low urgency, 2019–Present.
Why does this matter? Renters who say their move is urgent sign a lease in about six weeks. Renters who say they're just browsing take almost three months. As more renters start feeling pressure to move, properties should start filling faster, even if rents and vacancy numbers haven't moved yet. This is an early warning light, not necessarily a confirmed turnaround.
The key thing to understand: renter behavior tends to shift before the market data does. Operators who act on this signal now, rather than waiting for rents to confirm it, will be better positioned if things actually start moving.
Urgency by Market: High-Supply Cities Still Lag
Cities with a lot of new apartments tend to have the least urgent renters, because renters there know they have plenty of options and can afford to wait. San Antonio is at the bottom of the list, with nearly 59% of renters in no hurry. Denver, Riverside, and Portland are similar. Chicago renters are the most motivated to move among major cities, followed by Boston, St. Louis, and Baltimore.
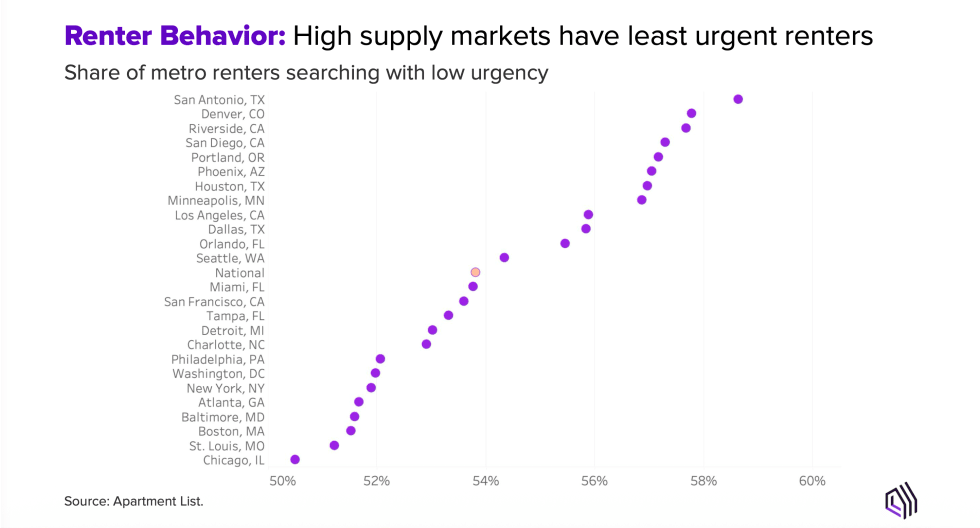
The big picture: in every one of the 25 largest metros, more than half of renters are currently browsing without urgency. That's the environment your leasing team is working in right now.
Seasonality Shift: Peak Leasing Now Starts in Q1
For three years running, rent growth has peaked in March, not May. The old playbook of ramp up slowly through spring and hit your stride in May and June is out of date.
Renters are moving earlier in the year than they used to. Remote work, earlier job start dates, and just a general shift in how people plan their lives have all pushed apartment searches forward on the calendar. The peak of the leasing season now arrives before most teams have traditionally started treating it like one.
What that means practically: if your team is still warming up right now, you're already behind. Renewal conversations, pricing decisions, and marketing should all be fully active in January, February, and March, not April.
The Forces Shaping Multifamily in 2026
Supply: Deliveries Are Peaking, But Pressure Remains
More than 600,000 units were delivered in 2024, followed by roughly 500,000 in 2025, well above what the market was absorbing in a typical pre-pandemic year. The good news is deliveries are expected to keep declining through 2026 and approach pre-pandemic norms by 2027. The supply pressure is easing, just not gone yet.
Labor Market: Demand Depends on Job Stability
Job growth slowed in 2025, running below the 2015–2019 average, and consumer confidence has softened. When people feel uncertain about their jobs, they tend to stay put – they don't move out on their own, they don't upgrade, they wait. That reluctance feeds directly into softer rental demand.
"The thing that's really going to be the X factor to keep an eye on is just what happens with the macro economy broadly and in particular the labor market, because that's really going to dictate demand," Salviati said.
Single-Family Rentals: A Growing Competitive Threat
A growing share of new homes being built aren't for sale, they're purpose-built rentals. Built-for-rent single-family now accounts for more than 10% of all new single-family construction. These homes appeal to families and older renters who want a yard, more space, or a quieter neighborhood but aren't ready to buy. It's a real competitor category, and it's not going away. The question for multifamily operators is what they can offer that a standalone rental house can't.
Policy Risk: Local Regulations Are Reshaping Pricing
Rent caps, broker fee reforms, zoning changes, and short-term rental restrictions are all being debated or passed in cities across the country. There's no single national direction, it depends entirely on where you operate. But local regulatory shifts are increasingly affecting how properties get priced and leased. Staying on top of what's moving in your markets is increasingly necessary.
Affordability: Cost Burden Remains Stubbornly High
Even with rents softer than they were two years ago, more than half of American renters, about 51.8%, are spending more than 30% of their income on housing, the threshold economists use to define being cost-burdened. More than one in four are severely burdened, spending over half their income on rent. Despite a few years of flat or falling rents, the cost burden rate hasn't budged.
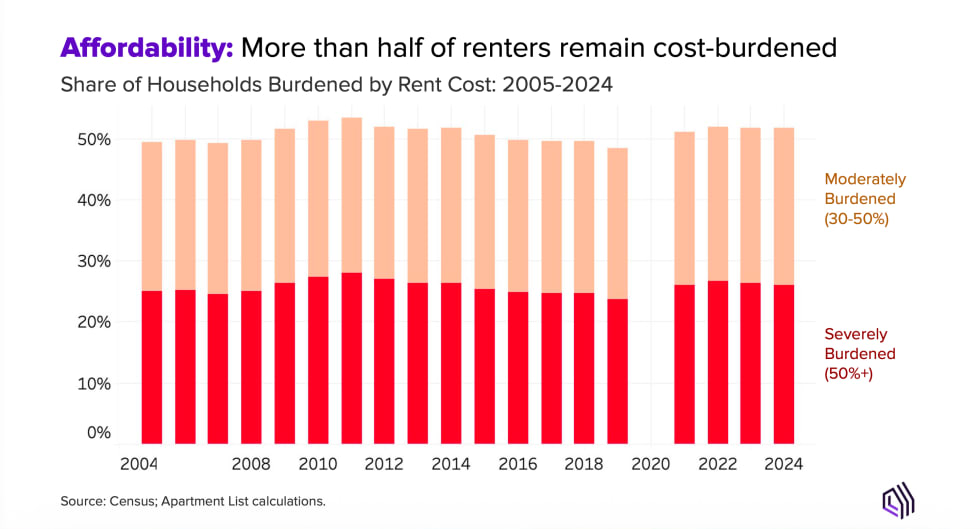
Source: Census; Apartment List calculations. Share of Households Burdened by Rent Cost, 2005–2024.
Every single one of the nation’s 25 largest markets got harder to afford between 2019 and 2024. Florida is the toughest state for renters with Miami near the top nationally. Sun Belt cities that used to be affordable escape valves, places like San Antonio, Phoenix, and Charlotte, have gotten significantly more expensive as people moved there. For operators, this plays out in two practical ways: renters shop more carefully and take longer to commit, and politicians in these markets are more likely to push for rent control and fee limits. Both things are worth paying attention to.
Your Multifamily Operator Playbook for Early 2026
1. Price to Your Submarket, Not the Headlines
Nationwide rent growth stands at -1.4%. Your market might be +4% or -6%. Pricing strategy built on what's happening nationally is likely wrong for where you actually operate. Get specific: look at what comparable properties nearby are charging, how quickly they're filling, and what concessions they're offering. That's the data that should drive your decisions.
2. Prioritize Occupancy Over Aspirational Rents
When vacancy is this high and it's taking 41 days to fill a unit, the cost of sitting empty adds up fast. Lost rent, turnover costs, and the longer a unit sits, make it harder to lease. Offering a moderate discount to get a good tenant in the door is usually the better financial move than holding firm on rate and waiting another month or two.
3. Increase Follow-Up Speed and Clarity
Renters right now have time on their side. They're not in a rush. That means they'll go with whoever makes the process easiest, e.g. whoever responds quickly, answers questions clearly, and doesn't make them jump through hoops. Speed and clarity in follow-up is genuinely a competitive advantage right now.
4. Use Concessions Strategically, Not Automatically
A free month of rent is a real cost. Use it when it makes sense. For example: to close a deal, to stay competitive in a soft market, but don't offer it reflexively to every prospect. The properties winning leases in slow markets aren't always the ones with the biggest discount. They're the ones that make renters feel confident and informed. Clear pricing and honest communication close deals too.
5. Treat Q1 as Peak Leasing Season
March is now when rent growth peaks, not May. That's been true for three years running. If your marketing, renewals, and pricing aren't fully dialed in right now, you're already ceding ground on the most important window of the year.
Outlook for 2026: Recovery or Another Reset?
When asked to call the year, Chief Economist Chris Salviati was refreshingly straight about it.
"It's really kind of a toss-up to me, to be perfectly honest. This could totally be the year where we see rents and occupancy strengthen. But I also wouldn't be shocked if this is another year of down rents,” he said.
The teams that will come out ahead aren't the ones betting on a recovery, they're the ones running tighter operations regardless of which way things break.
What This Means for Your Portfolio
The rental market is carrying its soft footing into 2026: rents are still declining, vacancy is at a record high, and renters are taking longer to commit than at any point in the past several years.
The playbook is the same regardless of which direction 2026 breaks: multifamily operators who price to their local market, keep units filled, and move faster on every lead will outperform those waiting for a cleaner signal. The data is clear enough to act on... the question is whether your team is already in motion.
Watch the full webinar recording. Experience the complete breakdown from Chief Economist Chris Salviati, including all key indicator charts, metro-level data, and live Q&A from multifamily operators across the country.
Stay informed with ongoing market insights. Follow the Apartment List economics team for monthly data releases, market commentary, and the trends shaping renter behavior:
- Research blog: check out monthly market updates and analysis.
- Download the data: rent estimates and underlying datasets.
- Reach out: research@apartmentlist.com with questions, feedback, or to connect with the team.
Frequently Asked Questions
Why Are Rents Still Falling in 2026?
Two things happening at once: the supply pipeline delivered record numbers of new units in 2024 and 2025, and the labor market has softened enough that fewer people are actively moving. There are more available units than motivated renters to fill them, especially in markets that built heavily in recent years.
Will Vacancy Rates Stay Above 7%?
It'll likely stay elevated above 7% through most of 2026. The supply pipeline is easing but hasn't normalized yet, and demand recovery depends heavily on the labor market. High-supply markets like Austin could see the vacancy rate climb further; markets with fewer new deliveries and stronger job growth are better positioned to hold.
What Is the Renter Urgency Signal?
When renters sign up on Apartment List, we ask how soon they need to move. That answer predicts how quickly they'll sign a lease. High-urgency renters lease in about six weeks, low-urgency renters take around three months. The urgency rate is ticking up for the first time since 2022, which suggests renters may start moving faster soon, even if rent growth and vacancy data haven't shifted yet.
Which Rental Markets Are Performing Best?
Virginia Beach, San Jose, and San Francisco are leading in year-over-year rent growth. Broadly, the Northeast and Midwest are outperforming the Sun Belt, cities like Chicago and Providence are seeing positive rent growth while Austin, Denver, and San Antonio are still softening.
When Could Rent Growth Turn Positive Again?
Genuinely hard to say. If the labor market stabilizes and renter urgency continues rising, year-over-year rent growth could turn positive by mid-2026. If the economy weakens, another year of negative comps is equally plausible. The urgency signal is the most encouraging leading indicator available right now.
How Should Multifamily Operators Budget for 2026?
Don't build your plan around rent growth that may not materialize. Focus instead on occupancy, treat concession costs as a real line item, and price based on what's happening in your specific submarket rather than national trends.