How Accessible Is The Housing Market?
- In this article, Apartment List explores housing accessibility: whether or not the market provides for those living with disabilities. We focus on accessibility as it relates to physical (i.e., ambulatory) disabilities.
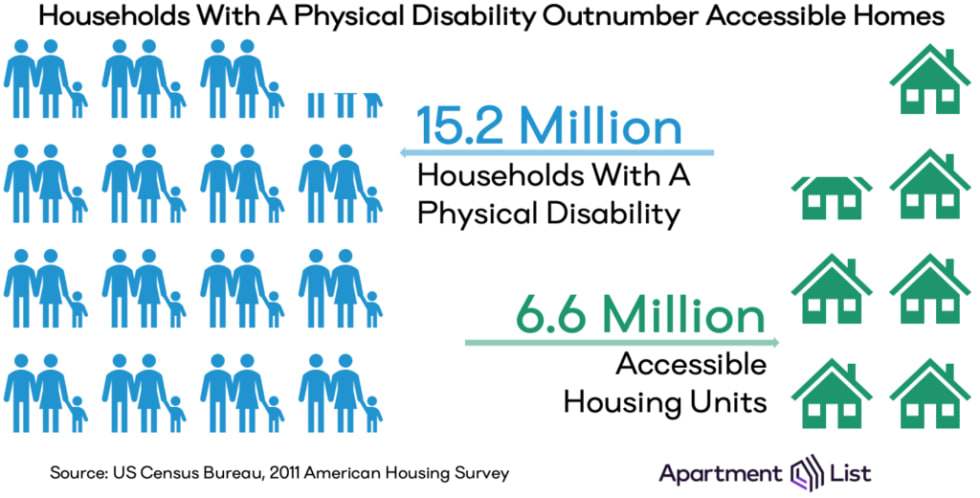
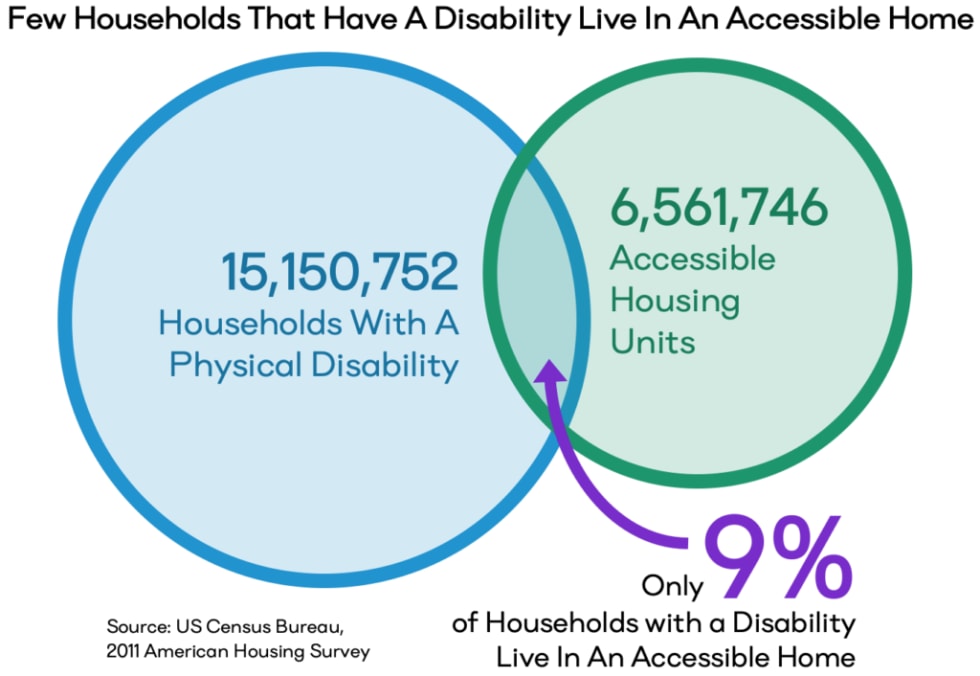
- In nearly all major cities across the country, renters who have a physical disability spend a greater share of their income on housing costs. This is due, in part, to the fact that accessible housing is under-supplied; in the United States there are 15.2 million households with a physical disability but only 6.6 million homes that are “livable to people with moderate mobility difficulties.”
- Accessible homes are poorly aligned with the families that need them. Of the nation’s 6.6 million accessible homes, only 1.3 million are occupied by a household with a physical disability.
- Newer homes — particularly those built in multi-family units — are becoming more accessible. Over 20 percent of multi-family homes built during the 2000s are accessible, more than double the rate from three decades earlier. This favors renters who are more likely to live in multi-family housing.
- However, renters with disabilities may continue to struggle with affordability since newer accessible homes tend to be more expensive than the older, less-accessible homes they replace.
Affordability & Accessibility
For renters living with a physical disability, accessibility is of utmost importance when searching for a new home. No matter how appealing the price or location, a home is not suitable unless it accommodates the physical needs of its tenants. A number of laws exist to protect renters with a disability from housing discrimination and to bolster the availability of accessible dwellings. Nevertheless, many renters searching for housing that is both affordable and accessible encounter unique challenges.
Housing costs present a significant financial challenge for many renters throughout the country. Nearly half are officially “cost-burdened,” paying more than the recommended 30 percent of their income on rent. Unfortunately, our analysis of American Community Survey data reveals that affordability concerns are even greater among those with physical disabilities.
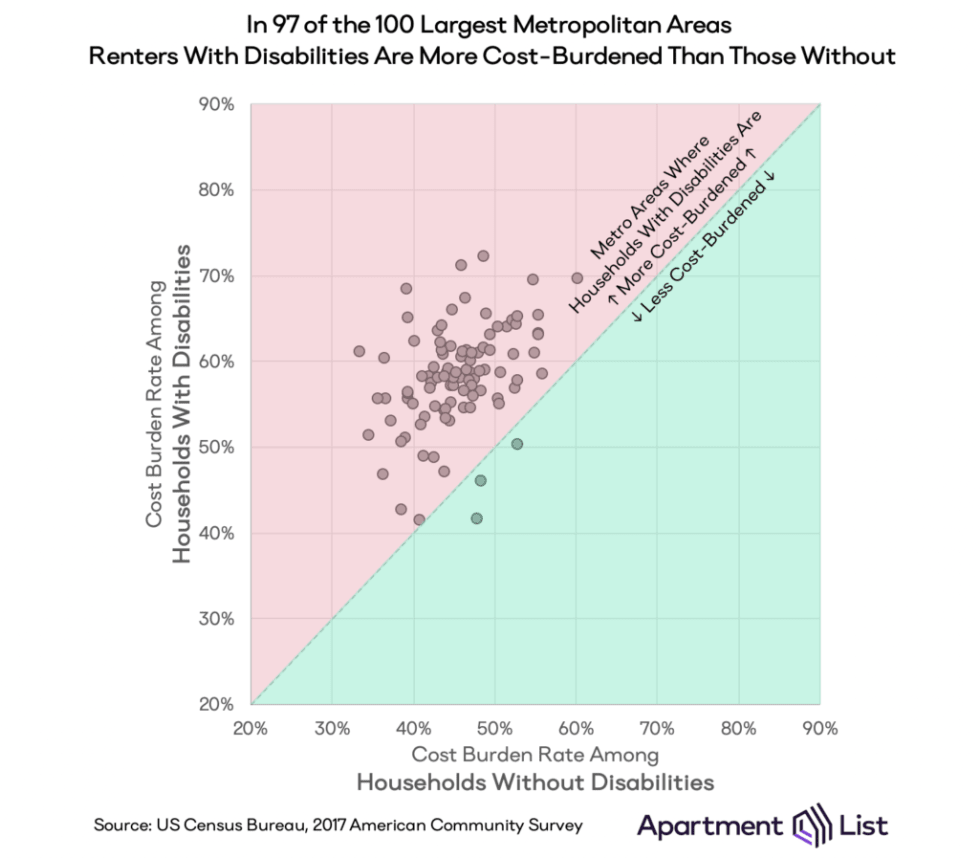
57 percent of renters with a physical disability are cost-burdened, compared to 46 percent of renters without physical disabilities. Moreover, the cost burden rate is higher for renters with a physical disability in 97 of the nation’s 100 largest metropolitan areas.1 What drives this disparity? Households in which at least one person has a disability have lower incomes but are unable to find proportionally lower rents. The median household income of renters with a disability is 45 percent lower than for those without, but median rent is only 20 percent lower.
Download Complete Metro-Level Data
This affordability gap implies that most local housing markets are not providing sufficient affordable and accessible units to the renters who require them. To understand the severity of this problem, we take a closer look at the Census Bureau’s 2011 American Housing Survey (AHS), which collects information on the accessibility of over 132 million housing units across the country, as well as the disability status of each unit’s residents. We find that while housing accessibility is improving over time, it carries with it a cost premium that makes high-quality housing unaffordable to many renters with disabilities.
Defining Disability & Accessibility
The concepts of disability and accessibility each exist on a spectrum. Disability can refer to a diverse range of physical or cognitive impairments, while housing accessibility can range from small features like grab bars to major structural installations like elevators. To avoid definitions that are too broad (or too strict), we borrow from a HUD research paper that sought expert opinion to construct valid definitions. Here, disabilities are limited to mobility constraints; a household is considered to have a disability if any member has difficulty walking or uses a mobility device (e.g., wheelchair, walker). Meanwhile, a housing unit is considered accessible if it meets all of the following criteria: it has stepless entry from the outside, it has a bathroom and bedroom on the entry level or an elevator in the unit, it has no steps between rooms or steps with grab rails, and it has an accessible bathroom with grab bars. Such units are considered by HUD to be “livable to people with moderate mobility difficulties.”2 With these definitions in place, we analyze the intersection of disability and accessibility in the housing market.
Across the Country, Accessible Housing Is Under-Supplied
Using the definitions above, we find that over 15 percent of households (15.2 million) are home to someone with a physical disability, yet only 6 percent of housing units (6.6 million) are adequately accessible. Even if every accessible home was occupied by a household with a disability, there would still be 8.6 million households in need.
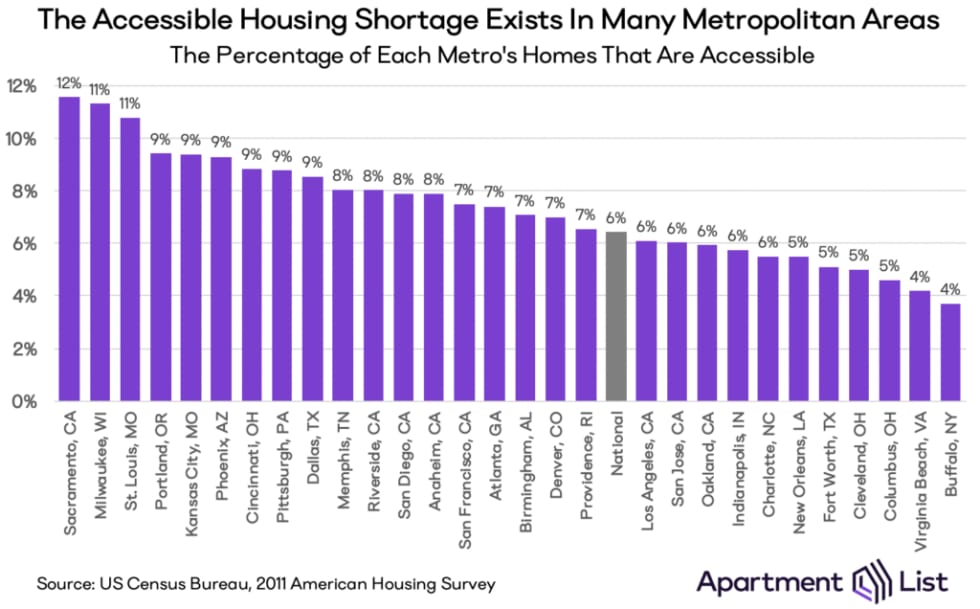
This undersupply is a local problem as much as it is a national one. The AHS survey sampled 29 large metropolitan areas across the country, and in every one the number of households with a physical disability exceeds the number of accessible homes. There are only three metros — St. Louis, MO; Milwaukee, WI; and Sacramento, CA — in which more than 10 percent of homes are accessible. And even in Sacramento, the metro with the most dense supply of accessible homes (12 percent of all units), there are still 21,000 fewer accessible homes than households with a physical disability.
Download Complete Metro-Level Data
Many Accessible Homes Are Not Utilized By the Households That Require Them
Accessible homes are undersupplied even if we assume that they are routinely occupied by households that have a disability. In reality, the situation is made worse by the fact that accessible homes and individuals with disabilities are rarely paired together. Nationally, only 9 percent of households that have a physical disability live in accessible homes, and only 20 percent of accessible homes are occupied by households with a physical disability.
In some circumstances this mismatch is understandable. An individual without a disability will not turn down an attractive housing option just because it has accessible features. Alternatively, someone who develops a physical disability may prefer to continue living in their non-accessible home rather than go through the process of moving. For example, many seniors prefer to “age in place” even if their homes do not accommodate ambulatory difficulties that arise. So even if there was an accessible unit for every household that needs one, it is unlikely that the two would be paired one-to-one. Nevertheless, the fact that nearly 14 million households have a physical disability and live in homes that lack adequate accessible features highlights a real housing equity gap for those living with disabilities.
Newer Housing — Particularly Rental Housing — Is Becoming More Accessible
There is reason to be optimistic about the future of housing accessibility: over the last century, newer construction has become more amenable to people with mobility difficulties. While less than 5 percent of homes built before 1950 are accessible, the percentage has risen steadily with each decade of newer construction. By the 2000s — a decade in which homes were built in record numbers — over 10 percent of new residential construction was accessible. This bodes particularly well for renter households, as a majority of this new accessible construction is concentrated in multi-family housing. Not only is multi-family housing more commonly utilized by renters, it represents the fastest-growing sector of construction following the Great Recession. In the 2000s, over 20 percent of new multi-family homes were accessible, compared to less than 10 percent of new single-family homes.

Nevertheless, Affordability Concerns Persist for Renters With Disabilities
Even as the nation’s inventory of accessible housing expands, affordability will remain a salient concern for renters living with a physical disability. While newer homes tend to be more accessible, they also tend to be more expensive. After controlling for location and number of bedrooms, AHS data show that homes built in the 2000s rent for 14 percent higher than those built in the 1990s and 31 percent higher in the 1980s. Furthermore, accessibility requirements may lead to higher construction costs that get passed on to renters. Again controlling for location and size, accessible homes rent for 10 percent more than inaccessible ones. So even as new supply hits the market, we expect that much of it will be affordable only to those with higher incomes.
Demand for accessible housing has never been greater. The United States population is aging rapidly, and the Census Bureau estimates the number of seniors will double over the next forty years. As Americans live longer, they will become increasingly susceptible to health conditions that necessitate accessible living. Today, the current under-supply is leading many families to live in homes that do not match their needs. For a more equitable future, policy makers and developers must ensure that new accessible housing proliferates across geographies and levels of income.
- The three exceptions are Augusta GA, McAllen TX, and New Haven CT.↩
- This is the middle of three levels of accessibility defined in the HUD paper. The less-restrictive definition is "potentially modifiable," which means that the unit has "some essential structure features for accessibility, but would not be accessible without further modification." The more-restrictive definition is "wheelchair accessible," which means that the unit "has a minimum level of accessibility so that a wheelchair user can live in the home and prepare his or her own meals." We selected the middle option as it most closely aligns with the needs of physical disability, as we have defined it.↩
Share this Article