October 2026 Rental Market Recap: A Rebound Gains Ground, With Demand Still Uncertain
The rental market's rebound is spreading. Through September, pricing and occupancy strengthened across most large metros as supply pressure from the construction boom kept easing. National rents still sit slightly below a year ago, but 2026 is on track for positive full-year rent growth.
Two signals temper the recovery outlook. Concession rates remain elevated, especially in Sun Belt markets, and the rebound in renter search urgency has stalled out. Improving national indicators do not yet establish stronger pricing power for an individual property.
Those signals framed Apartment List's Rental Market Insights webinar on October 7, 2026, presented by Chief Economist Chris Salviati. This recap covers the September indicators, the regional picture, the newly previewed concessions indicator, and the supply and demand factors that will shape 2027.
September Rental Market Indicators Show Progress, With Softness Remaining
Rent Growth: The Off-Season Dip Has Begun, Just Barely
- September 2026: According to the Apartment List Rent Index, the national median rent fell 0.1% month over month.
- Seasonal context: Rents typically dip once the fall off-season begins and fewer households move.
The size of the decline matters more than the seasonal dip itself. September's 0.1% decline signals a shallow start to the off-season.
Annual Growth: Negative, but Closing In on Zero
- September 2026: Apartment List data put national year-over-year rent growth at -0.4%.
- Trend: The annual figure has improved through 2026, and the webinar described the year as on track for positive full-year rent growth.
Positive full-year growth remains an outlook, not a result. It depends on how rents perform through December.
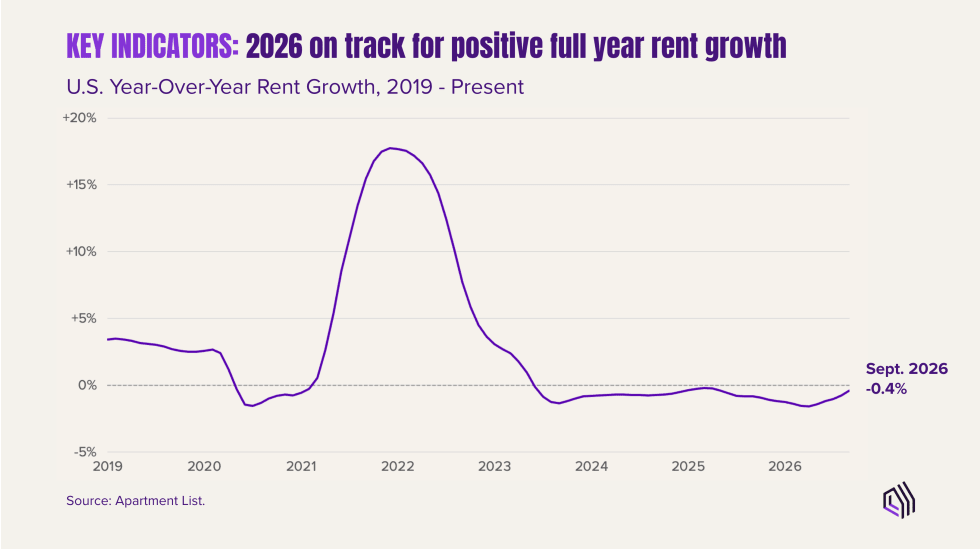
National year-over-year rent growth was -0.4% in September 2026, with 2026 on track for positive full-year growth. Source: Apartment List.
Rent Level: Back on the Long-Run Trend
The Apartment List national median rent was $1,388 in September 2026. Had rents followed the 2017 to 2019 growth trend throughout the 2020s, the median would be $1,394. The two lines have converged: the pandemic surge and the declines that followed roughly offset each other. Rents remain well above 2019 levels in dollars; they no longer run ahead of the long-run growth line.
Vacancy: Tightening as the Construction Boom Ends
- September 2026: Apartment List's national multifamily vacancy rate was 7.0%.
- Direction: Down from its peak earlier this year, as the construction boom winds down.
The decline is gradual, but occupancy is tightening after a long stretch of softening.
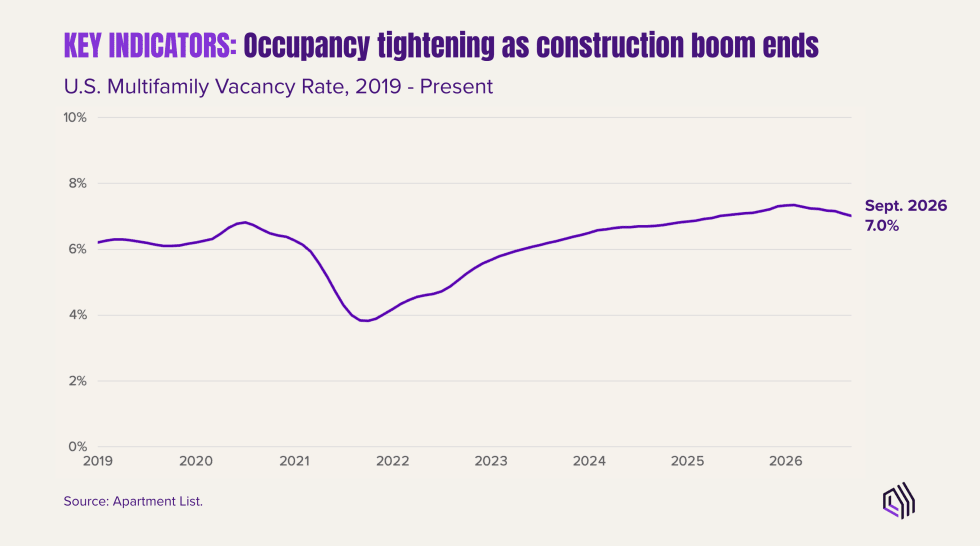
The national multifamily vacancy rate eased to 7.0% in September 2026, down from its peak earlier in the year. Source: Apartment List.
Time on Market: Slow for the Season
According to Apartment List, the median vacant unit took 34 days to lease in September 2026. Time on market typically rises in the fall. The concern is that units are still turning over more slowly than usual for the season.
Search Urgency: The Rebound Has Stalled
Apartment List measures search urgency from how renters describe their move-in timing when they register. In September 2026, 47% of Apartment List renters searched with high urgency. Because renters search before they sign, urgency offers an early read on demand. Its stalled rebound adds uncertainty to the outlook for leasing activity.
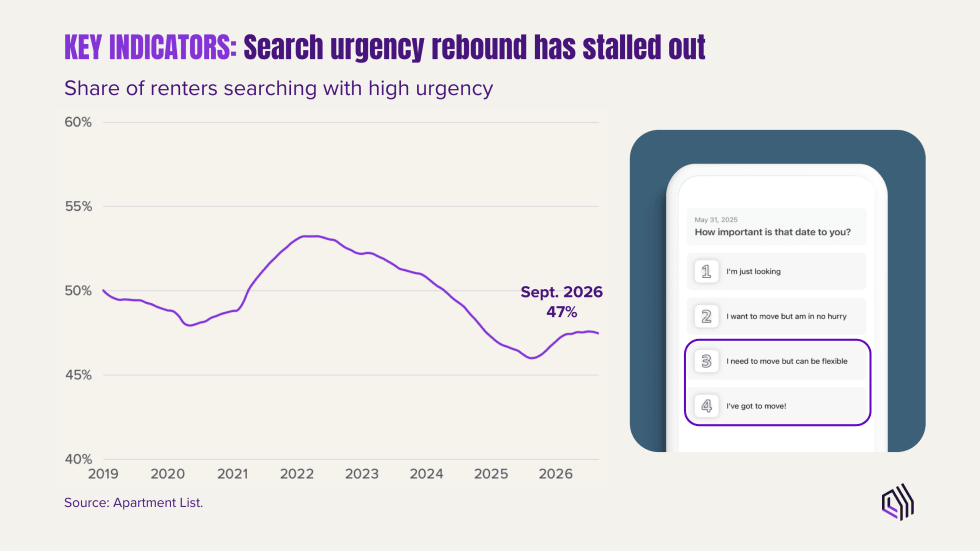 47% of Apartment List renters searched with high urgency in September 2026, and the rebound in urgency has stalled out. Source: Apartment List.
Taken together, rent growth and occupancy are strengthening, but slow September leasing and stalled renter urgency suggest the demand rebound remains incomplete.
Regional Recovery Is Spreading, With Significant Differences Between Markets
July's recap described a national turn carried by a handful of markets. The September data presented in October show pricing and occupancy strengthening in most markets, though pricing is not rebounding across the board. The Sun Belt continues to drive rent declines. Among metros with more than 1 million residents, the largest September gains were in San Francisco, San Jose, Virginia Beach, Milwaukee, and Chicago, and the largest declines were in San Antonio, Las Vegas, Denver, Phoenix, and Austin.
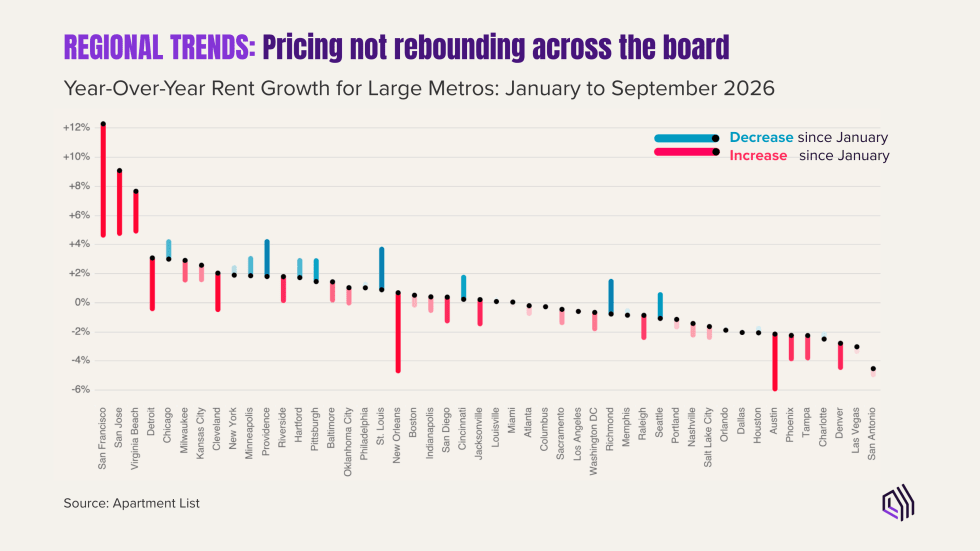 Among large metros, more markets have seen year-over-year rent growth rise since January 2026 than fall, led by San Francisco and San Jose. Source: Apartment List.
San Francisco: Bay Area Gains Lead the Nation
- San Francisco metro: According to Apartment List, rent growth was 11.0% year over year in September 2026, the fastest of any large metro.
- San Jose metro: 7.9% year over year, the second fastest.
These gains stand out against a national market where rents remain slightly lower than a year ago. Operators elsewhere should look to their own metro's trajectory when assessing pricing conditions.
Austin and the Sun Belt: Declines Moderating as Supply Pressure Eases
Austin is the clearest example among the Sun Belt markets the webinar described as in a rebound phase as supply pressures ease.
- September 2026: Austin rents were down 2.9% year over year, per Apartment List data.
- Other supply-heavy markets: Phoenix rents were down 2.9%, Denver 3.4%, and San Antonio 5.1% year over year in September 2026.
Rents in these markets remain below last year's levels. The January-to-September comparison shows recovery taking shape unevenly across markets. A moderating decline signals improvement even while annual growth remains negative.
Occupancy tells a parallel story. It has risen in most large metros since January, including supply-heavy Sun Belt markets, as new units are absorbed.
A New Concessions Indicator Reveals the Discounts Behind Listed Rents
The webinar introduced a new Apartment List concession rate: the share of properties in Apartment List's concession dataset that offer at least one month of free rent on new leases in a given market. It measures how widespread free-rent offers are, not the average discount size or the share of renters who receive one.
Because rent specials arrive as unstructured text and vary in type and value, the economics team uses AI-powered parsing to turn them into structured data before counting qualifying offers.
Concession rates remain elevated nationally, especially in Sun Belt markets.
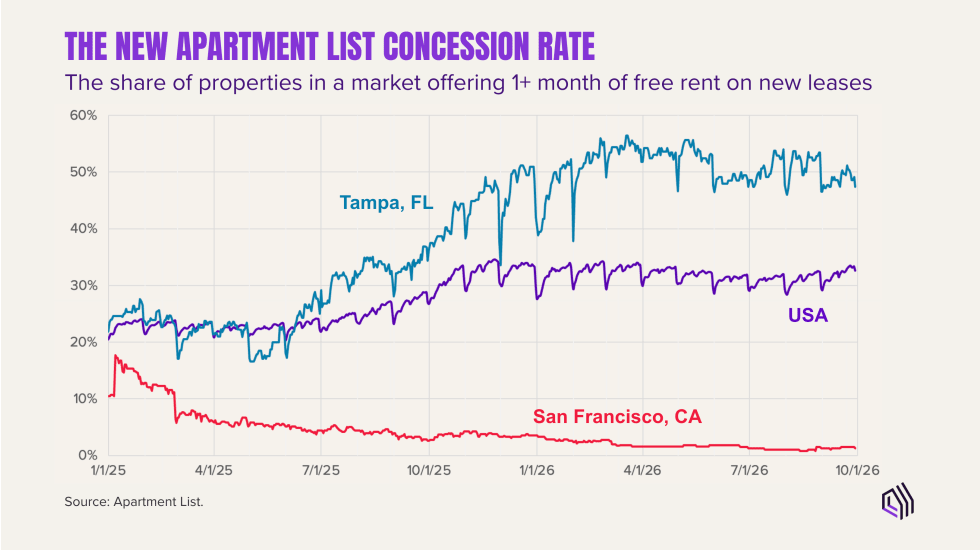
Tampa runs well above the national concession rate and San Francisco well below it, per the Apartment List concession rate previewed in October 2026. Source: Apartment List.
The regional spread is substantial. Tampa's concession rate runs above the national rate, while San Francisco's runs well below it. This difference matters when comparing a property's offer with local alternatives.
Apartment List's rent-growth figures are based on listed rents and exclude concessions. Where free-rent offers are widespread, listed rents can understate how soft a market is. Accounting for concessions can widen the cost gap between stronger and weaker markets.
What Will Shape the Rental Market in 2027?
The 2027 outlook depends on how easing supply pressure interacts with rental demand.
Supply: Past the Peak, Still Meaningful
The HUD data presented in the webinar show deliveries continuing to fall as permitting slows. The construction pipeline still contained roughly 667,000 apartments. Supply pressure is easing while construction continues at a meaningful level.
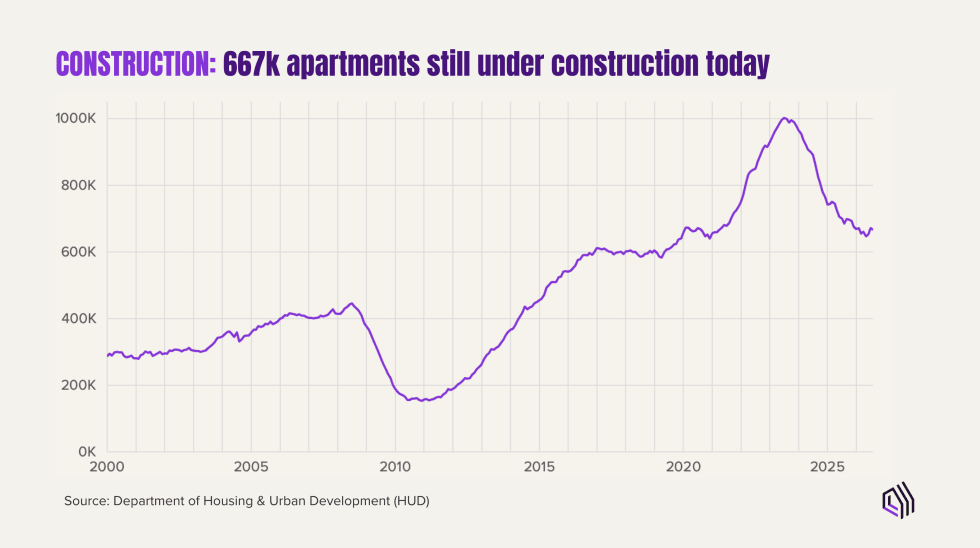
The October 2026 webinar reported about 667,000 apartments under construction. Source: Department of Housing and Urban Development (HUD), via Apartment List.
Demand: The Open Questions
- Jobs: Job growth has been net positive but unsteady, per Bureau of Labor Statistics data, and that unevenness feeds uncertainty into housing demand.
- Consumer sentiment: Many Americans feel pessimistic about the economy, per the University of Michigan survey. Financial uncertainty can lead households to delay large decisions such as moving. Weak sentiment is a risk signal, not proof that moves are falling.
- Inflation: Renewed inflation concerns are eating into household budgets, per the Consumer Price Index.
- Mortgage rates: Elevated 30-year fixed rates, per Freddie Mac, could keep would-be buyers renting longer, a strain on those households and a modest support for rental demand.
- Household formation: Annual Census Bureau data show a downward trend in the number of new U.S. households. Slower household formation can limit new rental demand.
2027 Outlook: A Rebound With Demand Risks
The webinar's outlook for 2027 is largely solid, with some downside risk. Slower apartment deliveries support the rebound, while uneven demand signals leave its strength uncertain.
What Multifamily Operators Should Watch Now
For operators, the practical takeaway is to assess the rebound at the property and submarket level.
- Read rent growth, occupancy, and concessions together. A market where listed rents are down and free-month offers are widespread is softer than the rent figure alone suggests.
- Compare competing offers on effective rent over the same lease term. Separate temporary free-rent incentives from ongoing listed rent. With concession rates elevated, especially in Sun Belt metros, listed rent alone misses the discount that changes the cost comparison.
- Look for sustained local improvement before assuming pricing power. A metro-level trend does not establish pricing power at every property, and units are still turning over more slowly than usual.
- Track renter urgency and local demand alongside the pipeline. Construction trends help frame future competition. Job growth, household formation, and search urgency help assess the demand available to absorb it.
Watch the October Webinar
Watch the full October 7, 2026 webinar recording. It includes the full indicator walkthrough, metro-level data, the concessions preview, and the live Q&A.
To follow Apartment List's research:
- Research blog: Monthly rent reports and ad hoc analysis at apartmentlist.com/research.
- Download the data: Rent estimates, vacancy, and the underlying datasets. [Download the data]
- Reach out: research@apartmentlist.com with questions or feedback.
Share this Article